
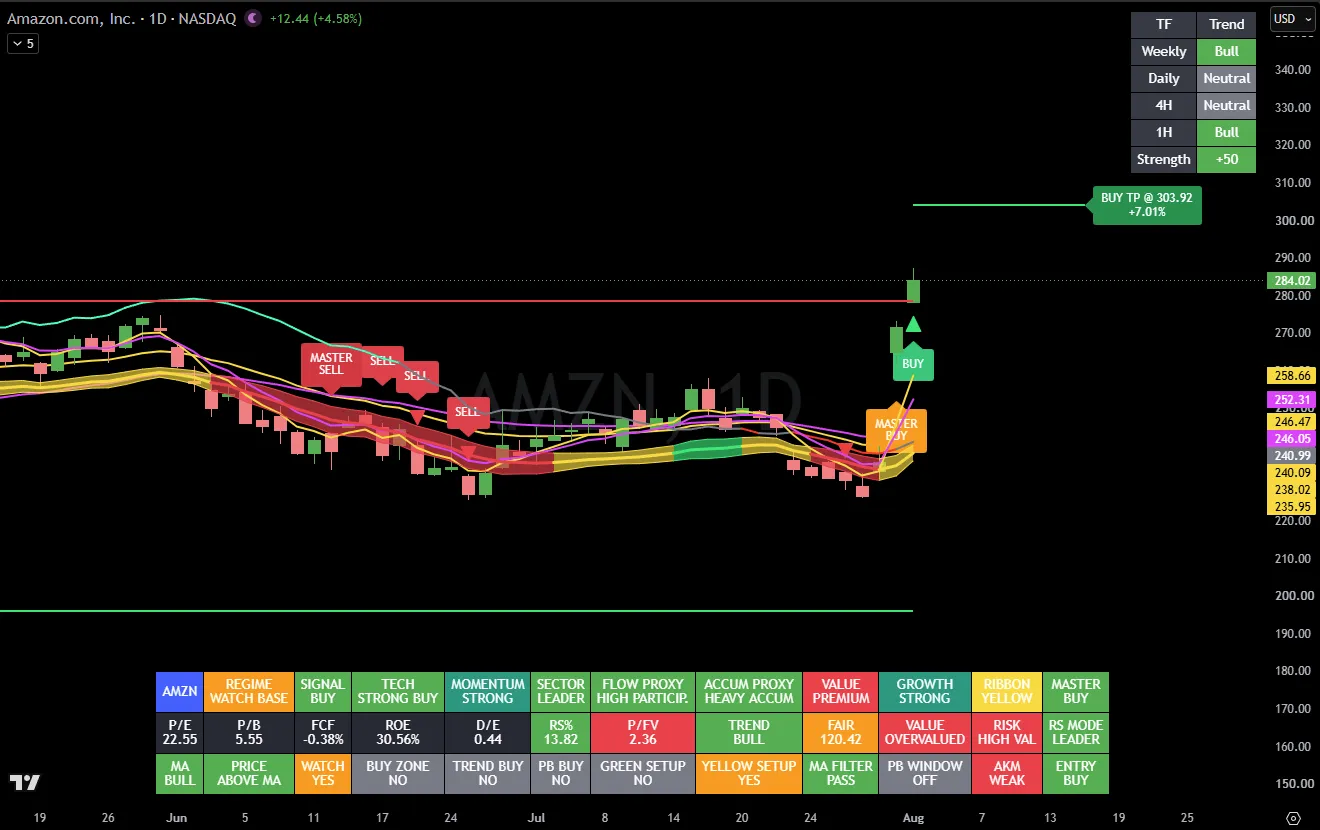
Amazon has delivered a fundamentally credible breakout driven by accelerating AWS demand, stronger operating profits and evidence that its AI infrastructure spending is generating revenue. The Delphi Intelligence Smart Money trading strategy indicator shows Master Buy is supported by heavy accumulation and strong momentum, but the yellow ribbon, weak AKM and neutral Daily/4H readings show that full trend confirmation is still developing.
The bias remains bullish, but the disciplined strategy is to buy a pullback toward $278–$280 or a confirmed breakout above $287 rather than chase the earnings gap. The immediate upside objective is $300–$303.92.
Delphi Intelligence Stock Analysis — Amazon.com
Ticker: NASDAQ: AMZN
Timeframe: Daily
Chart price: $284.02
Immediate Delphi target: $303.92
Current context: Post-earnings breakout and record-high expansion. Amazon closed at $284.02 after reaching an intraday high near $286.90, with its market value exceeding $3 trillion for the first time.
1. Delphi Technical Reading
Trend and market structure
AMZN has produced a powerful bullish reversal from its late-July low, followed by a large earnings gap above the previous resistance around $279–$280.
The Delphi multi-timeframe model shows:
- Weekly: Bull
- Daily: Neutral
- 4H: Neutral
- 1H: Bull
- Trend Strength: +50
This is a bullish transition, but not yet complete multi-timeframe confirmation. The weekly and short-term trends have turned bullish, while the Daily and 4H models still need time to absorb the earnings gap.
Dashboard interpretation
The strongest dashboard readings are:
- Master Buy
- Signal: Buy
- Technical: Strong Buy
- Momentum: Strong
- Sector: Leader
- Flow Proxy: High Participation
- Accumulation Proxy: Heavy Accumulation
- Price Above MA
- MA Bull
- Entry: Buy
- Relative Strength Mode: Leader
These readings indicate that the breakout is supported by strong participation rather than a low-volume price spike.
However, several readings remain transitional:
- Regime: Watch Base
- Ribbon: Yellow
- AKM: Weak
- Green Setup: No
- Trend Buy: No
- Buy Zone: No
- Daily and 4H: Neutral
Therefore, this is best classified as a Master Buy breakout transition, not yet a fully matured green-ribbon trend.
Setup stage
Bullish breakout confirmed, but currently extended.
The Master Buy appeared around the $240–$246 region, before the major earnings gap. At $284, price is already approximately 15%–18% above the main moving-average cluster.
The signal was excellent near the Master Buy origin. The current location offers a less attractive risk-to-reward ratio for a fresh entry.
2. Bull Case
Amazon’s breakout is supported by exceptionally strong operating results.
Second-quarter revenue rose 20% to $200.6 billion, while operating income increased 43% to $27.5 billion. AWS revenue grew 37% to $42.2 billion, its fastest expansion in 18 quarters, while AWS operating income reached $16.6 billion. Advertising revenue also grew 26%.
The most important bullish development is the acceleration in AWS. Amazon said both its AI business and its chip business exceeded annual revenue run rates of $25 billion, with each growing at triple-digit rates. Amazon also highlighted multi-year AI infrastructure commitments involving Anthropic and OpenAI, alongside expanding adoption of Trainium and Bedrock.
Management expects third-quarter sales of $197–$202 billion and operating income of $22.5–$26.5 billion, compared with $17.4 billion in the prior-year period. This suggests that profit expansion is expected to continue despite elevated infrastructure spending.
The broader bull case is:
- AWS growth has reaccelerated substantially.
- AI spending is already producing measurable revenue.
- AWS margins remain strong.
- Advertising is becoming a larger profit contributor.
- Retail margins and delivery efficiency continue improving.
- Major cloud customers have reportedly reserved much of Amazon’s available 2027 capacity and some 2028 capacity.
- AMZN is demonstrating relative strength against other large technology companies.
3. Bear Case and Warning Signs
Price is extended
AMZN has advanced more than 20% from its pre-earnings closing level in only two sessions. The stock rose over 15% on the first trading day after earnings and another 4.6% in the following session.
Large earnings gaps can continue trending, but they also create substantial air pockets below price. A loss of $279–$280 could begin a retracement toward the initial post-earnings gap area.
AKM and ribbon are not fully confirmed
Despite the Master Buy, the dashboard still shows:
- Yellow ribbon
- Weak AKM
- No green setup
- Neutral Daily and 4H trends
This creates a potential short-term conflict: price momentum is extremely bullish, but the slower Delphi components have not completely caught up.
The best confirmation would be the ribbon turning green, AKM strengthening and the Daily trend changing from Neutral to Bull while price holds above the breakout.
Free cash flow deterioration
Amazon’s trailing 12-month free cash flow fell from a positive $18.2 billion to a $7.6 billion outflow, primarily because property and equipment spending increased by $66.1 billion to support AI infrastructure. Amazon has raised expected 2026 capital spending to approximately $220 billion.
The investment may generate significant future returns, but it creates several risks:
- Lower near-term free cash flow
- Higher depreciation
- Greater execution risk
- Exposure to semiconductor and energy costs
- Pressure if AI demand slows
Headline earnings require adjustment
Reported net income reached $62.6 billion, or $5.75 per share, but the figure included approximately $53.4 billion of non-operating pre-tax income, primarily related to Amazon’s Anthropic investment. Investors should not treat all of the reported EPS as recurring operating earnings.
Valuation warning
The Delphi dashboard classifies AMZN as:
- Value Premium
- Overvalued
- High Valuation Risk
- Price/Fair Value: 2.36
The current market P/E is approximately 22.8, but Amazon’s valuation depends heavily on continued AWS growth and future returns from its record AI investment cycle.
4. Notable Investors and Analysts
Recent institutional-filings coverage identified Bill Ackman’s Pershing Square, David Tepper’s Appaloosa and Seth Klarman’s Baupost among prominent managers holding or increasing significant Amazon positions. These filings are delayed portfolio snapshots rather than real-time trading disclosures.
Wall Street sentiment strengthened sharply after earnings. Reuters reported that at least 15 brokerages raised their AMZN price targets following the results. JPMorgan increased its target from $330 to $365, citing the acceleration in AWS growth.
A more cautious pre-earnings view came from UBS, which lowered its target from $333 to $305 while maintaining a Buy rating, mainly because of higher expected capital expenditure and component costs. The subsequent earnings beat strengthened the growth case, but UBS’s concerns remain relevant to the free-cash-flow risk.
5. Breaking News and Catalysts
The main current catalysts are:
- Q2 earnings beat and AWS acceleration
- 37% AWS revenue growth
- AI and chip businesses exceeding $25 billion annual run rates
- Improved operating income and segment profitability
- Major cloud and AI customer commitments
- Amazon exceeding $3 trillion in market value
- Multiple analyst target increases
- Potential continuation toward the Delphi $303.92 target
Amazon’s $3 trillion milestone confirms that market sentiment has shifted from questioning its AI spending to rewarding the company for demonstrating near-term cloud revenue and margin growth.
6. Sentiment Shift Compared with Last Week
Sentiment has changed from cautious and mixed to strongly bullish.
Before earnings, investors were concerned about:
- High AI capital expenditure
- Weak free cash flow
- Whether AWS could accelerate sufficiently
- Competition from Microsoft and Google
- The stock’s recent decline toward the $230–$240 area
After earnings, AMZN recorded its largest one-day advance since 2012, followed by another strong session that pushed the stock to a record high. The move also helped improve sentiment toward AI infrastructure spending across the broader market.
The Delphi dashboard confirms this change through the transition to:
- Master Buy
- Heavy accumulation
- High participation
- Strong momentum
- Sector leader
- Bullish moving-average alignment
The only limitation is that AKM, the ribbon and the medium-term timeframe readings have not yet reached full bullish confirmation.
Key Trading Levels
Resistance and targets
$286.90–$287.00
Current record-high resistance. A daily close above this level would confirm another breakout.
$300.00–$303.92
Psychological resistance and Delphi Buy TP. This is the primary technical objective.
$310–$315
Potential secondary target if price holds above $304 and analyst revisions continue.
$330–$335
Higher medium-term Wall Street target region, requiring continued AWS execution.
Support
$279–$280
Most important immediate breakout support.
$270–$273
Post-earnings continuation support and possible deeper pullback-entry zone.
$258.66
First major moving-average and trend support shown on the chart.
$252.31
Secondary moving-average support.
$246–$247
Major breakout base and approximate Master Buy origin.
$240–$241
Critical structural support. A return below this region would invalidate most of the earnings breakout.
Trade Plan
New position
Chasing AMZN around $284–$287 carries elevated gap and volatility risk.
Preferred pullback entry
Look for a controlled retracement into:
- $278–$281 for an aggressive entry
- $270–$273 for a more favourable risk-to-reward setup
Entry confirmation should include a bullish daily or 4-hour rejection candle, continued price support above the ribbon and no deterioration in accumulation.
Breakout entry
Wait for:
- A daily close above $287
- Price to hold or retest $287
- AKM to begin strengthening
- The yellow ribbon to remain stable or turn green
Stop-loss and invalidation
- Aggressive momentum stop: below $277–$278
- Swing-trade stop: below $269–$270
- Major breakout invalidation: daily close below $258.66
- Structural invalidation: below $246
Existing position
Existing holders from the Master Buy area have a significant profit cushion.
A reasonable management approach is:
- Partial profit near $300–$304
- Trail the remaining position below $279
- Use $270 for a wider swing-trade trailing level
- Continue holding a core position while the Daily structure forms higher highs and higher lows
Final Analyst Summary
| Category | Assessment |
|---|---|
| Overall Rating | Bullish |
| Delphi Signal Confidence | Moderate to High |
| Current Entry Quality | Low to Moderate — extended |
| Setup Stage | Master Buy breakout transition |
| Bull Case | Accelerating AWS, strong AI demand, operating-income growth and heavy accumulation |
| Bear Case | Negative free cash flow, extreme capex, incomplete AKM confirmation and gap-retracement risk |
| Key Catalyst | 37% AWS growth and visible AI monetization |
| Main Risk | Failure to hold $279–$280 after an extended earnings gap |
| Sentiment vs Last Week | Sharply more bullish |
| Preferred Entry Zone | $278–$281, or deeper at $270–$273 |
| Breakout Entry | Daily close and successful retest above $287 |
| Primary Target | $300–$303.92 |
| Secondary Target | $310–$315 |
| Technical Invalidation | Below $258.66 |
| Structural Invalidation | Below $246 |
Disclaimer: This information is provided for educational and informational purposes only and does not constitute financial or investment advice. Always conduct your own research and consult a qualified financial adviser before making investment decisions.


Recent Comments