

An institutional flow indicator can give traders another way to study market participation, but it should not be treated as a standalone answer to every trading question. The most useful tools place institutional-activity analysis within a broader review of trend, momentum, market structure, timeframes, and potential setups. This guide explains what to examine before choosing an indicator and how the Delphi Intelligence Smart Money Indicator from VP ALGO TRADING fits into that type of workflow.
What an institutional flow indicator is designed to show
Institutional flow analysis is generally used to study whether market activity appears to support or challenge the current price direction. Traders may use this perspective when they want to look beyond individual candlesticks and consider how broader participation could be affecting market conditions.
However, the phrase “institutional flow” should not be interpreted as direct access to every decision made by banks, funds, or other large participants. An indicator presents an analytical framework based on the information and calculations built into the tool. Its readings still require interpretation, context, and confirmation from other parts of a trading process.
This is why choosing an institutional flow indicator involves more than checking whether it displays attractive buy or sell markings. A trader should ask what the tool is intended to analyze, how its readings relate to price structure, whether it can be used across relevant timeframes, and whether its presentation supports a disciplined review process.
Why institutional activity should be reviewed with other signals
Market conditions rarely depend on one factor. A flow-based reading may appear constructive while the broader trend is weak, or it may suggest increased activity while momentum is losing strength. Market structure can also provide a different perspective by showing whether price is continuing to form a particular sequence or beginning to behave differently.
For this reason, an institutional flow indicator is usually more useful as one part of a market-review process. Instead of asking whether the indicator can predict the next move, traders can ask whether its information agrees with the broader picture and whether it helps them identify areas that deserve further examination.
A broader review may include
- Trend: Is the market generally moving upward, downward, or without a clear direction?
- Momentum: Is price movement showing strength, weakness, or a possible loss of follow-through?
- Market structure: How is price behaving around important highs, lows, and structural changes?
- Institutional activity: Does the flow analysis add context to the current market behavior?
- Timeframe alignment: Do observations from higher and lower timeframes support the same market view?
- Risk and execution: Does the analysis fit the trader’s own plan, rules, and tolerance for uncertainty?
This approach helps prevent one reading from becoming a substitute for judgment. An indicator can organize information and make a chart easier to review, but it does not remove the need to define invalidation, manage exposure, or accept that a market view can be wrong.
What to look for before choosing an institutional flow indicator
1. A clear analytical purpose
Start by identifying the specific problem the tool is meant to help with. Some traders want to understand whether activity supports a developing trend. Others want to study potential shifts in market structure or compare flow observations with momentum. If the purpose is unclear, the indicator may add visual complexity without improving the decision process.
A useful tool should make it easier to answer practical questions. For example, can you explain what a displayed flow condition means in relation to the current trend? Can you identify when the reading is less relevant because the market is moving sideways? Can you describe how the information will affect your own review rather than simply reacting to a colored marker?
2. Integration with trend analysis
Institutional activity is easier to interpret when it is viewed alongside trend analysis. A flow reading that appears during a well-defined directional move may be understood differently from the same reading during a range or a period of conflicting price action.
When evaluating a tool, look for a workflow that allows trend context to remain visible. A separate institutional flow view may be useful, but a combined approach can reduce the need to switch between unrelated tools. The aim is not to collect as many signals as possible. It is to build a coherent process in which each element answers a different question.
3. Momentum analysis rather than flow alone
Momentum provides another important layer. It helps traders consider whether price movement has energy behind it or whether a move may be losing strength. Flow and momentum do not always point in the same direction, and that disagreement can be informative. It may encourage a trader to wait for more clarity instead of treating one positive reading as sufficient.
If you are comparing a momentum indicator for TradingView with an institutional flow tool, consider whether they serve distinct roles. A good market-review process should not simply display several versions of the same information. It should help separate participation, direction, momentum, and structure so that the trader can assess how those factors interact.
4. Market structure context
Market structure analysis focuses on how price develops through highs, lows, continuation, and possible changes in direction. It can provide a framework for assessing whether an institutional flow reading is occurring within a stable structure or near a point where the market’s behavior is changing.
A market structure indicator should be understandable enough for the trader to connect its output with the chart. If labels or visual elements are difficult to interpret, they may lead to decisions based on appearance rather than analysis. Before choosing a tool, ask whether the structure information is presented in a way that supports your existing method and whether you can explain its relevance without relying on a simple signal-following approach.
5. Multi-timeframe assessment
Markets can look different depending on the timeframe being reviewed. A shorter chart may show a temporary move while a higher timeframe presents a broader trend or a conflicting structure. A useful institutional flow indicator should therefore be considered in the context of how you review multiple timeframes.
Multi-timeframe analysis does not mean that every chart must agree before any decision is possible. It means that the trader can distinguish between broader context and shorter-term movement. When assessing a tool, ask whether its features support a practical multi-timeframe review and whether the information remains readable as you move between charts.
6. Readable visual design
Visual clarity matters because a crowded chart can make a careful process harder to follow. An indicator may include valuable categories, but the information needs to be presented in a way that traders can interpret without constantly guessing what each element represents.
Look for clear labels, understandable visual distinctions, and a layout that does not hide price action. The best design is not necessarily the one with the greatest number of markings. It is the one that helps you review relevant conditions while leaving enough space to assess the chart itself.
7. A realistic role in decision-making
Be cautious of any tool that is presented as a replacement for analysis or risk management. No institutional flow indicator can remove market uncertainty, guarantee a favorable outcome, or eliminate losses. Its proper role is to support a trader’s process by organizing observations and highlighting conditions that may deserve closer attention.
Before committing to a tool, write down how you expect to use it. You might use flow information to filter potential setups, compare a market view across timeframes, or add context before reviewing an entry idea. Defining that role in advance can reduce impulsive reactions to isolated readings.
Questions to ask when comparing TradingView indicators
Many traders search for the best trading indicators on TradingView, but “best” depends on the trader’s method, experience, and review needs. A tool that suits one charting process may be distracting in another. The following questions can help turn a general search into a more useful evaluation.
| Evaluation question | Why it matters |
|---|---|
| What market condition is the indicator designed to help analyze? | It clarifies whether the tool is relevant to trend, momentum, structure, flow, or another specific part of your process. |
| Can the readings be understood without relying on a single buy or sell prompt? | Interpretability encourages analysis instead of automatic reactions. |
| Does the tool fit a multi-timeframe review? | Different timeframes can provide different context, so the indicator should fit the way you study charts. |
| Is the chart presentation clear? | Readable information is easier to apply consistently and compare with price action. |
| How does it complement existing analysis? | A new tool should add useful perspective rather than duplicate or obscure what you already use. |
| What support or access process is available? | Installation, activation, and usage questions can affect how easily a trader begins evaluating the product. |
These questions are also useful when comparing a general TradingView trading indicator with a more specialized smart money tool. Technical features matter, but usability and fit with your process matter just as much.
How the Delphi Intelligence Smart Money Indicator fits this framework
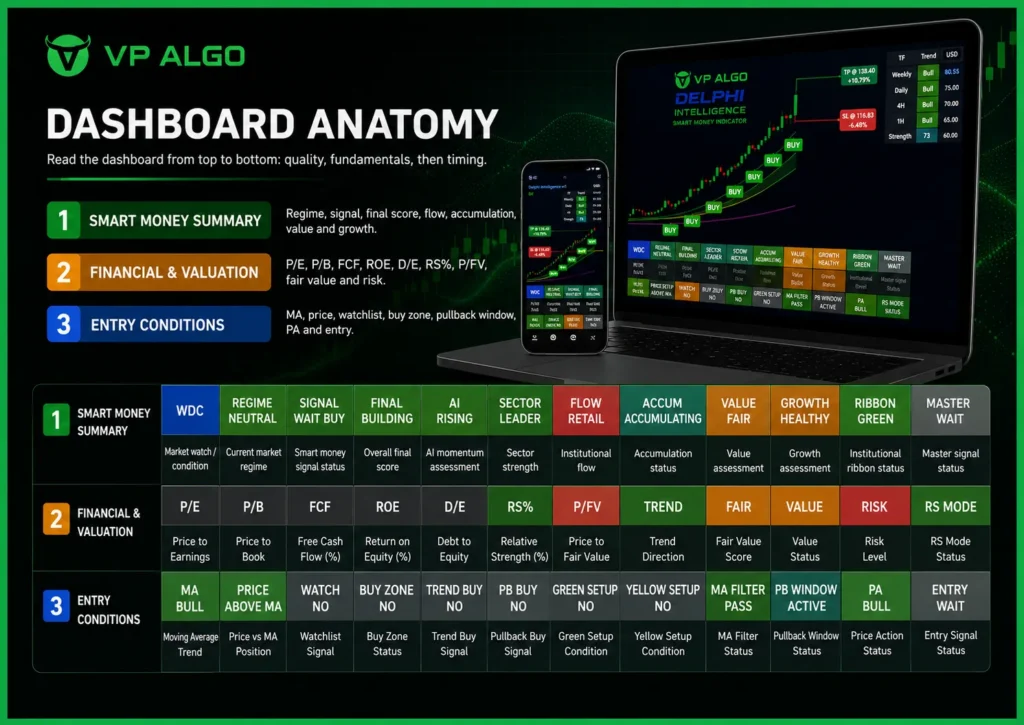
The Delphi Intelligence Smart Money Indicator is a TradingView market intelligence indicator offered by VP ALGO TRADING. According to the company’s product information, it combines trend analysis, momentum evaluation, market structure, institutional activity, and smart money concepts.
That combination is relevant for traders who want to review institutional activity without separating every part of their analysis into unrelated tools. It is designed to help users evaluate market conditions and potential trading setups, rather than present itself as a substitute for independent decision-making.
Using the indicator as a review framework
A trader might begin with the broader trend, then consider momentum and market structure before reviewing the institutional-activity component. The purpose is to ask whether the different observations support a consistent market view, conflict with one another, or suggest that the situation needs more patience.
This type of process can be useful for both newer and more experienced TradingView users. Beginners may benefit from having several relevant categories in one analytical framework, while experienced traders may use the indicator to add another perspective to an established method. In either case, the readings should be interpreted within a personal plan rather than followed automatically.
Access, trial, and support considerations
VP ALGO TRADING offers a request-based 7-day free trial for its indicator and Telegram channel. Traders considering the product can use the available process to assess whether the tool’s presentation and analytical categories fit their chart-review habits. Trial availability and conditions should be confirmed directly with the company.
After purchase, customers are instructed to provide their TradingView ID by email for product access. The company also states that customers can contact support for installation, activation, or usage assistance. These practical details are worth considering because a technically suitable indicator still needs to be accessible and understandable in day-to-day chart work.
How to use institutional flow information responsibly
Responsible use begins with separating observation from conclusion. An indicator may show conditions that appear to support a market direction, but that does not establish that price must continue in that direction. Treat the reading as part of an evidence-gathering process and look for agreement with structure, momentum, and the wider timeframe.
It is also useful to record why a setup was considered and what would invalidate the original view. A simple review journal can include the timeframe, trend assessment, structure observations, flow context, and the reason for waiting or acting. Over time, this can reveal whether the tool is genuinely improving the quality of analysis or merely adding more signals to the screen.
- Define the market condition you are reviewing before interpreting the indicator.
- Check whether trend, momentum, structure, and flow readings agree or conflict.
- Avoid treating one marker as proof of institutional buying or selling.
- Use a timeframe that matches your own trading plan and review additional context where appropriate.
- Set your own risk rules and decision criteria independently of the indicator.
- Review outcomes and decisions without assuming that past results predict future performance.
These principles apply whether you are testing a smart money indicator for TradingView, a market structure indicator, or a broader collection of technical tools. The goal is a repeatable review process, not certainty.
Who may benefit from this type of indicator?
An institutional flow indicator may be relevant to traders who already use TradingView and want a structured way to consider institutional activity alongside trend, momentum, market structure, and smart money concepts. It may also appeal to users who prefer to review several dimensions of market behavior within one indicator framework.
It may be less suitable for someone looking for a guaranteed buy-and-sell system or a tool that removes the need to understand the chart. Traders should also consider whether the indicator’s visual language fits their preferred markets, timeframes, and workflow. The supplied product information does not establish specific supported markets or recommended trading styles, so those details should be confirmed before use.
Final checklist before choosing a tool
Before selecting an institutional flow indicator, confirm that you understand what it measures and how you plan to use it. Review the relationship between flow, trend, momentum, and structure rather than evaluating one feature in isolation. Check whether the chart design is clear, whether multi-timeframe analysis fits your process, and whether access and support arrangements are practical for you.
The Delphi Intelligence Smart Money Indicator is intended to bring trend analysis, momentum evaluation, market structure, institutional activity, and smart money analysis into a TradingView-based market review. For traders considering it, the most useful test is whether those features help create a clearer and more disciplined process. As with any trading indicator, it should support—not replace—independent analysis, risk controls, and realistic expectations.
Frequently asked questions
What does an institutional flow indicator do?
It provides a way to study institutional-activity conditions as part of broader market analysis. The information should be interpreted alongside trend, momentum, market structure, and timeframe context.
Is an institutional flow indicator a guaranteed trading signal?
No. It cannot guarantee profits, eliminate losses, or predict every future market move. It is an analytical aid that should be used within a personal trading and risk-management process.
What should I compare with institutional flow readings?
Compare them with the current trend, momentum, market structure, and observations from relevant timeframes. Agreement can add context, while conflicting readings may suggest caution or further review.
Is the Delphi Intelligence Smart Money Indicator available for TradingView?
Yes. VP ALGO TRADING offers the Delphi Intelligence Smart Money Indicator for TradingView. The company describes it as combining trend, momentum, market structure, institutional activity, and smart money analysis.
Does the Delphi indicator replace financial advice?
No. VP ALGO TRADING positions its indicators for educational and trading-decision assistance purposes rather than as financial advice. Users remain responsible for their own analysis and decisions.
How can customers obtain access after purchasing?
After purchase, customers are instructed to provide their TradingView ID by email for product access. Support is available for installation, activation, or usage assistance.
Can I try the indicator before deciding?
VP ALGO TRADING offers a request-based 7-day free trial for its indicator and Telegram channel. Trial availability and conditions should be confirmed directly with the company.


Recent Comments