
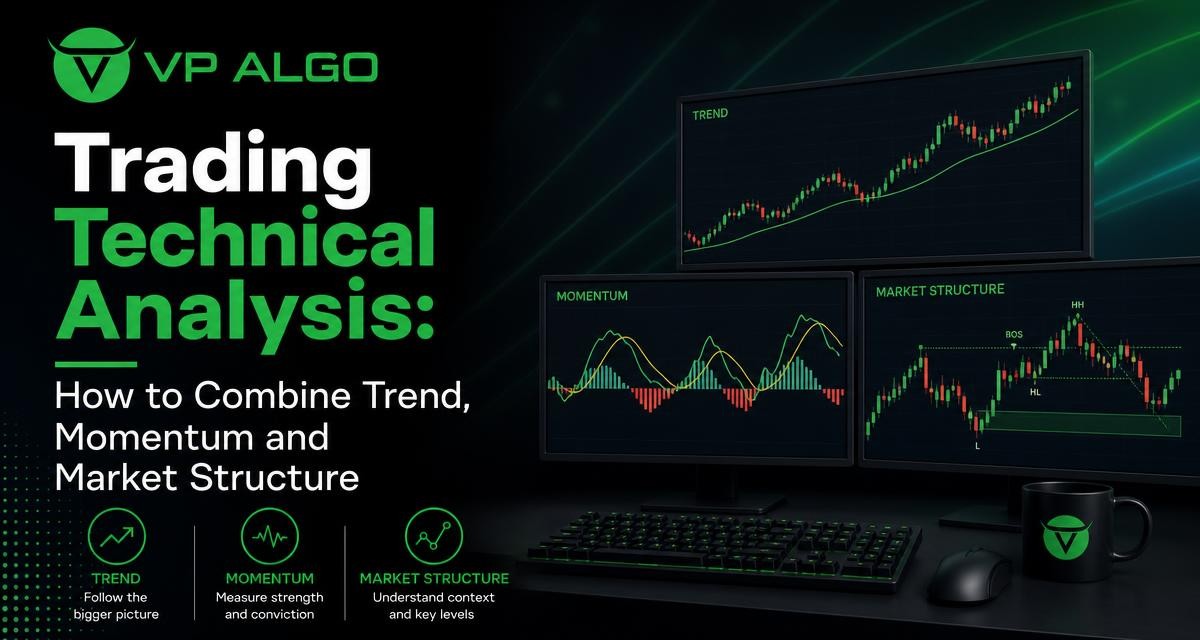
Trading technical analysis is more useful when trend, momentum and market structure are reviewed together rather than treated as separate sources of buy or sell signals. Each perspective answers a different question: where price is moving, how strongly it is moving, and how its swings are developing. Combining them can create a more disciplined chart-review process while still leaving room for uncertainty and risk management.
Why one technical signal is rarely enough
A single indicator can describe one part of market behaviour, but it cannot explain every condition on a chart. A moving-average-based trend tool may show that price is rising while momentum is already weakening. A momentum reading may show strength, yet price could be approaching an important structural area. A support or resistance level may appear significant, but the broader market may still be moving in the opposite direction.
This is why traders can receive apparently conflicting information. The conflict does not necessarily mean that an indicator is broken. It may simply mean that different tools are measuring different features of price. The goal of a multi-perspective approach is not to force every signal to agree. It is to understand what each signal is saying, identify where the evidence is aligned, and recognise when the chart is unclear.
The three perspectives in trading technical analysis
Trend: the market’s broader direction
Trend analysis examines whether price is generally advancing, declining or moving sideways. Traders may study swing highs and swing lows, moving averages, channel behaviour or a trend indicator for TradingView. The method can vary, but the central question remains the same: is the market demonstrating a directional bias, or is it moving within a range?
An upward trend often contains a sequence of higher highs and higher lows. A downward trend may contain lower highs and lower lows. A sideways market tends to alternate between areas of support and resistance without establishing a clear directional sequence. These descriptions are not predictions. They are ways to organise what price has already done and to frame possible scenarios.
Momentum: the strength behind a move
Momentum analysis considers the pace and persistence of price movement. It can help traders assess whether a current move is gaining strength, losing energy or moving at a relatively stable rate. A momentum indicator for TradingView may provide one way to study this behaviour, while price expansion, consecutive candles and the distance between swings can offer additional context.
Strong momentum does not automatically mean that price must continue higher or lower. A market can remain overextended for longer than expected, and momentum can change quickly after a news event or a failed breakout. Momentum is therefore best treated as context. It can support a trend assessment, warn of a possible loss of strength or help distinguish a decisive move from a weak test of a level.
Market structure: how price is organising itself
Market structure focuses on the relationship between important highs, lows, breaks and reactions. It asks where price has changed character, which swing points remain relevant and whether a breakout has been accepted or rejected. This perspective can make a chart easier to interpret because it provides a sequence rather than a collection of isolated candles.
Structure analysis may include concepts such as higher highs, lower lows, break of structure, changes in market character, support and resistance, and areas where price previously reacted. The terminology varies between trading methods, so the practical task is to define each concept clearly before using it. A market structure indicator can help display these features, but the trader still needs to understand what the markings represent and whether they suit the selected timeframe.
How to combine trend, momentum and structure
A useful process moves from broad context to more specific evidence. Rather than opening several indicators and waiting for identical signals, begin with the market’s overall structure. Then assess the directional trend and finally examine momentum. This order reduces the risk of allowing a short-term fluctuation to dominate the interpretation of a broader chart.
| Perspective | Main question | Helpful evidence | Possible limitation |
|---|---|---|---|
| Trend | What is the broader directional bias? | Swing sequence, moving averages, channels, trend indicator | Can react slowly or misread a range as a trend |
| Momentum | How strong or persistent is the current move? | Momentum readings, candle expansion, speed of movement | Strong momentum can persist or reverse abruptly |
| Market structure | How are highs, lows and breaks developing? | Swings, structural breaks, reactions at key areas | Important points can be interpreted differently across timeframes |
| Context | What conditions may affect the setup? | Timeframe, volatility, liquidity and nearby levels | Context can change as new price data appears |
Step 1: Establish the higher-timeframe context
Start by choosing a timeframe that matches the question you are trying to answer. A higher timeframe can provide a broader view of the prevailing structure, while a lower timeframe may show more detail but also more noise. Looking at several timeframes does not mean that every timeframe must produce the same signal. It means that the trader is aware of how short-term movement fits within a wider price sequence.
Mark the most relevant swing highs, swing lows and areas where price reacted clearly. Avoid filling the chart with every minor turning point. The purpose of this stage is to identify the structural context that could influence a later observation, not to predict the next candle.
Step 2: Define the current trend
Once the structure is visible, decide whether the market is trending upward, trending downward or ranging. State the conclusion in plain language. For example, price may be making higher lows but struggling to create a new high, or it may be moving between two established boundaries. A clear description is more useful than a vague impression that the chart looks bullish or bearish.
A trend indicator for TradingView can be used as an additional reference during this step. It should support the chart reading rather than replace it. If the indicator suggests an uptrend while the recent swing structure is flat, record the disagreement. Such a disagreement may indicate a transition, a range or a difference in calculation rather than a signal that must be ignored.
Step 3: Evaluate momentum without chasing it
Next, ask whether momentum confirms the current directional view. In an upward trend, traders might look for sustained buying pressure, expanding movement or momentum that remains supportive after a pullback. In a downward trend, they may look for continued selling pressure or weak rebounds. In a range, momentum may repeatedly change direction as price moves between boundaries.
Be careful with the assumption that a strong momentum reading makes an entry automatically better. A fast move can reduce the distance to a nearby structural level and increase the chance that a late entry is poorly positioned. Momentum is most informative when considered alongside location. A strong move in the middle of an open area may have a different meaning from a strong move directly into an established reaction zone.
Step 4: Check whether market structure supports the idea
Structure provides a test for the broader interpretation. If the trend is described as upward, are higher lows still holding? If the market has broken above a prior high, has price remained above that area or quickly returned below it? If a reversal is being considered, has the market actually changed its sequence of highs and lows, or has it only produced a temporary pullback?
This step helps separate a confirmed structural development from a single dramatic candle. A breakout may be worth studying, but it still needs context. The quality of the move can be considered through follow-through, reaction at the broken area and alignment with the selected timeframe. None of these observations guarantees continuation; they simply make the analysis more explicit.

A practical confluence framework
Confluence does not mean collecting as many indicators as possible. It means bringing together evidence that addresses different questions without duplicating the same calculation. A trend tool and a moving average may both describe direction, but using both does not necessarily provide two independent confirmations. By contrast, trend, momentum and structure may offer more distinct viewpoints.
A simple review can be organised into three categories:
- Directional context: describe the prevailing trend or range and identify the timeframe used.
- Structural location: note whether price is near a prior swing, support, resistance, breakout area or other clearly defined reference point.
- Momentum condition: assess whether movement is strengthening, weakening, persistent or conflicted with the directional view.
The result is not a mechanical score that turns uncertainty into certainty. It is a written explanation of why a chart deserves further attention, why it may need more confirmation or why it should be left alone. A trader can also define invalidation in advance: what price behaviour would show that the original interpretation is no longer valid?
Using TradingView indicators without overcrowding the chart
TradingView makes it easy to add multiple tools, but convenience can encourage excessive layering. Several indicators may produce similar information, while too many labels can make the chart harder to read. A clean layout should help answer a defined set of questions, not display every available measurement.
Before adding a TradingView trading indicator, identify its role. Is it being used to assess direction, momentum, structure, volatility or another specific feature? If two tools perform almost the same role, compare them and decide whether both are necessary. Keep settings consistent with the way the tool is intended to be interpreted, and understand whether its markings are based on confirmed data or can change as new candles form.
Tools that combine several analytical perspectives can be useful for traders who want a more structured review. VP ALGO TRADING develops TradingView indicators, including the Delphi Intelligence Smart Money Indicator, with features related to trend analysis, momentum signals, market structure, institutional flow monitoring, multi-timeframe trend assessment and smart money analysis. Such a tool can help organise observations on a chart, but it should be treated as decision-support and educational software, not as financial advice or a guarantee of a particular result.
Common mistakes when combining indicators
Waiting for perfect agreement
Markets rarely provide complete agreement across every timeframe and analytical method. If a trader waits for all signals to point in exactly the same direction, opportunities may pass or the eventual entry may occur after much of the move has already happened. A better approach is to define which evidence is essential, which is supportive and which would invalidate the idea.
Using more indicators to solve an unclear method
Additional tools cannot compensate for undefined rules. If a trader cannot explain what counts as a trend, a structural break or weakening momentum, adding another indicator usually creates more noise. Write the definitions first, then choose tools that make those definitions easier to review.
Ignoring timeframe conflict
A short-term bullish move can occur inside a larger bearish structure. Neither observation is necessarily wrong. The problem occurs when the trader treats them as though they describe the same horizon. Always record the timeframe behind each conclusion and avoid mixing a short-term signal with a long-term claim without explaining the relationship.
Confusing an indicator label with confirmation
Labels such as buy, sell, bullish or bearish are summaries generated from rules. They are not independent evidence by themselves. Review the underlying price action, the relevant structural area and the conditions that produced the label. This is particularly important when using a smart money indicator or any tool that displays several concepts on one chart.
How to build a repeatable chart-review routine
A repeatable routine makes analysis easier to compare from one chart to the next. It can be short, provided that it covers the information needed for a responsible decision. The following sequence is a useful starting point:
- Choose the market and timeframe being reviewed.
- Describe the higher-timeframe structure as trending or ranging.
- Mark the most relevant highs, lows and reaction areas.
- Use a trend tool to compare its reading with the visible price sequence.
- Assess whether momentum supports, weakens or conflicts with the trend.
- Identify the condition that would confirm the idea and the behaviour that would invalidate it.
- Record the observation in a journal, including uncertainty and what was not known.
A journal should not only record trades or successful outcomes. It can also document skipped setups, conflicting signals and situations where the chart was too unclear to interpret. This helps reveal whether the method is being applied consistently and whether a particular indicator is genuinely useful for the trader’s process.
Institutional activity and smart money concepts
Institutional activity and smart money concepts are often used to add another layer of context to technical analysis. Depending on the method, traders may examine areas associated with significant price reactions, liquidity behaviour or changes in market structure. These concepts can be informative, but their labels and definitions differ across tools and educators.
For that reason, do not treat a displayed institutional-flow or smart-money marking as proof of what a particular market participant has done. Treat it as an analytical interpretation that should be checked against price, timeframe and structure. A smart money indicator can organise these observations, but it does not remove the need for independent review, risk controls or awareness that market conditions can change.
Final checklist for multi-factor technical analysis
Before treating a chart as a potential setup, ask whether the analysis is coherent rather than simply whether several indicators are pointing in the same direction. A concise checklist can include:
- What is the broad trend or range?
- Which swing points define the current structure?
- Where is price relative to those structural areas?
- Is momentum supporting the move, fading or giving mixed information?
- Which timeframe does each observation describe?
- What would show that the interpretation is no longer valid?
- Am I using the tools to clarify a process or to search for certainty?
Trading technical analysis works best as a framework for asking better questions, not as a promise that every market move can be forecast. Combining trend, momentum and market structure can make chart review more organised and expose conflicts that a single signal might hide. The quality of the process depends on clear definitions, consistent observation and appropriate risk awareness.
Frequently asked questions
What is trading technical analysis?
Trading technical analysis is the study of price behaviour, chart structure and related market data to assess possible conditions and scenarios. It does not guarantee a particular market outcome.
Why combine trend, momentum and market structure?
Each perspective addresses a different question. Trend describes direction, momentum examines the strength of movement, and market structure shows how highs, lows and breaks are developing.
What is a trend indicator for TradingView used for?
A trend indicator for TradingView can help display or summarise directional conditions on a chart. It should be compared with visible price structure rather than used as a standalone decision rule.
Can momentum confirm a trend?
Momentum can support a trend assessment when movement remains persistent in the same direction. It can also weaken, diverge or change quickly, so it should be considered with price location and structure.
What does a market structure indicator show?
A market structure indicator may mark swing points, structural breaks or changes in the relationship between highs and lows. The exact features depend on the tool and its settings, so traders should understand how its markings are produced.
How many indicators should be used on a TradingView chart?
There is no universal number. Use enough tools to answer defined questions without duplicating information or making the chart difficult to interpret. A simple, understood process is generally more useful than a crowded layout.
Does combining indicators guarantee better trading results?
No. Combining analytical perspectives can improve organisation and reveal conflicting evidence, but it cannot guarantee profits, eliminate losses or predict future performance. Indicators are decision-support tools, not financial advice.


Recent Comments