
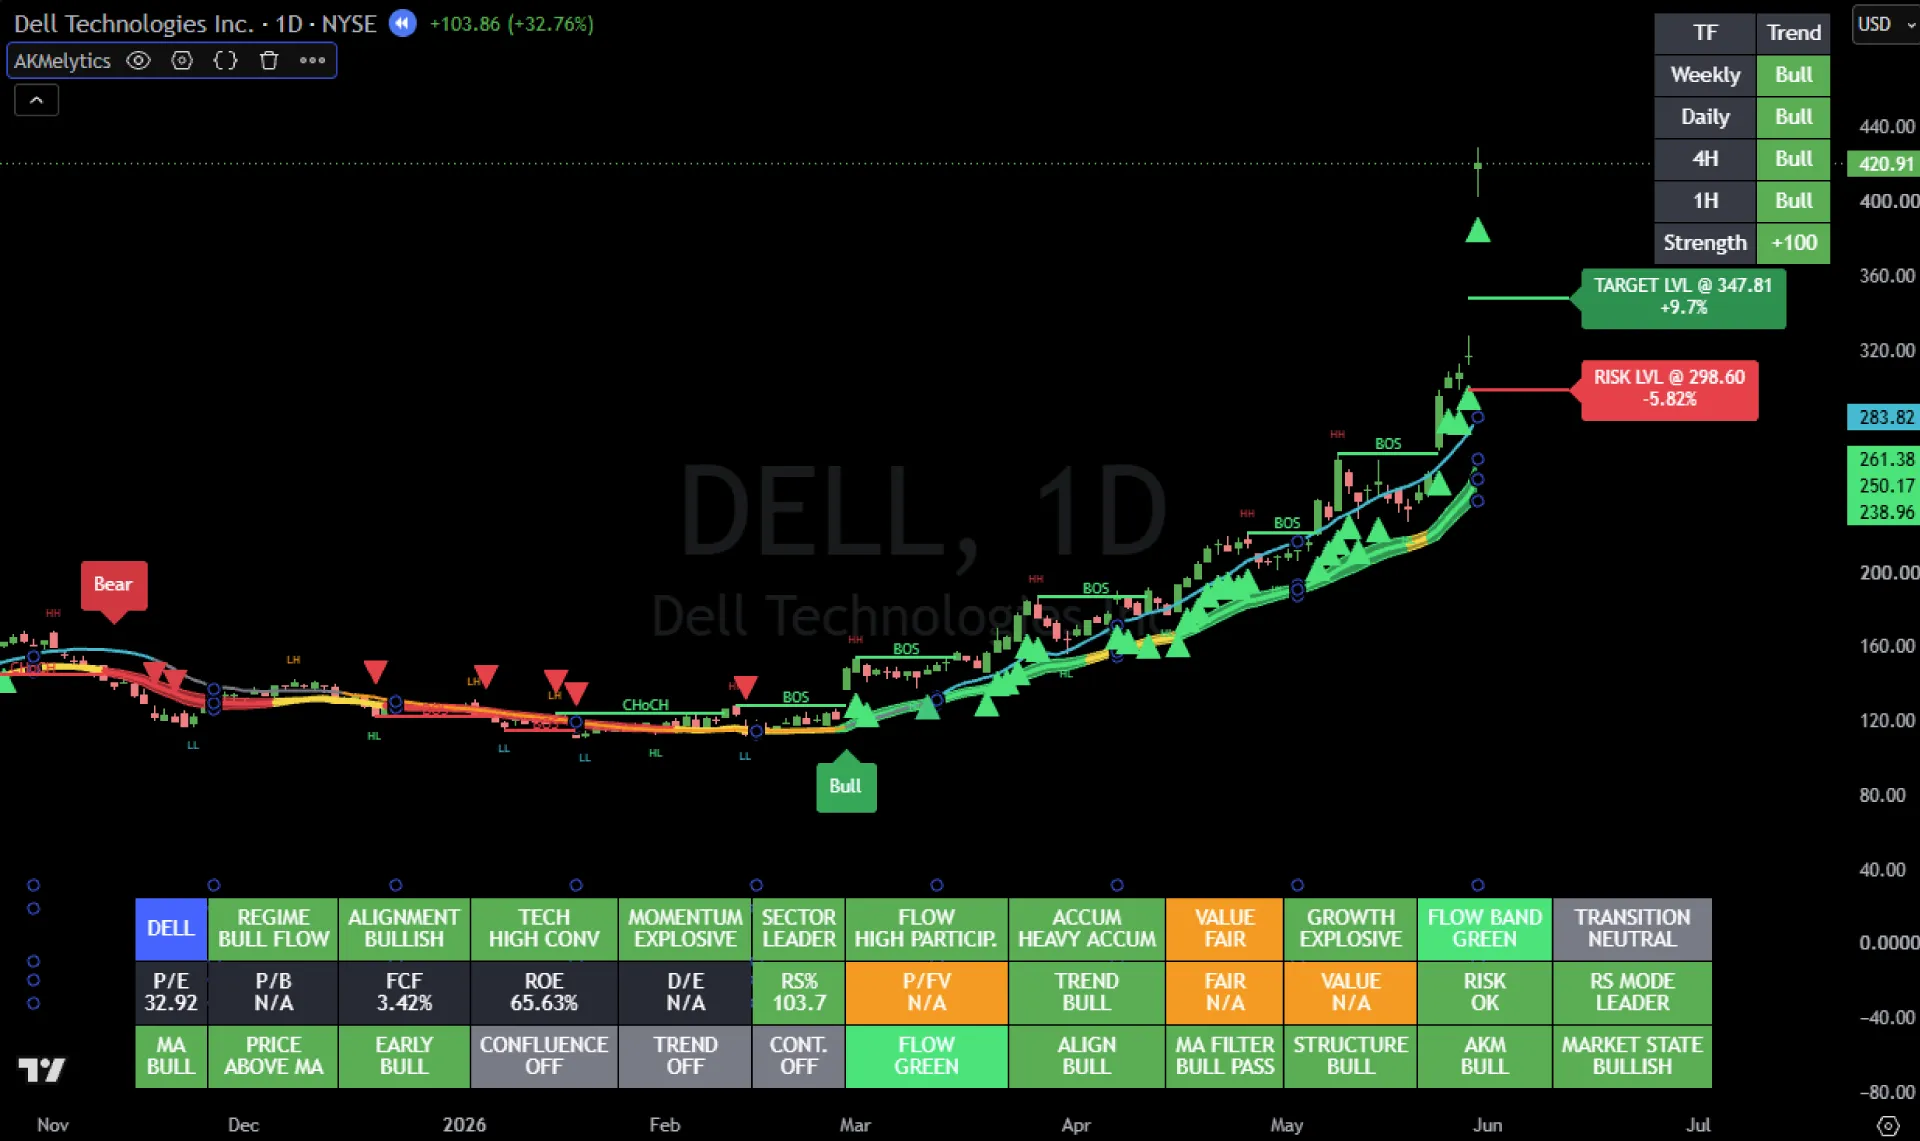
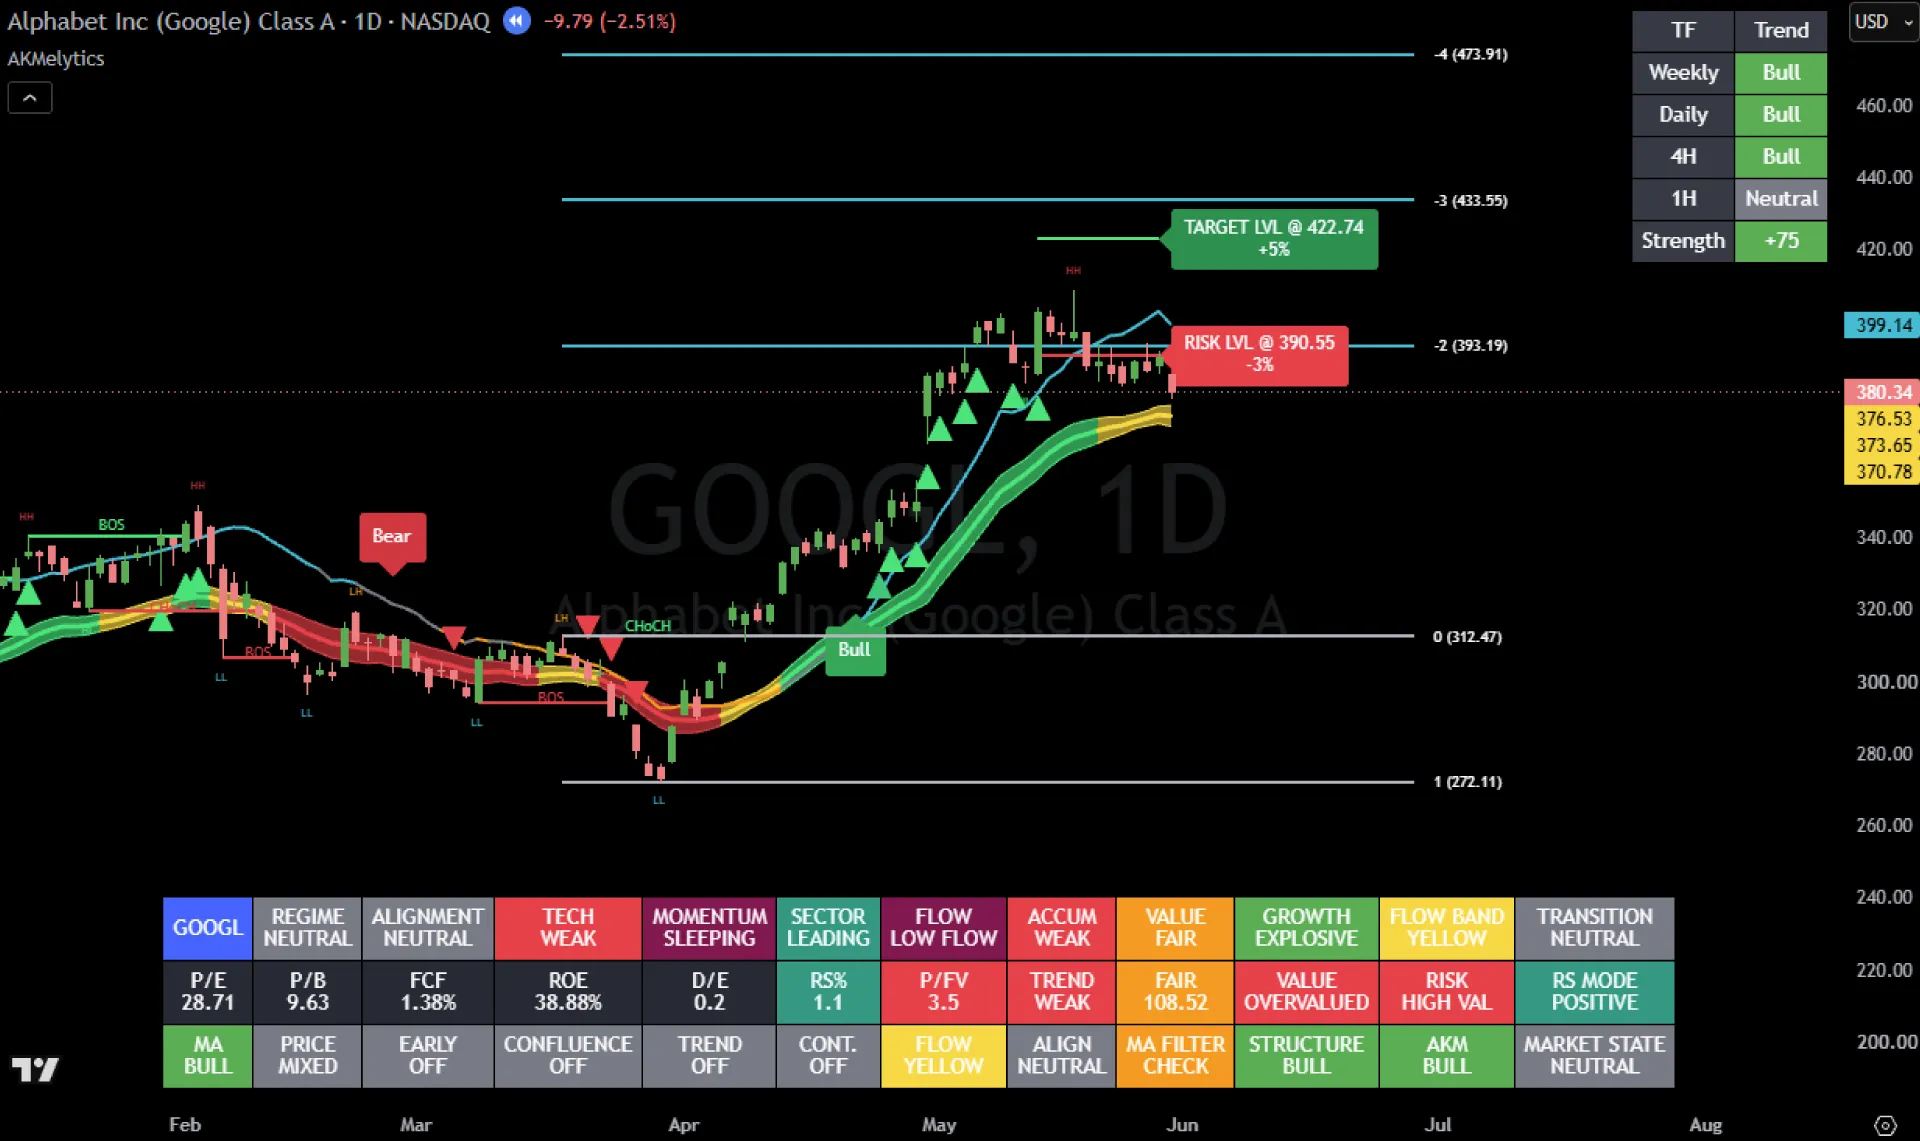
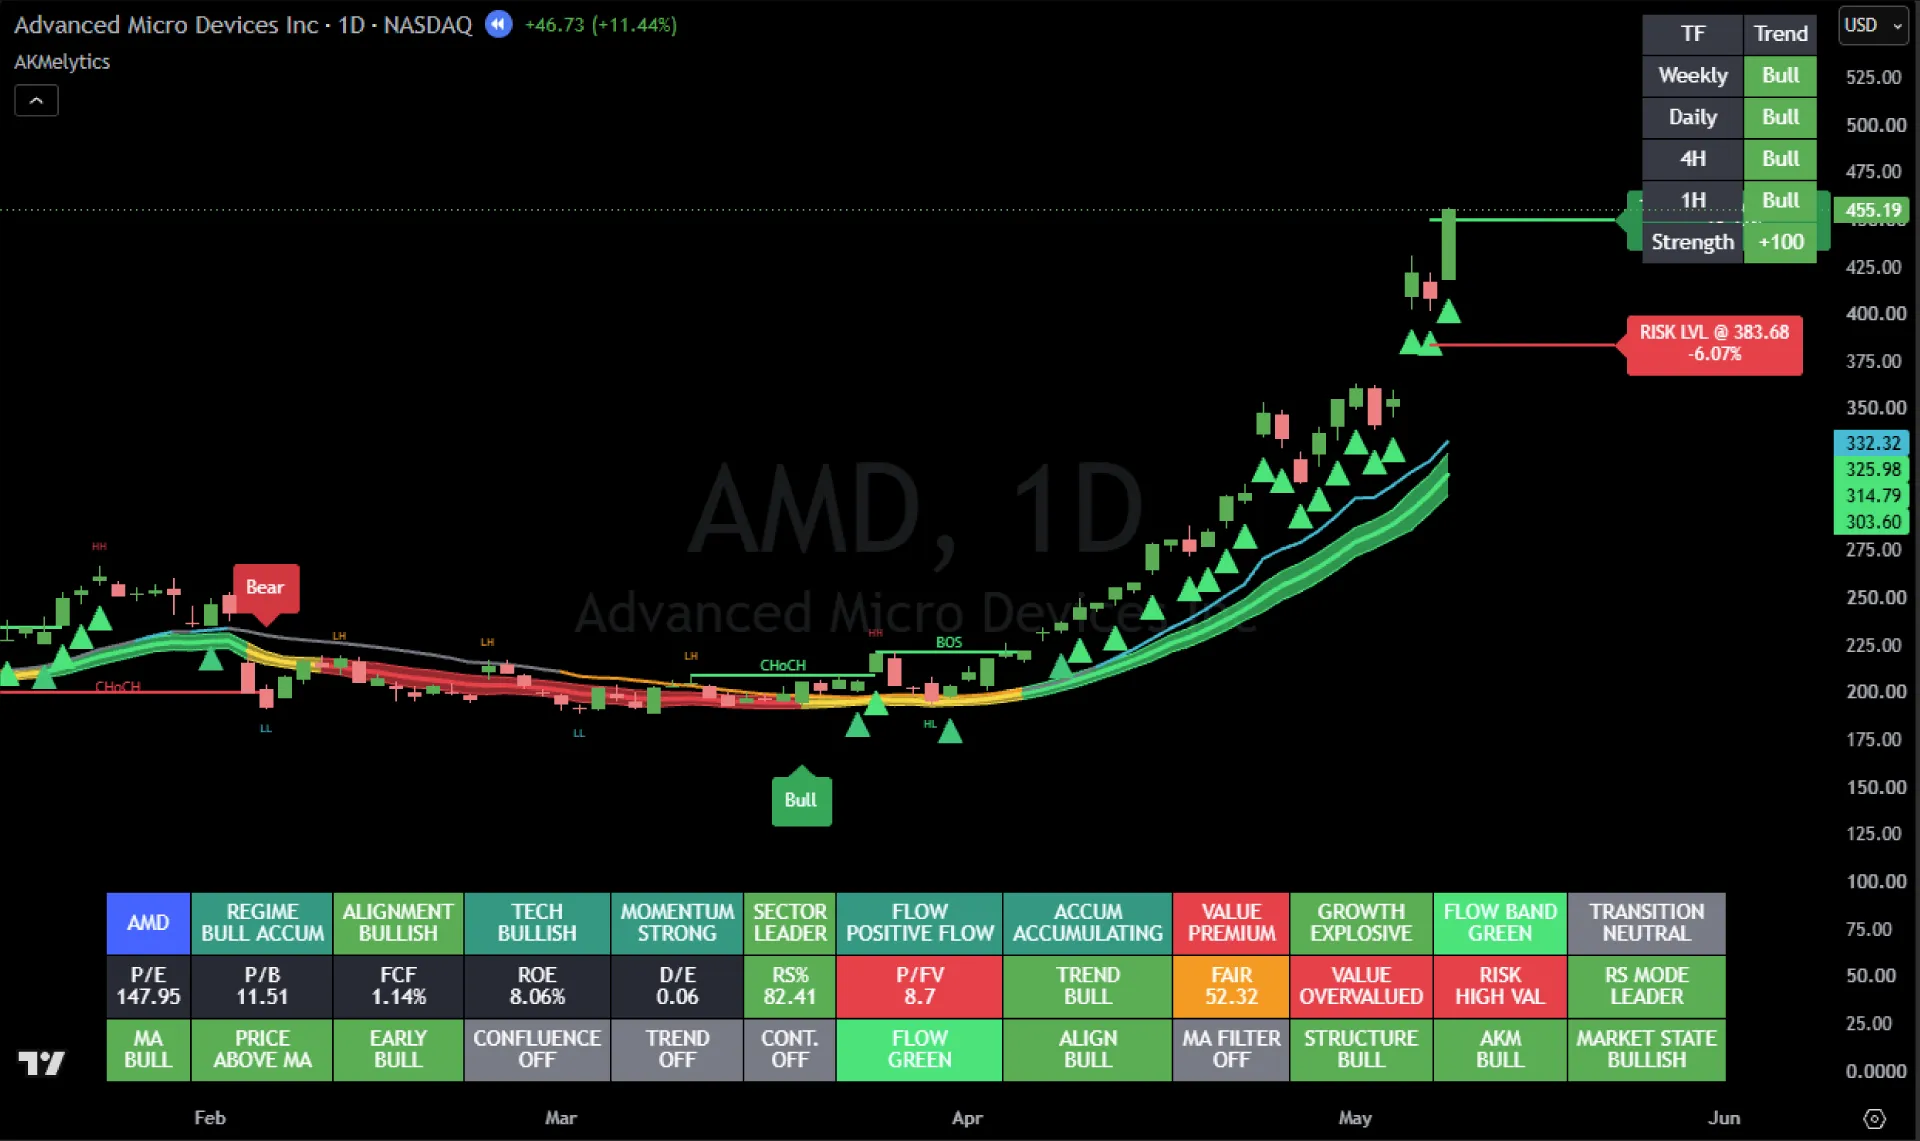
Description
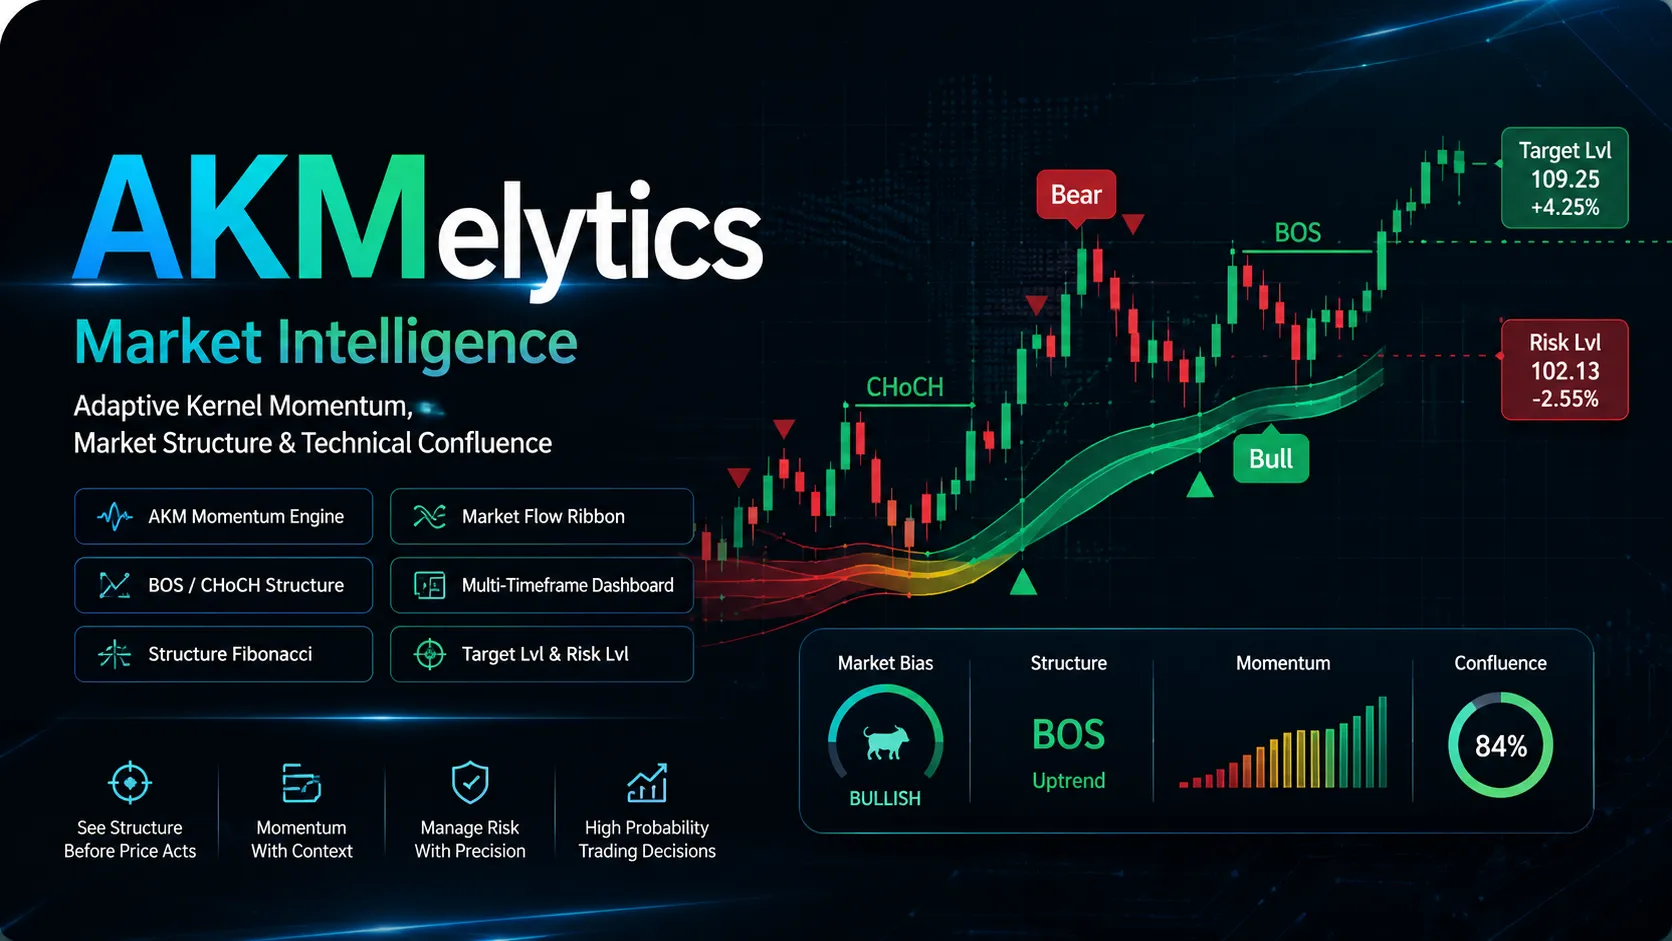
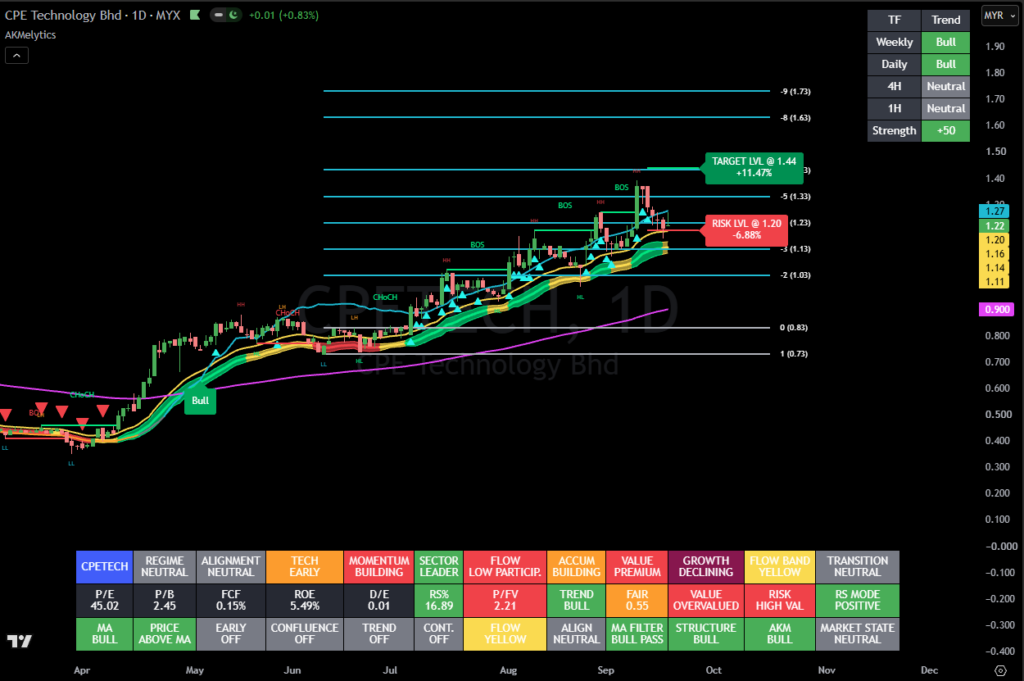
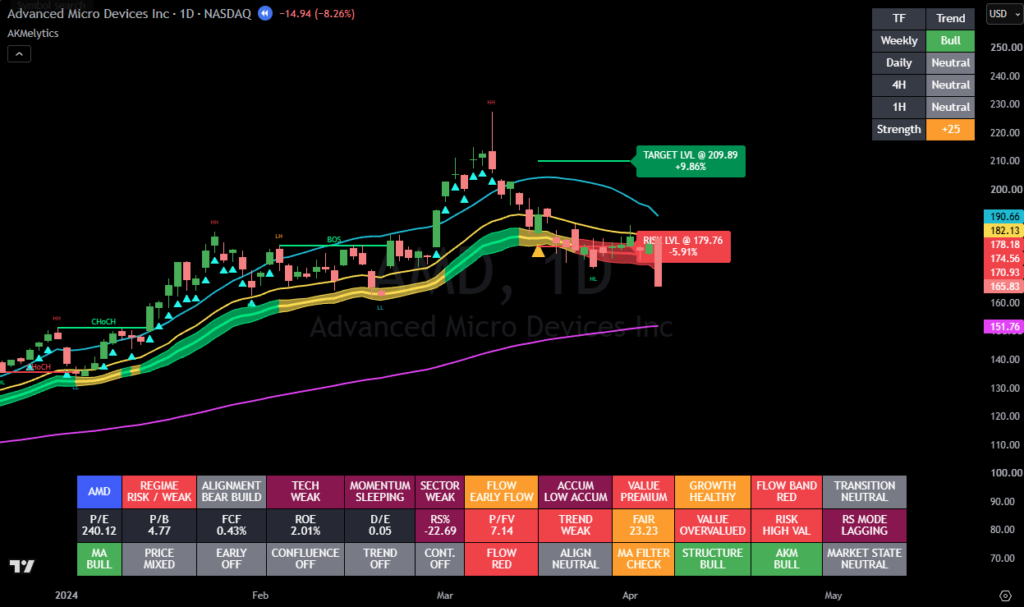
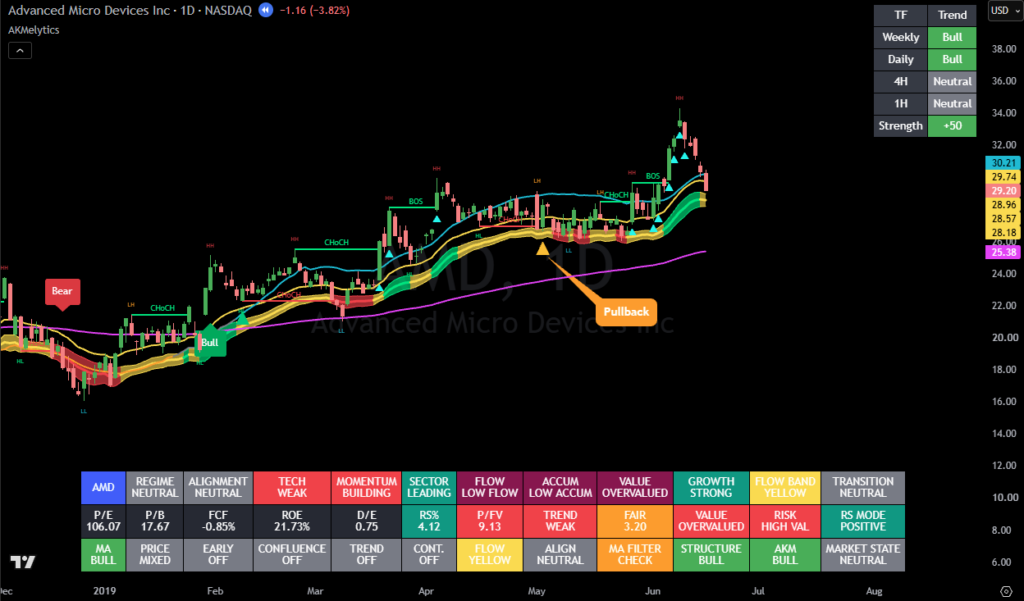
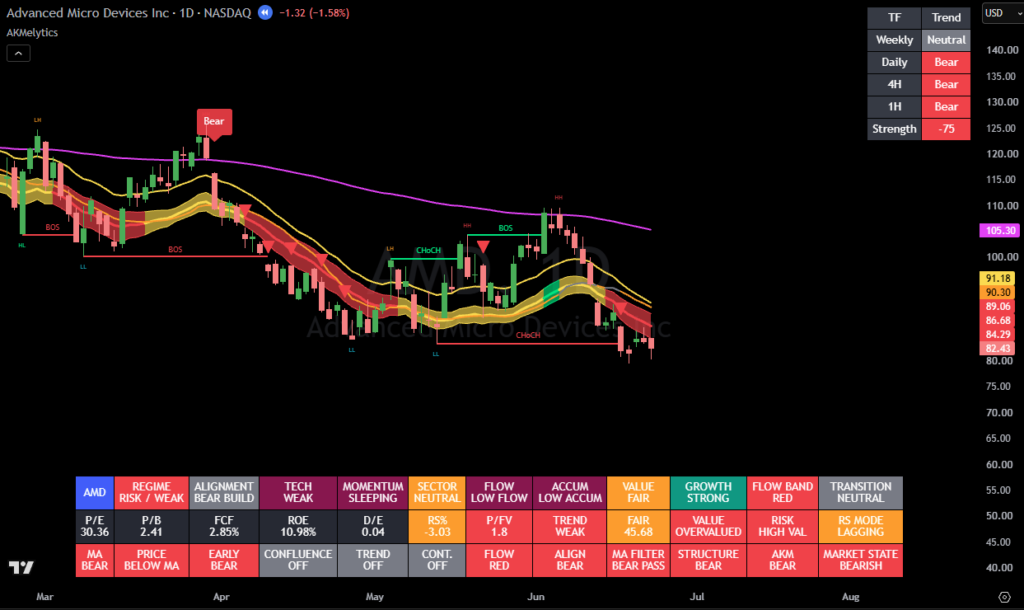
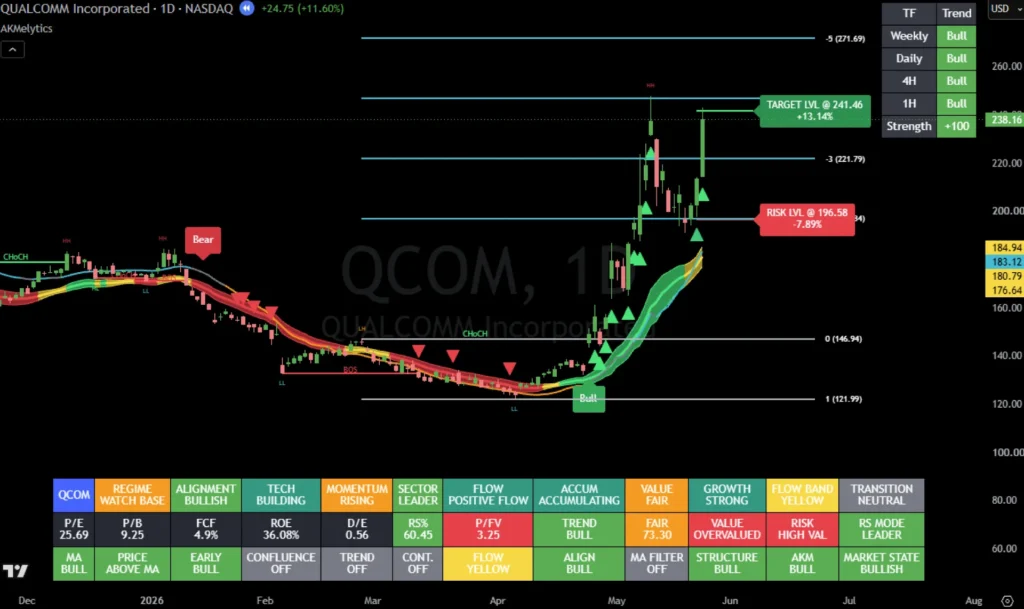
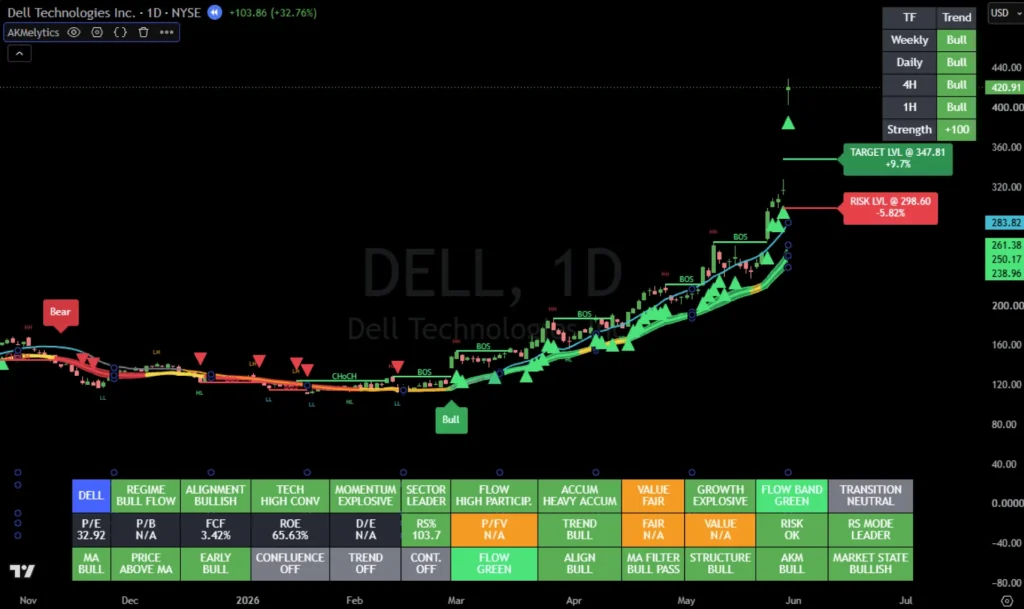
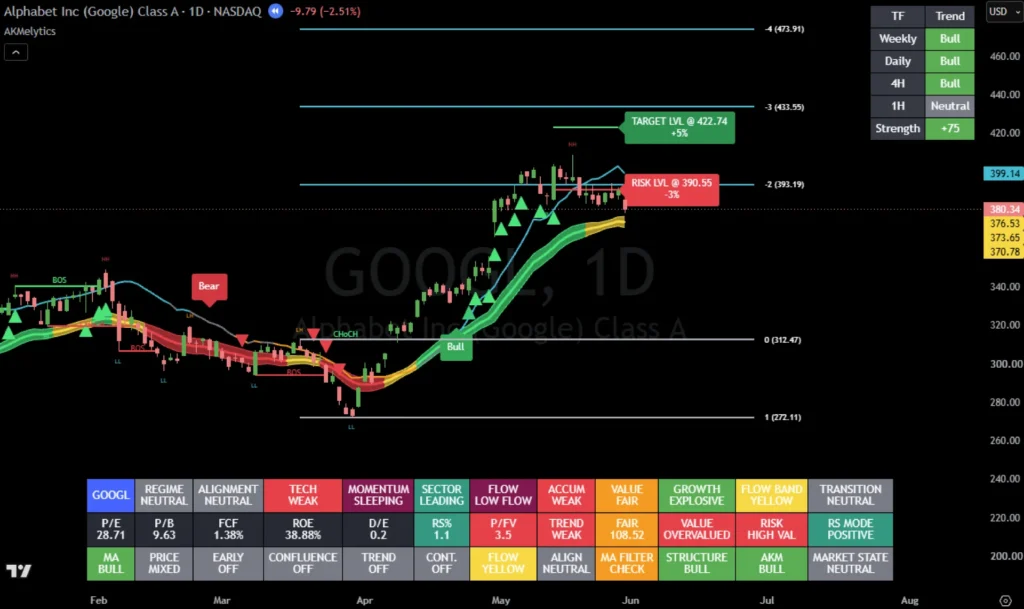
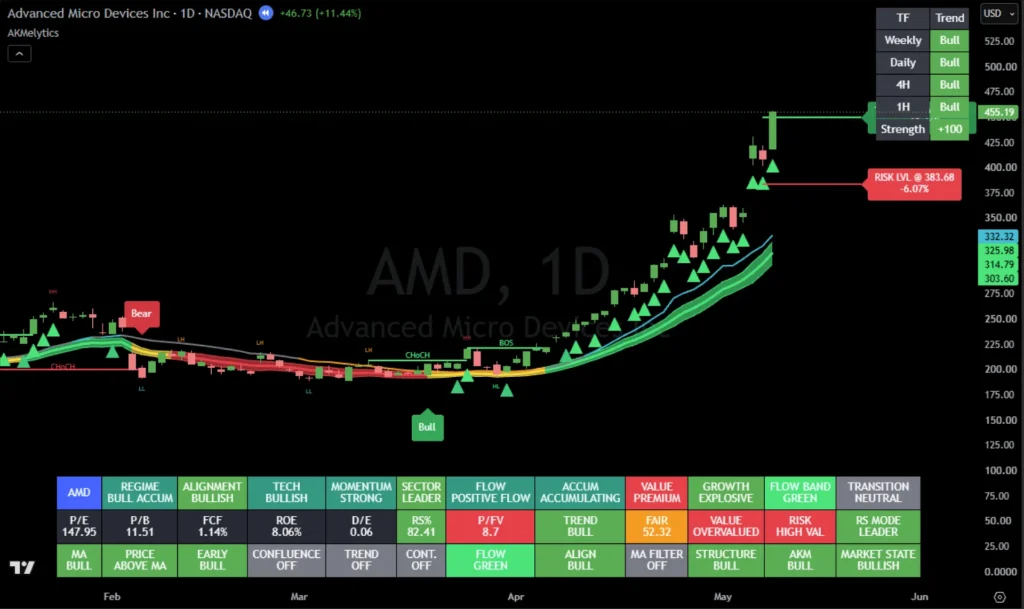
AKMelytics – Market Intelligence Indicator © is an advanced market intelligence indicator for Tradingview designed to help traders identify high-probability trading opportunities by combining trend analysis, momentum evaluation, market structure, institutional activity, and smart money concepts into a single decision-making framework.
The smart money indicator simplifies market analysis by filtering noise and highlighting only the most relevant trading conditions, allowing traders to focus on quality setups rather than interpreting multiple indicators separately. It was designed to understand the market accumulation, momentum and distribution stages, create market profile for efficient and lower margin of error to a profitable entry.
At the core of AKMelytics is the proprietary AKM – Adaptive Kernel Momentum engine, which uses adaptive local-linear kernel regression, volatility normalization, market-efficiency analysis and momentum acceleration to evaluate whether price movement is strengthening, weakening or transitioning.
Rather than relying on a single crossover or conventional oscillator, AKMelytics combines several analytical layers to provide a clearer view of current market conditions.
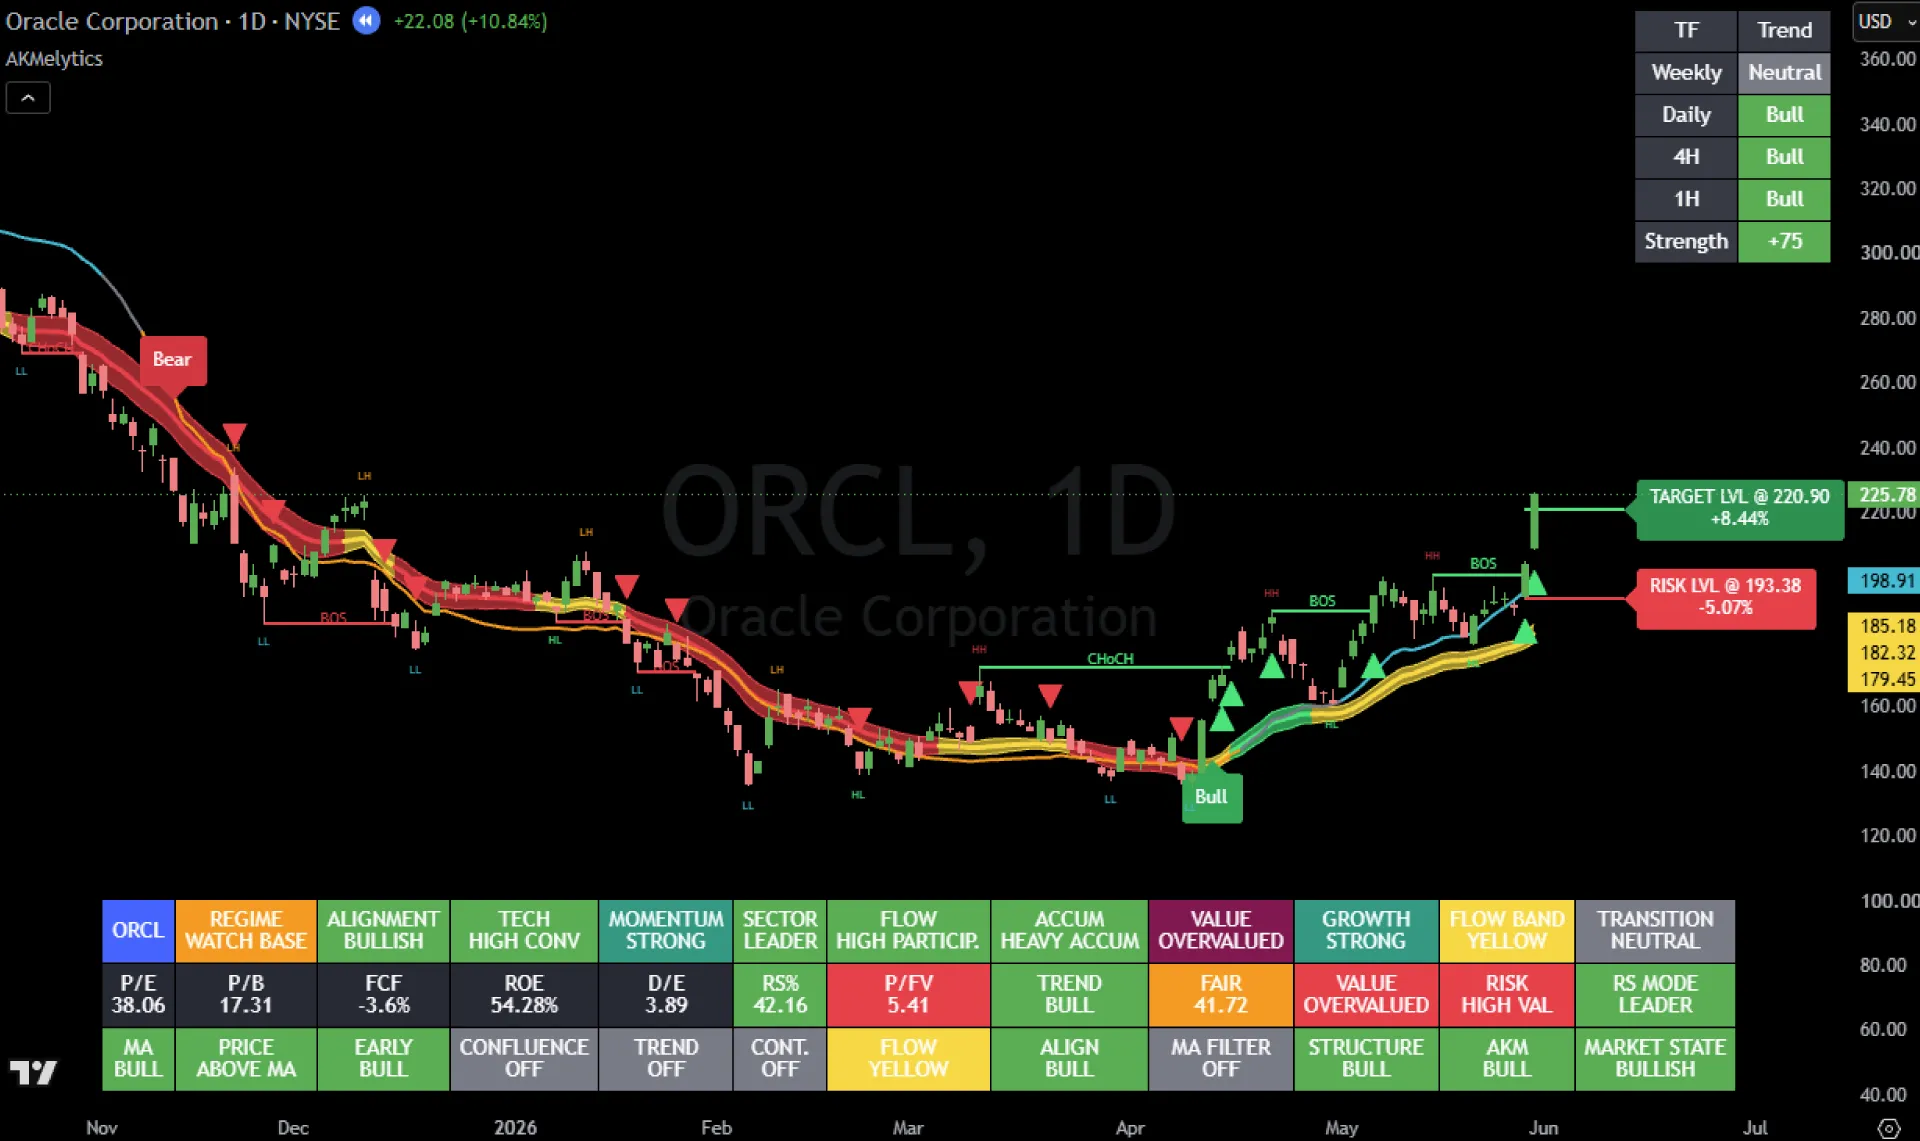
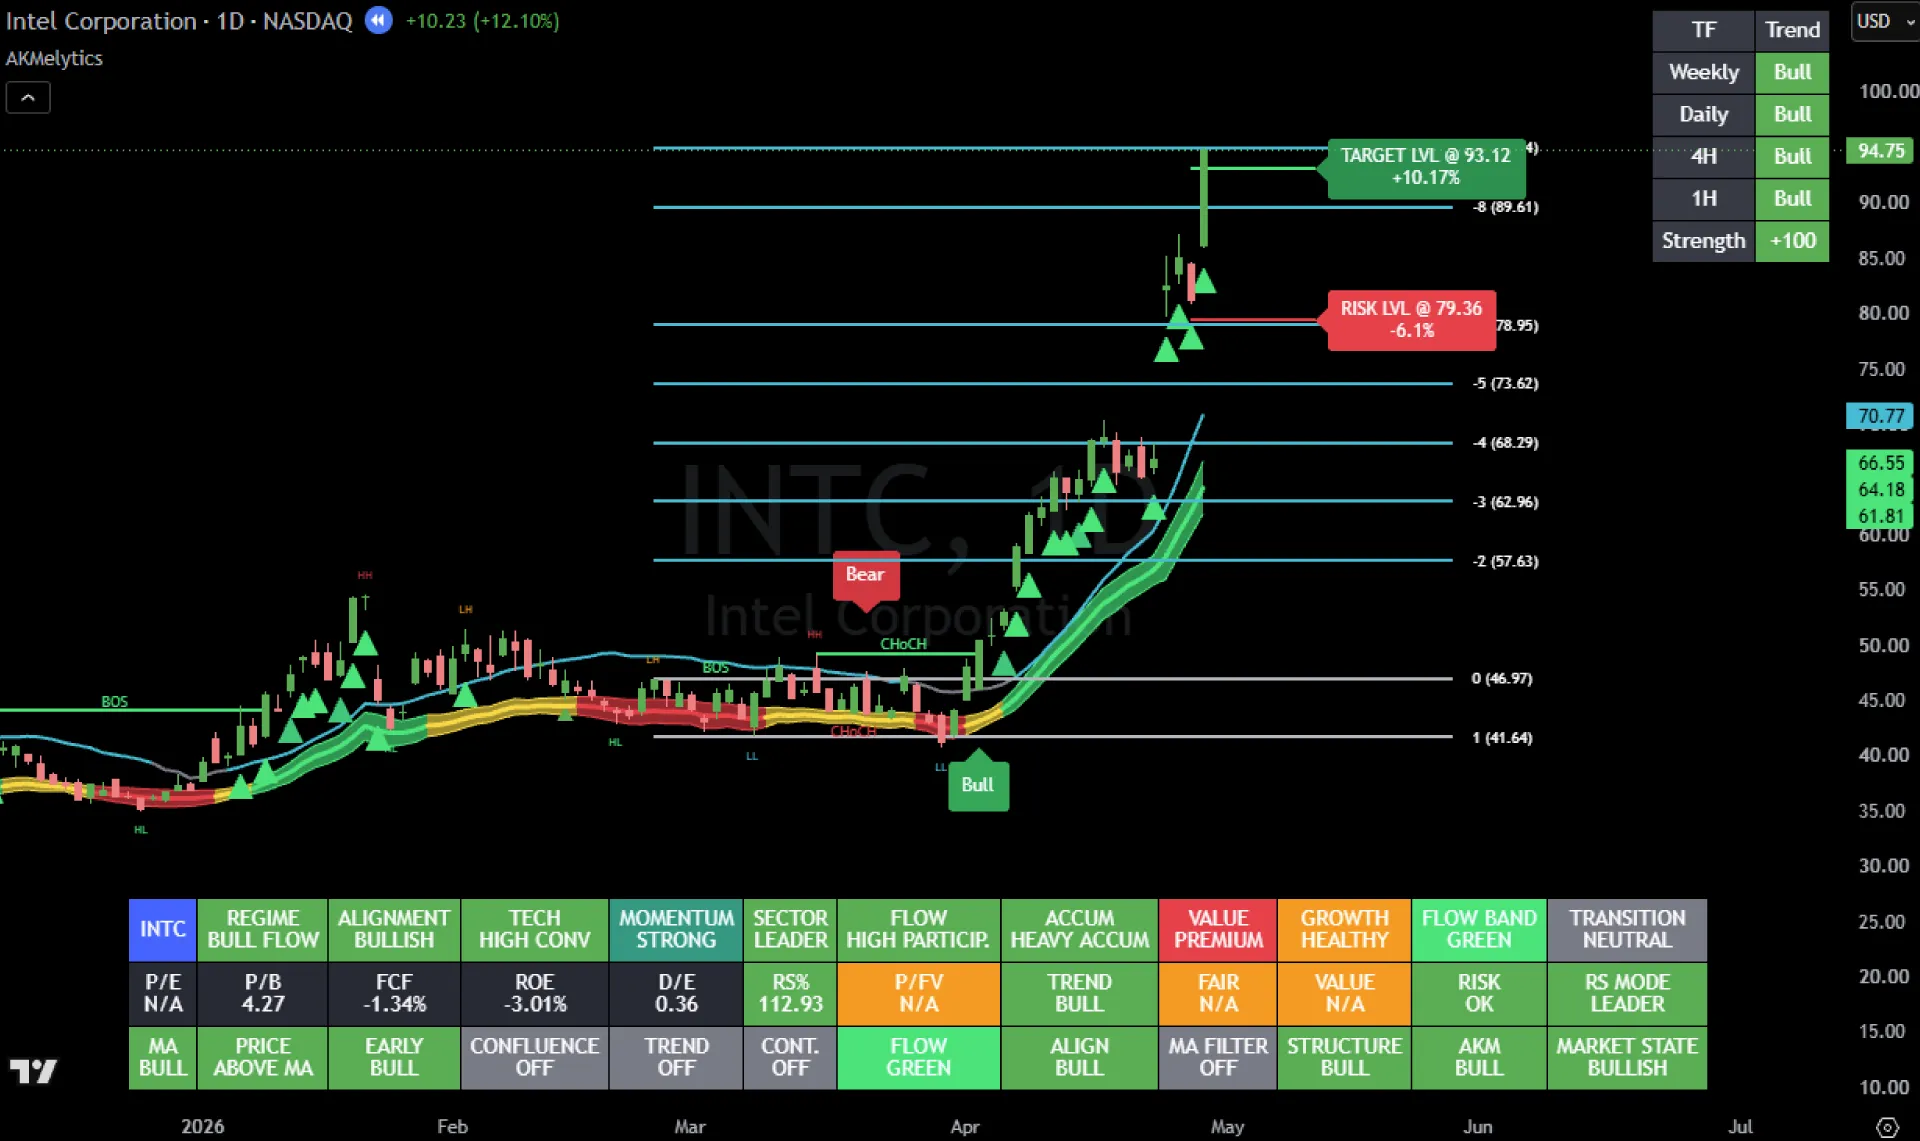
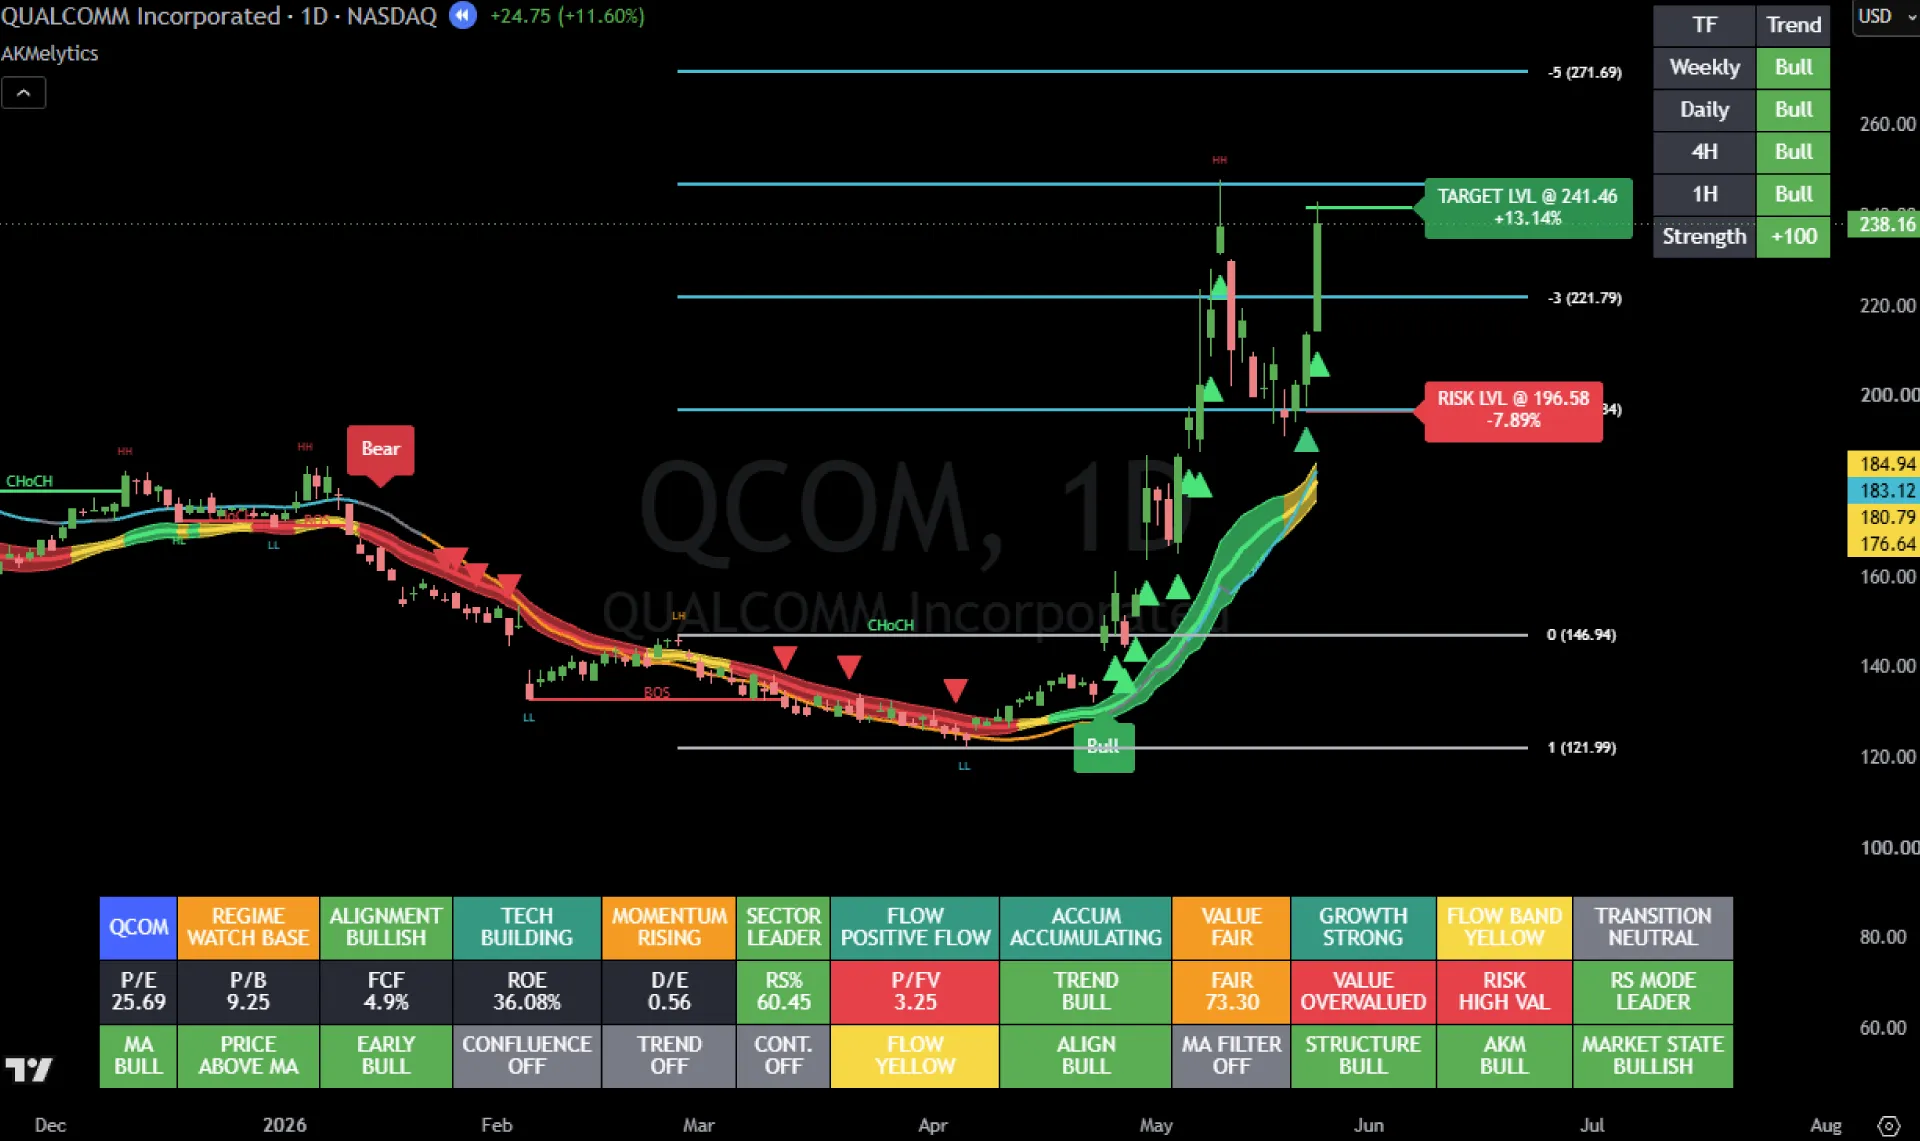
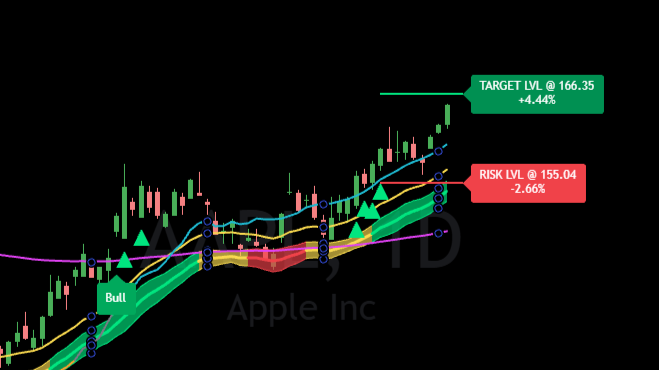
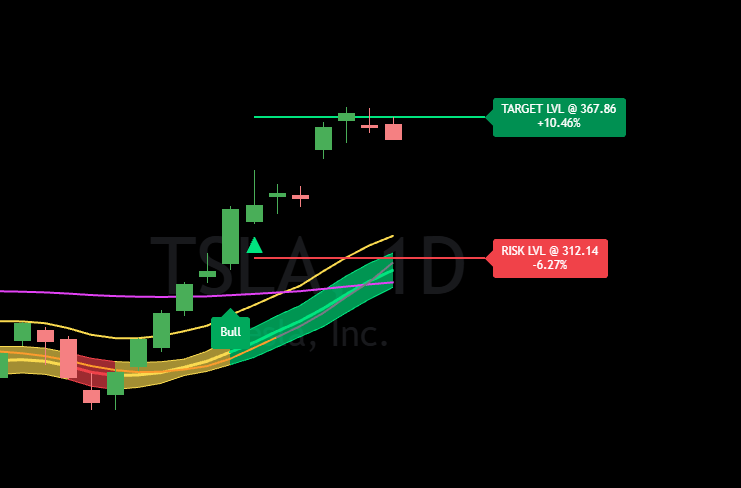
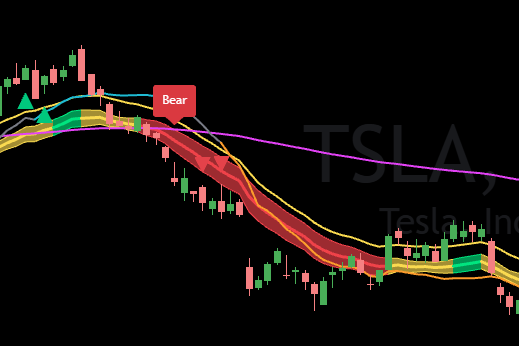
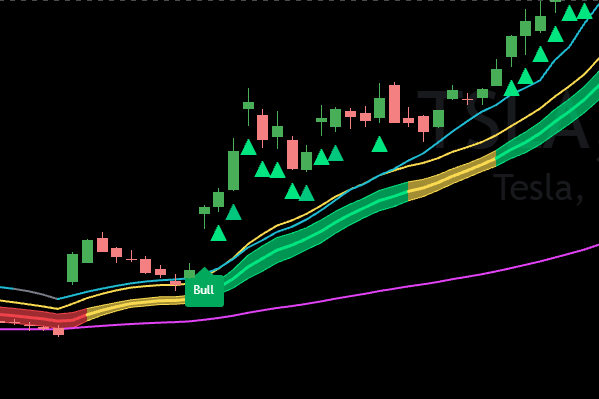
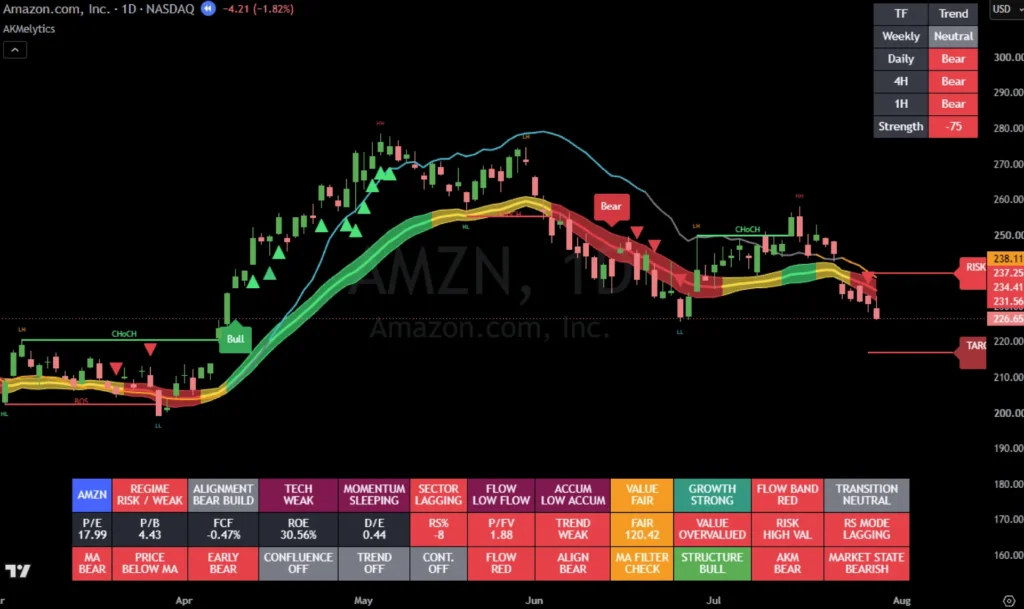
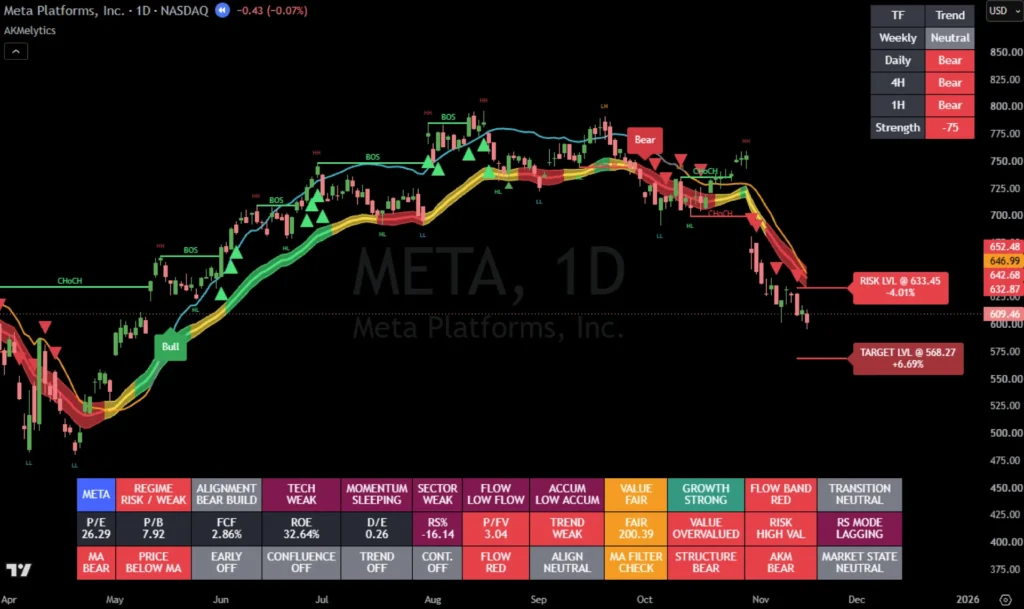
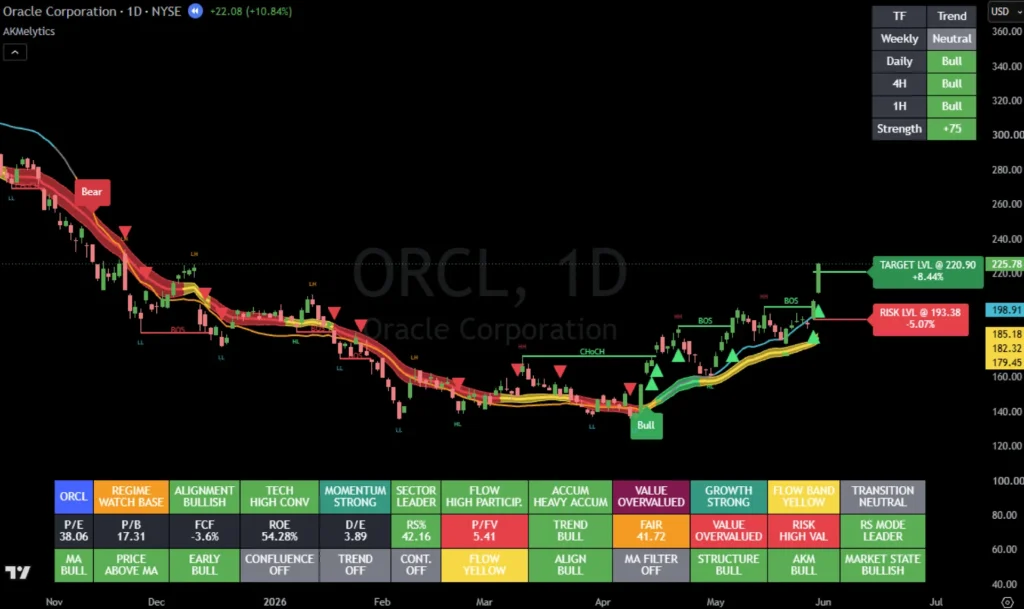
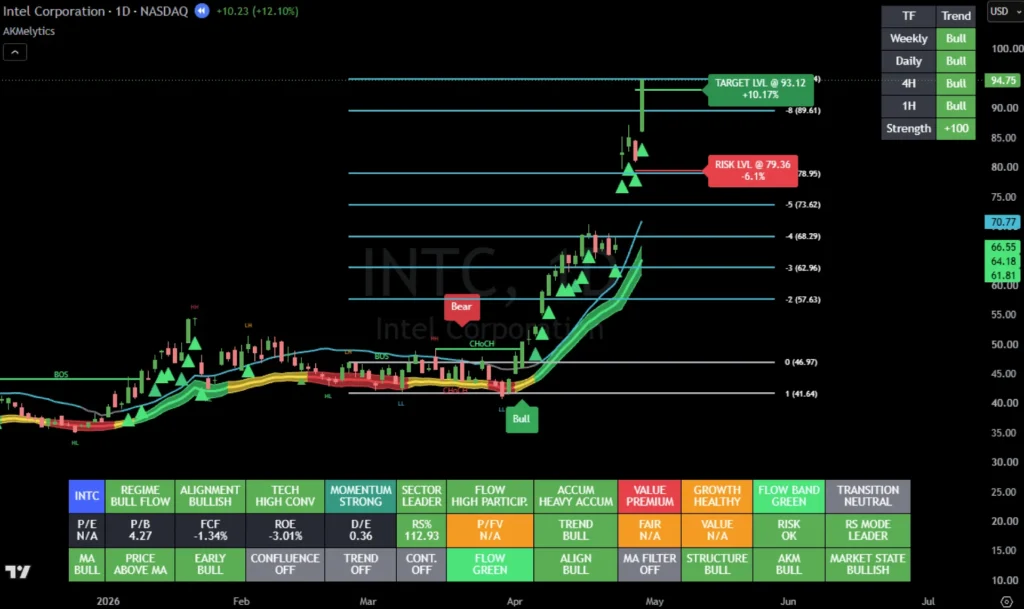
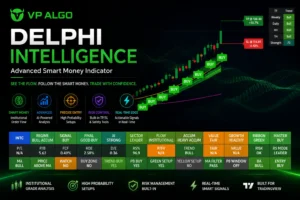
Indicator Photos
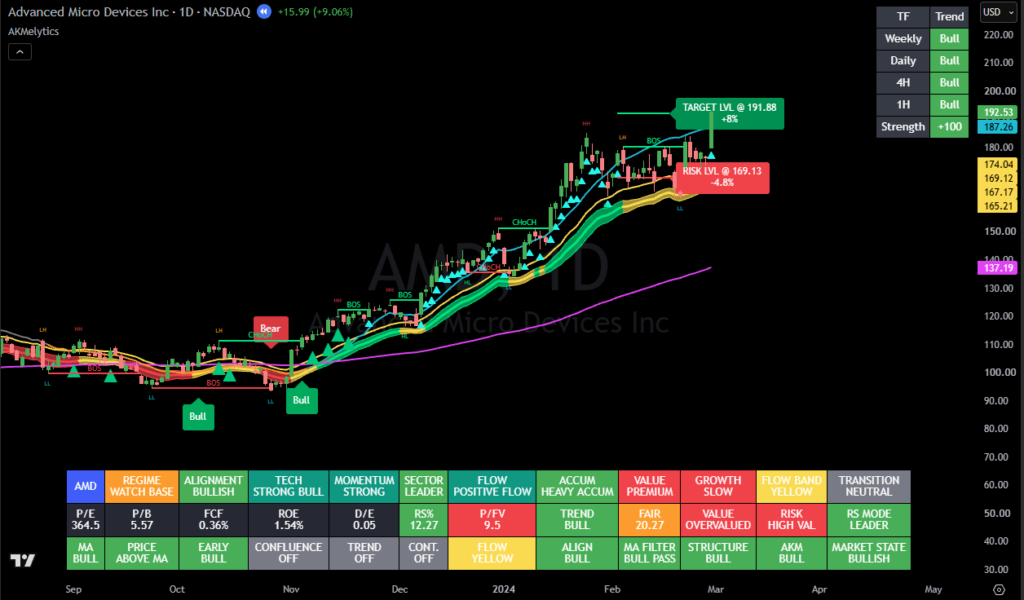
Key Features
✅ AKM – Adaptive Kernel Momentum
The core momentum engine dynamically adapts to changing volatility and market efficiency to identify directional momentum and filter short-term market noise.
✅ Bull & Bear Market Transitions
AKMelytics identifies important changes in technical market conditions through Bull and Bear transition events.
These transitions are designed to highlight changes in market regime rather than provide repetitive signals throughout an existing trend.
✅ Bullish & Bearish Alignment Markers
Simple directional arrows highlight periods where multiple technical conditions become aligned:
▲ Bullish Alignment
▼ Bearish Alignment
Alignment conditions can include AKM momentum, trend structure, moving averages, Market Flow Ribbon and price behaviour.
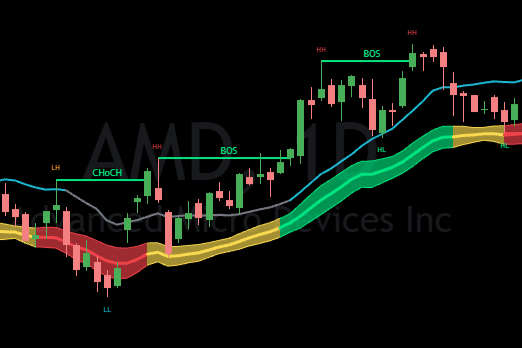
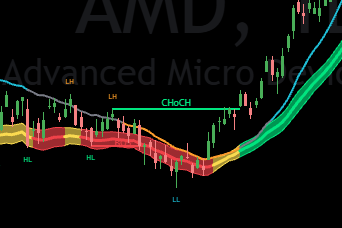
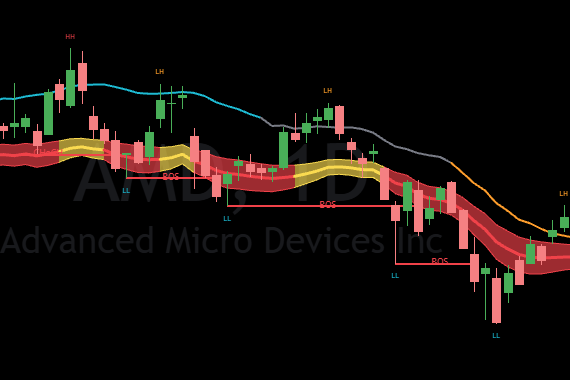
✅ BOS & CHoCH Market Structure
The integrated market-structure engine identifies confirmed swing behaviour including:
- Higher High – HH
- Higher Low – HL
- Lower High – LH
- Lower Low – LL
- Break of Structure – BOS
- Change of Character – CHoCH
Structure breaks are confirmed using candle closes to help distinguish between trend continuation and potential structural change.
✅ AKMelytics Structure Fibonacci
Automatically generated Fibonacci projections are anchored to confirmed market structure.
When qualifying structural conditions occur, AKMelytics can display projected price levels to help traders evaluate potential reaction and extension zones.
✅ Market Flow Ribbon
The Market Flow Ribbon combines momentum, volume, volatility and participation-based technical data into a simple visual market-state representation.
- Green: Positive market-flow conditions
- Yellow: Transitional or mixed conditions
- Red: Negative market-flow conditions
✅ Target Lvl & Risk Lvl
AKMelytics can display volatility-based technical reference levels:
Target Lvl – algorithmically calculated price projection.
Risk Lvl – corresponding volatility-based risk reference.
These levels provide additional technical context when analysing market conditions.
✅ MA Trend Framework
A configurable moving-average framework helps determine broader trend alignment and price positioning.
Default structure:
- MA1 – 21
- MA2 – 144
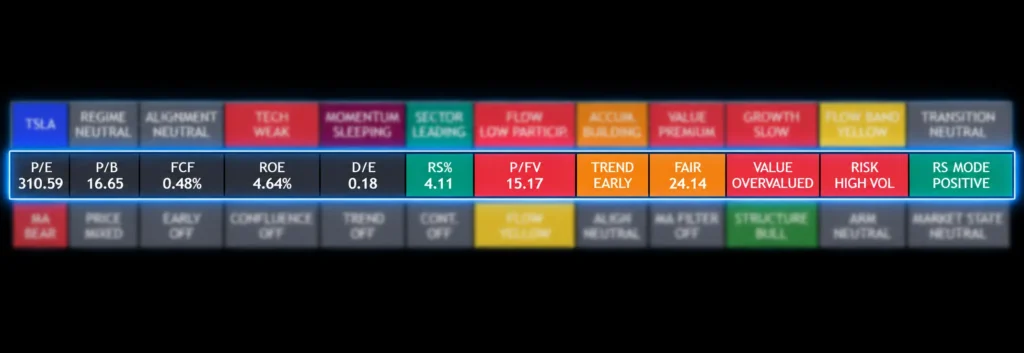
✅ Market Intelligence Dashboard
The integrated dashboard provides an at-a-glance overview of multiple market dimensions, including:
- Market Regime
- AKM Momentum
- Technical Condition
- Market Flow
- Participation / Accumulation
- Relative Strength
- Sector Context
- Value
- Growth
- Moving Average Structure
- Bull / Bear Transition
- Market Structure
✅ Multi-Timeframe Analysis
Monitor broader trend conditions across multiple timeframes:
- Weekly
- Daily
- 4 Hour
- 1 Hour
This helps identify whether shorter-term market behaviour is aligned with or conflicting with higher-timeframe conditions.
✅ Relative Strength Analysis
Compare the selected instrument against a configurable market benchmark to evaluate:
- Relative performance
- Improving or weakening relative strength
- Benchmark leadership
- Sector or market outperformance
✅ Financial Dashboard
Where TradingView financial data is available, AKMelytics can display additional fundamental information including:
- P/E
- P/B
- Free Cash Flow Yield
- ROE
- Debt-to-Equity
- Revenue Growth
- EPS Growth
- Value Score
- Growth Score
Fundamental information is provided as additional context alongside technical analysis.
Money Management
✅ Gann Support & Resistance Levels
Projects important price levels directly on the chart.
✅ ATR-Based Trade Management
Includes dynamic target & risk levels visualization based on market volatility.
TradingView Alerts
Create TradingView alerts for selected AKMelytics analytical events including:
- Bull Transition
- Bear Transition
- Bullish Alignment
- Bearish Alignment
- Bullish BOS
- Bearish BOS
- Bullish CHoCH
- Bearish CHoCH
- Structure Projection events
Why AKMelytics?
Traditional indicators often analyse only one component of the market.
AKMelytics combines:
Momentum → Trend → Market Structure → Market Flow → Relative Strength → Participation → Projection → Multi-Timeframe Context
into one unified market-intelligence environment.
This allows users to identify areas where multiple analytical components agree while also recognizing situations where momentum, structure and trend are conflicting.
Suitable Markets
✔ Stocks
✔ ETFs
✔ Indices
✔ Cryptocurrencies
✔ Commodities
Performance and behaviour will vary depending on the asset, liquidity, volatility and timeframe selected.
TradingView Invite-Only Access
AKMelytics – Market Intelligence is provided through a TradingView Invite-Only Script.
After purchase, access will be granted to the TradingView username provided by the customer.
Please ensure that your TradingView username is entered correctly during checkout or account registration.
Access is linked to the authorized TradingView account and may not be transferred or shared with another user.
Proprietary Technology
AKMelytics incorporates proprietary implementation and internally developed logic involving:
- Adaptive Kernel Momentum
- Adaptive bandwidth calculation
- Regression-quality analysis
- Momentum acceleration
- Market-state classification
- Bull/Bear transition sequencing
- Market Flow analysis
- Technical scoring
- Market-structure integration
- Dashboard architecture
Important Information
Disclaimer
AKMelytics is a technical and quantitative market-analysis tool intended for research, educational purposes and decision support.
Bull/Bear transitions, directional arrows, BOS/CHoCH, Target Lvl, Risk Lvl, Fibonacci projections, dashboards and alerts represent algorithmically detected market conditions and technical reference levels.
They do not constitute personalized financial, investment or trading advice and do not guarantee future market performance.
Users remain responsible for conducting their own analysis, assessing their financial circumstances and risk tolerance, and seeking appropriately licensed professional advice where required.
Past market behaviour and historical indicator performance do not guarantee future results.
CFTC RULE 4.41 – HYPOTHETICAL OR SIMULATED PERFORMANCE RESULTS HAVE CERTAIN LIMITATIONS. UNLIKE AN ACTUAL PERFORMANCE RECORD, SIMULATED RESULTS DO NOT REPRESENT ACTUAL TRADING. ALSO, SINCE THE TRADES HAVE NOT BEEN EXECUTED, THE RESULTS MAY HAVE UNDER-OR-OVER COMPENSATED FOR THE IMPACT, IF ANY, OF CERTAIN MARKET FACTORS, SUCH AS LACK OF LIQUIDITY. SIMULATED TRADING PROGRAMS IN GENERAL ARE ALSO SUBJECT TO THE FACT THAT THEY ARE DESIGNED WITH THE BENEFIT OF HINDSIGHT. NO REPRESENTATION IS BEING MADE THAT ANY ACCOUNT WILL OR IS LIKELY TO ACHIEVE PROFIT OR LOSSES SIMILAR TO THOSE SHOWN.
Frequently Asked Questions:
1. What is AKMelytics – Market Intelligence?
AKMelytics – Market Intelligence is an advanced smart money flow indicator for TradingView that combines trend analysis, momentum, market structure, institutional flow, and a smart dashboard to help traders identify high-probability trading opportunities.
2. Which markets can I use AKMelytics on?
The indicator is suitable for multiple financial markets, including:
- Stocks
- Indices
- ETFs
- Cryptocurrencies
- Commodities
3. Which timeframes work best?
AKMelytics can be used on all TradingView timeframes. It is particularly effective for swing trading on higher timeframes while also supporting intraday and day trading.
4. Is AKMelytics beginner-friendly?
Yes. The indicator is designed with a clean dashboard and easy-to-read signals, making it suitable for both beginners and experienced traders. However, having a basic understanding of market trends and risk management is recommended.
5. What does the Bull signal mean?
A Bull signal indicates that the indicator has identified favorable bullish market conditions. It should be used together with price action and proper risk management rather than as a guarantee of future price movement.
6. Does the indicator repaint?
AKMelytics is designed to generate signals based on completed market data. As with many indicators that analyze live market conditions, information may update while a candle is still forming. For more reliable confirmation, many traders prefer waiting for the candle to close.
7. Can I use this indicator without other indicators?
Yes. AKMelytics is designed as an all-in-one trading tool that combines several types of market analysis into a single indicator. Some traders may still choose to combine it with their own trading strategies or price action analysis.
8. Does the indicator include risk level management?
Yes. The indicator includes ATR-based risk level management visualization to assist with trade planning and risk management.
9. Does it work for scalping?
Yes. The indicator can be used for scalping, day trading, and swing trading. Traders should choose timeframes and risk management approaches that match their trading style.
10. Can I receive TradingView alerts?
Yes. AKMelytics supports TradingView alerts for its key signals, allowing you to receive notifications when predefined conditions occur.
11. Is AKMelytics a fully automated trading system?
No. AKMelytics is an analytical indicator designed to assist with market analysis and decision-making. It does not automatically execute trades.
12. Will AKMelytics guarantee profitable trades?
No. No trading indicator can guarantee profits. AKMelytics is intended to improve market analysis, but trading always involves risk. Proper risk management and disciplined trading remain essential.
13. Do I need a paid TradingView plan to use the indicator?
A TradingView account is required to use the indicator. Some features, such as the number of indicators per chart or alert limits, depend on your TradingView subscription plan.
14. Will I receive future updates?
Yes. Users who purchase AKMelytics will receive future improvements and feature updates according to the product’s update policy.
15. Is customer support available?
Yes. If you have questions about installation, setup, or using the indicator, you can contact us through our website.
🌐 https://vpalgotrading.com/contact-us/
16. Is product knowledge provided?
Yes. After you purchased, we will send you video tutorial and manual on how to use the indicator.


Recent Comments