
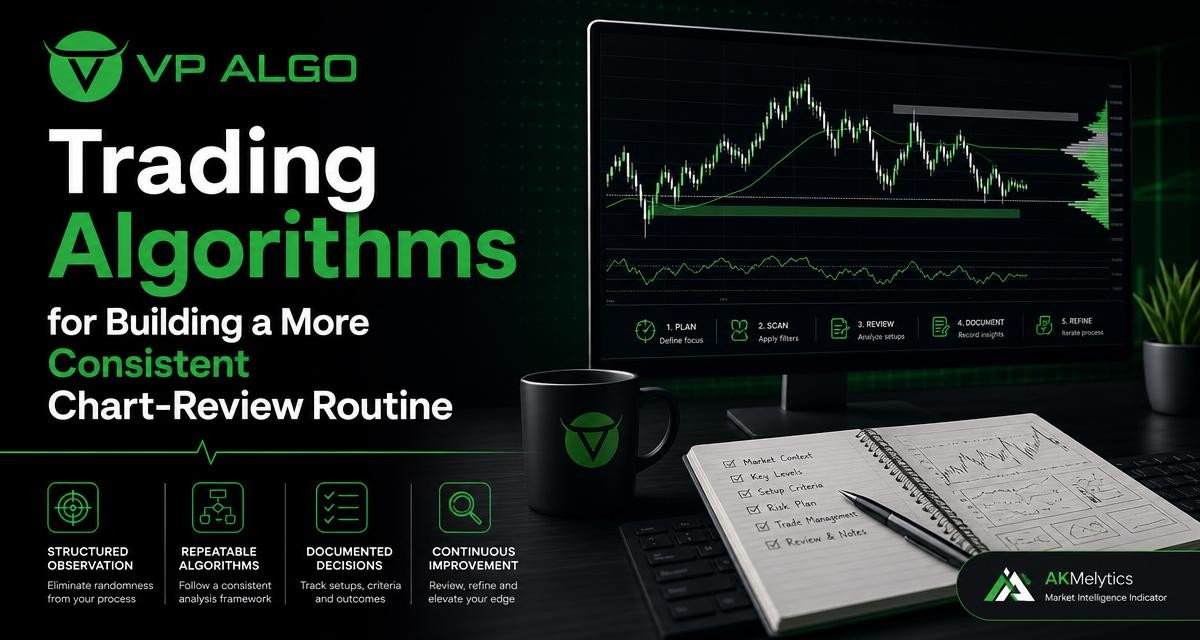
Trading algorithms can make chart review more consistent by organizing repeated observations into a clearer process. Rather than treating an algorithmic tool as a replacement for judgment, traders can use it to review trend, momentum, market structure, institutional activity, and smart money conditions in a repeatable way. This approach is especially useful when a chart contains several competing signals or when each review session tends to follow a different process.
Why consistency matters in chart review
Technical analysis is not only about finding an interesting pattern. It also involves observing the same types of information across different charts and recording why a potential setup appears attractive, uncertain, or unsuitable. Without a defined routine, it is easy to focus on whichever signal is most noticeable at the time. One session may emphasize candlestick patterns, while another may focus only on momentum or a recent price movement.
A consistent review process does not guarantee a particular trading result. It does, however, make the reasoning behind a decision easier to examine. When the same questions are asked repeatedly, traders can identify whether they are reacting to genuine changes in market conditions or simply changing their standards from one chart to the next.
Common problems with an unstructured review
- Starting with a trade idea and searching for confirmation afterward.
- Giving too much weight to one indicator while ignoring conflicting evidence.
- Switching timeframes without documenting what each timeframe is being used to assess.
- Recording entries without recording the market context that supported them.
- Reviewing charts only when a trade opportunity appears instead of following a regular process.
Trading algorithms can help address these issues by presenting recurring observations in a more organized format. The trader remains responsible for interpreting the information, assessing uncertainty, and deciding whether any action is appropriate.
What trading algorithms can contribute to chart analysis
In a chart-review context, trading algorithms are often used to process price and market information according to defined rules. Depending on the tool, the output may help highlight trend direction, momentum conditions, changes in market structure, or areas that deserve closer inspection. The value is not that an algorithm makes the market predictable. Its value is that it can help reduce the inconsistency of manual observation.
A structured indicator can act as a checklist displayed directly on the chart. Instead of repeatedly rebuilding the same analysis from separate visual cues, a trader can review a group of related conditions in a known order. This can make the analysis easier to document and compare over time.
| Chart-review area | What the trader can examine | How an algorithmic tool may help |
|---|---|---|
| Trend | Whether price is showing a sustained directional tendency or a less clear condition | Organize trend-related signals for review across selected timeframes |
| Momentum | Whether price movement appears to be strengthening, weakening, or conflicting with the broader trend | Highlight momentum conditions that may require further inspection |
| Market structure | Important changes in highs, lows, breaks, and potential shifts in direction | Help draw attention to structural developments on the chart |
| Institutional activity | Areas or signals associated with the tool’s institutional-flow analysis | Present relevant observations as part of a wider market review |
| Smart money concepts | Market behavior interpreted through smart money concepts | Give the trader another structured perspective to compare with price action |
Building a repeatable trading technical analysis routine
A useful routine should be simple enough to follow regularly and detailed enough to capture the reasoning behind a decision. It does not need to turn every chart into a long report. The objective is to create a reliable sequence that limits impulsive interpretation and makes later review more useful.
1. Begin with the broader market picture
Start by identifying the general condition shown by the chart. Is the market displaying a directional trend, a range, or a less defined pattern? This first observation provides context for everything that follows. A momentum signal may have a different meaning in a strong trend than it does during sideways movement.
When a tool includes multi-timeframe trend assessment, the information can be used to compare broader and more immediate conditions. The purpose is not to force every timeframe into agreement. Instead, note where the timeframes support one another and where they present different information.
2. Review trend and momentum separately
Trend and momentum are related, but they are not identical. Trend analysis considers the direction and structure of price movement. Momentum analysis considers the strength or persistence of that movement. Separating the two questions can prevent a trader from assuming that a directional market is automatically gaining strength.
For example, a chart may show a broader upward trend while momentum becomes less convincing. That does not by itself provide a trading instruction. It does provide a reason to record the condition and avoid describing the chart as uniformly strong without qualification.
3. Examine market structure
Market structure gives the review a framework for assessing how price has developed. Traders may examine recent highs and lows, structural breaks, and possible changes in directional behavior. A market structure indicator can help draw attention to these developments, but the displayed information still requires context.
Ask whether the apparent structural change is meaningful on the timeframe being reviewed. Also consider whether it agrees with the broader chart picture or represents a shorter-term movement inside a larger trend. Writing down this distinction can make later analysis more precise.
4. Consider institutional activity and smart money conditions
Some trading indicators organize observations associated with institutional activity and smart money concepts. These perspectives can add another layer to chart review, particularly for traders who want to examine how price behavior may relate to areas of interest or changes in participation.
Such information should be treated as part of the evidence rather than as a standalone decision. A smart money indicator may highlight a condition worth investigating, but it should not be interpreted as a guarantee that price will move in a particular direction. Compare the observation with trend, momentum, structure, and the trader’s own plan.
5. Record agreement and disagreement
The most useful part of a review is often the explanation of conflicting signals. A chart may show a supportive trend reading but mixed momentum, or a structural development that does not fit the broader timeframe. Instead of forcing a simple bullish or bearish label, record the disagreement clearly.
- Areas of agreement: observations that point toward a similar market condition.
- Areas of conflict: signals that provide different or opposing interpretations.
- Missing information: questions that cannot be answered from the current chart review.
- Next review condition: what would make the chart worth examining again.

Using an indicator without outsourcing judgment
The distinction between assistance and automation is important. A TradingView indicator can organize information, but it cannot understand a trader’s full circumstances, risk tolerance, objectives, or reasons for reviewing a chart. A signal or highlighted condition is therefore better treated as a prompt for further analysis than as an instruction to act.
Traders can maintain this distinction by using an indicator at specific stages of the process. For example, the tool may be used to screen a chart, focus attention on relevant areas, or create a consistent set of observations. The final interpretation should still include the trader’s own review of price action, timeframe context, uncertainty, and risk considerations.
An algorithmic tool can make a question easier to ask repeatedly; it cannot make an uncertain market certain.
A practical decision journal format
A short journal entry can preserve the reasoning behind a chart review without requiring a lengthy narrative. The exact format can be adapted to the trader’s method, but the following fields are useful:
- Chart and timeframe: identify what was reviewed.
- Overall condition: describe the trend, range, or unclear environment.
- Trend observation: record the broader directional reading.
- Momentum observation: note whether momentum supports or conflicts with the trend.
- Structure observation: describe relevant highs, lows, breaks, or shifts.
- Smart money or institutional-flow observation: record what the indicator highlights and how it fits the rest of the chart.
- Uncertainty: state what remains unclear.
- Decision status: explain whether the chart requires more observation, further research, or no action.
This format helps separate what the tool displayed from what the trader concluded. That separation is valuable when reviewing past decisions because it reveals whether the issue was an unclear market, a misunderstood signal, or a failure to follow the intended process.
How AKMelytics can support an organized review
AKMelytics – Market Intelligence Indicator is designed for traders who want a structured way to examine several parts of market behavior within TradingView. Its stated areas of analysis include trend, momentum, market structure, institutional activity, multi-timeframe trend assessment, and smart money concepts.
Used appropriately, the indicator can serve as an organized reference during chart review. A trader might begin with the broader trend assessment, compare it with momentum, inspect market structure, and then consider the additional institutional or smart money observations. This creates a repeatable sequence rather than a review based only on the most visually prominent candle or signal.
The indicator should not be presented as a substitute for trading knowledge or personal judgment. It is intended to assist with education and trading-decision analysis, not to provide official financial advice. Traders should interpret its information within their own process and remain responsible for decisions made from that analysis.
Improving the routine over time
Consistency does not mean refusing to improve the process. After completing a series of chart reviews, examine the journal for recurring weaknesses. Perhaps the broader timeframe is being ignored, conflicting momentum is not being recorded, or smart money observations are being treated as conclusions rather than inputs.
Make one adjustment at a time so that it is possible to understand whether the change improves clarity. The purpose of reviewing the journal is not to prove that an indicator was right or wrong in isolation. It is to assess whether the complete analysis was clear, repeatable, and aligned with the trader’s stated method.
Questions to ask during a routine review
- Did I follow the same analysis sequence as in previous reviews?
- Did I distinguish trend from momentum?
- Did I examine the relevant timeframe context?
- Did I record conflicting signals instead of ignoring them?
- Did the indicator improve organization, or did it encourage me to skip independent analysis?
- Can I explain the decision without relying on a single highlighted signal?
Common mistakes when using trading algorithms
Assuming more signals mean better analysis
A chart covered with signals can still lack a coherent interpretation. More displayed information may increase confusion if the trader has not decided which questions each feature is meant to answer. Begin with a defined routine and use only the observations that contribute to it.
Treating a signal as a prediction
An indicator output describes a rule-based observation or condition. It does not remove uncertainty from the market or guarantee what happens next. Avoid turning a highlighted condition into a promise about a future move.
Ignoring timeframe conflict
Different timeframes can show different conditions at the same time. A shorter-term change may occur inside a broader trend, and a broad trend may not provide a complete view of immediate momentum. Record the conflict rather than assuming one timeframe invalidates the other.
Failing to document the process
Without notes, it is difficult to know whether a decision came from a consistent method or from hindsight. Even brief records of the chart condition, indicator observations, uncertainty, and decision status can make future reviews more informative.
Final thoughts
Trading algorithms can support a more disciplined chart-review routine when they are used to organize repeated observations rather than replace trader judgment. A structured process can include trend, momentum, market structure, institutional activity, multi-timeframe context, and smart money concepts while still leaving room for uncertainty and independent interpretation.
For traders using TradingView, a tool such as AKMelytics – Market Intelligence Indicator can provide a consistent reference for reviewing these areas. Its usefulness depends on how it fits into the trader’s process. The strongest routine is not the one with the most signals; it is the one that produces clear, documented reasoning and recognizes that no indicator removes the need for careful analysis.
Frequently asked questions
What are trading algorithms used for in chart review?
Trading algorithms can process market information according to defined rules and organize observations about areas such as trend, momentum, and market structure. They can support a repeatable review process but do not remove market uncertainty.
Can trading algorithms replace a trader’s judgment?
No. An algorithmic tool can highlight conditions or organize information, but the trader must interpret the chart, consider conflicting evidence, and remain responsible for the final decision.
How does a trading algorithm support technical analysis?
It can help standardize repeated checks across charts and timeframes. This may make it easier to compare trend, momentum, market structure, institutional activity, and smart money observations during a technical analysis routine.
What is AKMelytics – Market Intelligence Indicator?
AKMelytics – Market Intelligence Indicator is a TradingView indicator from VP ALGO TRADING that supports analysis of trend, momentum, market structure, institutional activity, multi-timeframe trends, and smart money concepts.
Should a smart money indicator be used by itself?
It is generally more useful as one part of a wider review. Compare smart money observations with trend, momentum, market structure, timeframe context, and your own documented analysis.
What should traders record after reviewing a chart?
Record the chart and timeframe, overall market condition, trend and momentum observations, structural developments, conflicting signals, uncertainty, and the reason for the review outcome.
Do trading algorithms guarantee profitable results?
No. Trading algorithms and indicators cannot guarantee profits or eliminate losses. They are tools for analysis and decision support, not guarantees of future market outcomes or official financial advice.


Recent Comments