
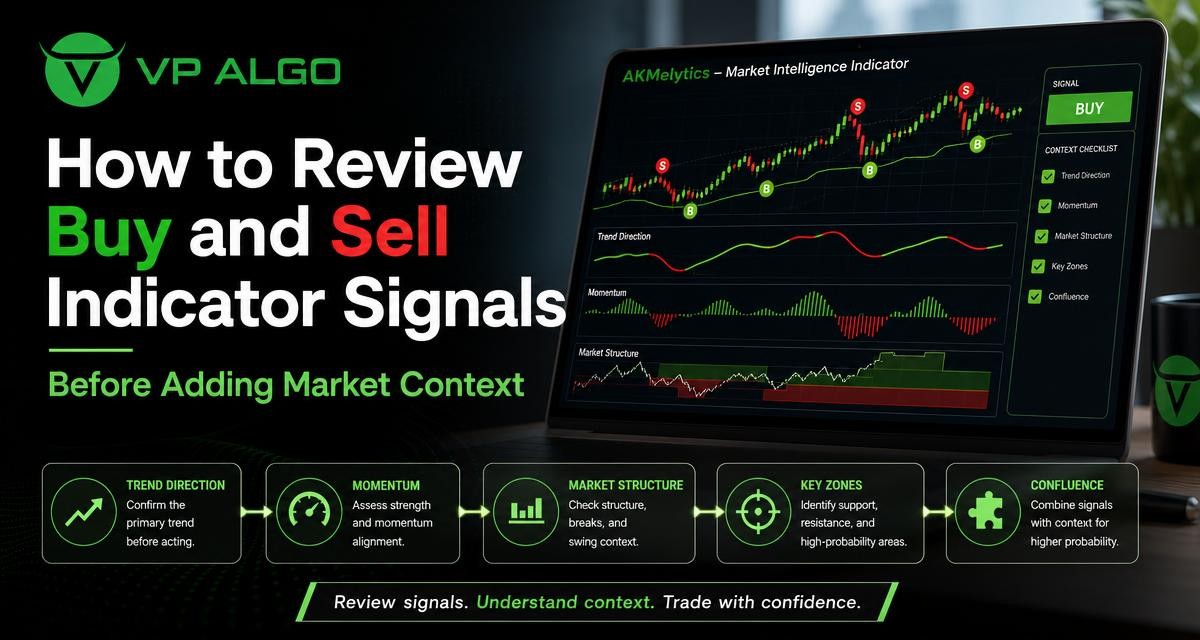
Finding the Best trading indicator buy and sell signal is only the beginning of a sound chart review. A signal can draw attention to a possible change in price direction, but it does not explain the entire market on its own. Before treating a buy or sell indication as part of a trading setup, traders can examine trend direction, momentum, market structure, institutional activity and the relationship between different timeframes.
Why a Buy or Sell Signal Needs Context
An indicator signal is usually a condensed interpretation of price or market data. It may highlight a potential entry when certain conditions are present, but the same signal can have very different meanings in a rising trend, a falling trend or a sideways range. A buy indication that appears during a sustained decline may represent a short-term reaction rather than a durable change in direction. Likewise, a sell indication during a strong uptrend may reflect temporary weakness instead of a complete reversal.
Context helps traders ask a more useful question than “Is this signal correct?” The better question is whether the signal agrees with the surrounding evidence. This does not remove uncertainty, and it does not guarantee a profitable result. It creates a more structured process for reviewing a chart before making a trading decision.
A Practical Review Sequence for Indicator Signals
A consistent sequence can reduce the temptation to act on the first visual alert. The exact rules will vary between trading strategies, markets and timeframes, but the following order provides a useful framework.
- Identify the signal. Record whether the indicator is showing a potential buy, sell, trend change or momentum event.
- Check the broader trend. Review whether price is generally moving higher, lower or sideways on the selected timeframe and, where relevant, a higher timeframe.
- Assess momentum. Look for evidence that price movement has strength, is slowing or is becoming inconsistent.
- Read market structure. Examine recent highs, lows, breaks and areas where price has reacted.
- Review participation clues. If available, consider institutional activity, smart money concepts or flow-related information as supporting context rather than a standalone instruction.
- Define invalidation and risk. Decide what market behaviour would weaken the idea before considering any trade execution.
This sequence separates observation from decision-making. It also makes it easier to review a missed opportunity or an unsuccessful setup without relying on hindsight.
Start With Trend Direction
Trend analysis establishes the direction in which the market has recently been moving. A trend indicator for TradingView may help organise this review by displaying directional conditions, but traders still need to interpret what price is doing. Higher highs and higher lows can suggest an upward structure, while lower highs and lower lows can suggest a downward structure. Repeated movement between similar boundaries may indicate a range rather than a clear trend.
A buy signal generally deserves a different reading when it appears in an established upward trend than when it appears below a sequence of declining highs. The same principle applies to sell signals. A sell indication that aligns with downward structure may deserve closer attention than one that appears after an extended advance without any confirmed change in structure.
Use More Than One Timeframe Carefully
Multi-timeframe review can add perspective. A trader might first inspect a broader chart to identify the prevailing direction, then move to a lower timeframe to study the signal location and recent price behaviour. This is not a requirement to use several charts, but it can help distinguish a short-term movement from a broader market shift.
Timeframes should not be mixed without a clear reason. A signal on a short-term chart may occur inside a larger downward trend, and the difference can explain why a setup behaves differently from an isolated chart reading. A review should state which timeframe is providing the directional context and which timeframe is producing the signal.
Evaluate Momentum, Not Just Direction
Trend direction tells traders where price has been moving; momentum helps assess how forcefully it is moving. A momentum indicator for TradingView can be used to review whether buying or selling pressure appears to be strengthening, weakening or fluctuating. The indicator should support an overall analysis rather than replace direct observation of price.
For example, a buy signal accompanied by improving upward momentum may present a different context from a buy signal that appears while momentum is fading. A sell indication alongside expanding downward momentum may also require a different review from one that appears after a prolonged move with signs of exhaustion. These observations are not predictions. They are ways to describe the condition of the chart at the time of review.
Look for Agreement and Conflict
Agreement occurs when several parts of the review point in a similar direction. A potential buy signal, upward trend structure and improving momentum may form a more coherent bullish picture than a buy signal that conflicts with each of those observations. Conflict does not automatically invalidate a signal, but it should prompt additional caution and closer examination.
- Directional agreement: The signal points in the same direction as the broader trend.
- Momentum agreement: The strength of movement does not clearly contradict the signal.
- Structural agreement: Recent highs, lows and breaks support the interpretation.
- Location agreement: The signal occurs in a meaningful area rather than in the middle of random price movement.
Read Market Structure Before Acting
Market structure describes the way price forms and breaks significant highs and lows. A market structure indicator can help traders organise these observations, especially when charts contain several swings across different timeframes. The useful question is not simply whether a line or label appears. It is whether the recent sequence of price action supports continuation, a pullback or a possible change in direction.
Consider a buy indication after price has formed a higher low and then moved above a relevant prior high. That signal may have a different structural context from a buy indication that appears while price remains below a sequence of lower highs. Similarly, a sell indication after a lower high and a break below a recent low may warrant a different review from a sell indication that appears inside a broad sideways range.
Structure and Location Work Together
The location of a signal matters because price does not behave identically at every point on a chart. A signal near a recent swing, a range boundary or a visible reaction area may offer more information to review than a signal in an unstructured middle section. Traders should avoid assuming that proximity to a level guarantees a reaction. It simply gives the signal a clearer context for analysis.
Structure can also change. A trader should avoid treating an old market condition as current after price has established new highs, lows or breaks. Reassessing the chart after a meaningful movement helps keep the review connected to the latest available information.

Consider Institutional Activity and Smart Money Concepts
Some trading tools include features related to institutional activity, smart money concepts or flow monitoring. These features can help traders investigate where notable buying or selling interest may be represented on a chart. They should be treated as analytical inputs, not as proof that a particular participant will cause price to move in a specific direction.
A smart money indicator can be most useful when its information is compared with trend, momentum and structure. For example, a flow-related observation that agrees with a structural break may add context to the review. If it conflicts with the direction of price and the broader trend, the conflict is worth recording rather than ignoring. No single label should be used as a substitute for a defined trading plan and risk assessment.
How to Separate a Signal From a Trading Decision
A signal identifies a condition; a trading decision involves a much wider set of questions. Separating the two can help prevent an automatic response to every alert. A trader can first document what the indicator is showing and then assess whether the market context is consistent with the intended strategy.
| Review area | Questions to ask | What it contributes |
|---|---|---|
| Signal | What type of buy, sell or change indication appeared? | Defines the event being investigated |
| Trend | Is price moving upward, downward or sideways? | Provides directional background |
| Momentum | Is movement strengthening, weakening or mixed? | Describes the force behind the move |
| Market structure | What are the latest meaningful highs, lows and breaks? | Shows whether the price sequence supports the interpretation |
| Location | Where did the signal occur relative to recent reactions or boundaries? | Adds price-based context |
| Risk and invalidation | What event would weaken or disprove the setup idea? | Defines limits before action is considered |
This framework does not tell a trader what to buy or sell. Instead, it encourages a repeatable review that can be adapted to a personal strategy, preferred market and chosen timeframe. It also helps distinguish a clear setup from an attractive-looking chart that lacks supporting evidence.
Common Mistakes When Reviewing Buy and Sell Indicators
Treating Every Signal as an Entry
Indicators can produce signals during trends, pullbacks, consolidations and volatile movements. Treating every signal as an immediate entry removes the role of context. A more disciplined approach is to classify the signal first and then check whether it meets the conditions of the trading strategy.
Using Too Many Indicators Without a Process
Adding more tools does not necessarily improve analysis. Several indicators may measure similar aspects of price and create the appearance of confirmation without adding independent information. A small set of clearly understood tools can be easier to interpret than a crowded chart.
Ignoring the Higher-Level Trend
A lower-timeframe signal can look persuasive while moving against a broader trend. That does not make the signal meaningless, but it changes the type of movement being reviewed. It may represent a countertrend reaction, a pullback or a possible transition that still requires confirmation.
Changing Rules After Seeing the Outcome
Reviewing a chart after the move is complete can make a setup look obvious. To reduce hindsight bias, traders can record the signal, market structure, momentum and invalidation conditions before the outcome is known. This creates a more honest basis for evaluating the method.
Using a TradingView Indicator as Part of a Structured Review
TradingView provides a charting environment in which traders can study indicators alongside price action. A TradingView trading indicator can make selected conditions easier to monitor, but the platform does not turn an indicator signal into financial advice or a guaranteed outcome. The quality of the review still depends on how clearly the trader defines the process.
AKMelytics – Market Intelligence Indicator is positioned within the broader category of tools that help traders examine market intelligence, including areas such as trend, momentum, market structure and smart money analysis. VP ALGO TRADING develops and sells TradingView indicators and algorithmic trading tools for traders who want a structured way to study these conditions. The indicator should be used as educational and trading-decision assistance, not as a replacement for independent analysis or risk management.
A Simple Checklist Before Considering a Setup
- What exactly did the indicator signal?
- Which timeframe produced the indication?
- What is the broader trend on the selected and relevant higher timeframe?
- Does momentum support the direction, weaken it or provide mixed evidence?
- What do the latest meaningful highs and lows say about market structure?
- Is the signal located near a relevant reaction area or in an unclear section of the chart?
- What information would invalidate the setup idea?
- Have the observations been recorded before the result is known?
The purpose of this checklist is not to make a market decision automatic. It is to make the reasoning visible. If several answers conflict, the trader can classify the situation as uncertain instead of forcing a buy or sell interpretation.
Final Perspective
The Best trading indicator buy and sell approach is not necessarily the tool that produces the most visible signals. A more useful approach is one that helps traders examine each indication within a broader framework. Trend direction, momentum, market structure, location and participation clues can each add a different part of the picture.
Indicators such as AKMelytics – Market Intelligence Indicator can support this type of review when used alongside a defined process. They do not remove uncertainty, guarantee results or replace risk management. By separating the signal from the decision, traders can build a clearer record of why a setup appeared, what supported it and what would have shown that the idea was no longer valid.
Frequently Asked Questions
What does a buy and sell indicator signal actually show?
It shows that the indicator has identified conditions associated with a potential buying or selling opportunity. The signal does not, by itself, explain the broader trend, confirm an outcome or guarantee a profitable trade.
Why should trend direction be reviewed before a signal?
Trend direction provides background for interpreting the signal. A buy indication in an upward trend may have a different context from one that appears during a sustained decline or a sideways range.
What is a market structure indicator used for?
A market structure indicator can help organise observations about highs, lows, breaks and changes in the sequence of price action. It is a review aid rather than a guarantee of future movement.
How does momentum add context to a buy or sell signal?
Momentum helps describe whether price movement appears to be strengthening, weakening or mixed. Comparing momentum with direction and structure can reveal agreement or conflict around a signal.
Should every indicator signal be treated as an entry?
No. A signal is one input in a broader review. Traders can assess trend, momentum, structure, location and invalidation conditions before deciding whether the indication fits their own strategy.
Can a smart money indicator replace independent analysis?
No. Smart money or institutional activity features can provide additional context, but they should be compared with price action and other parts of the trading plan rather than used as a standalone instruction.
Is an indicator a form of financial advice?
No. Trading indicators are analytical tools. They can assist with chart review and trading decisions, but they do not provide personalised financial advice or remove the possibility of loss.


Recent Comments