
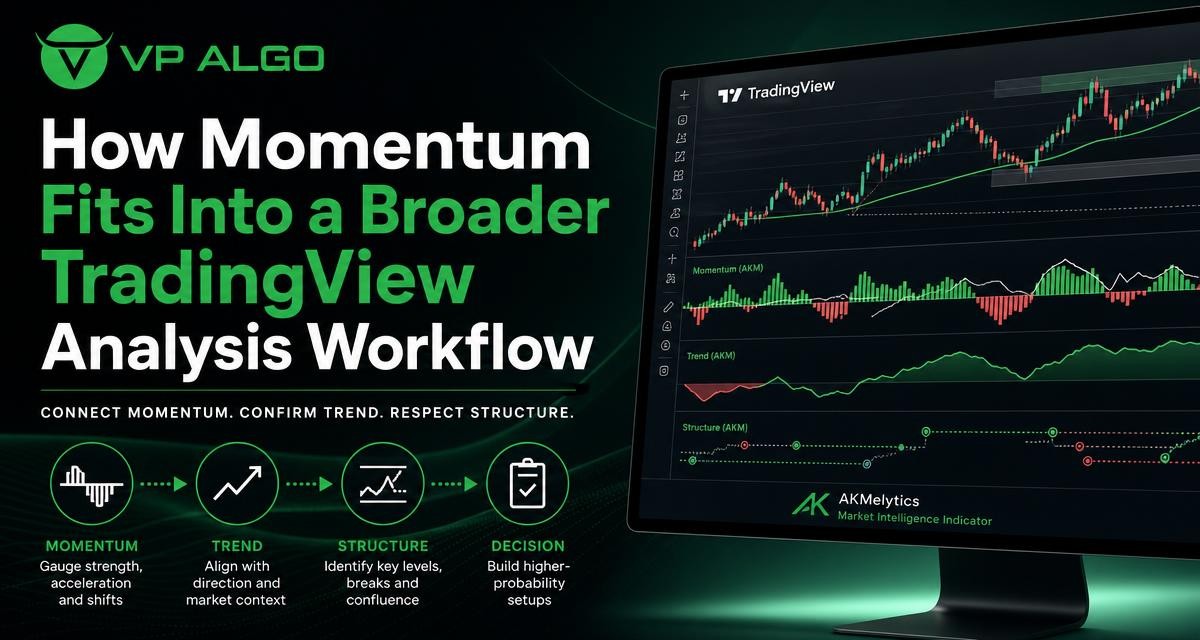
A momentum indicator for TradingView can help traders assess the strength and pace of a price move, but momentum is only one part of a reliable analysis process. When reviewed alongside trend direction, market structure, price behaviour, and higher-timeframe context, momentum observations become more useful and less vulnerable to misleading signals.
What momentum tells you about a market
Momentum describes how forcefully price is moving in a particular direction. A rising market with increasing momentum may show that buyers are becoming more active, while weakening momentum can suggest that the move is losing energy. The same principle applies in falling markets, where stronger downside momentum may indicate sustained selling pressure.
However, momentum is not the same as direction. A market can have strong upward momentum while still trading inside a broader range. It can also show weakening momentum during a temporary pullback within a larger uptrend. This is why a momentum reading should be treated as an observation about current price behaviour rather than a complete trading decision.
Momentum and price direction are different questions
Before interpreting a signal, separate two questions: “Which way is price moving now?” and “How strong is that movement?” The first question concerns direction and trend. The second concerns momentum. A momentum indicator for TradingView may help with the second question, but it does not automatically explain the market’s complete structure.
For example, an upward momentum reading near a well-established resistance area may describe short-term buying strength without proving that price can continue higher. In the same way, a downward reading near major support may reflect immediate selling pressure while the broader market remains balanced. Context determines how much weight the observation deserves.
Why momentum should not be interpreted in isolation
Many indicators react to price changes rather than predicting them. This means a momentum tool can become very strong after a move has already started. It may also remain elevated during an extended trend, even when a trader is tempted to assume that an immediate reversal is due.
Reading momentum alone can therefore create two common problems. A trader may enter late because a strong reading appears attractive, or exit too early because momentum begins to slow during a normal retracement. Neither interpretation is necessarily correct without information about trend, structure, and the location of price on the chart.
- Momentum shows pace: it helps describe the strength of recent movement.
- Trend shows direction: it provides a broader view of whether price is generally advancing, declining, or moving sideways.
- Structure shows location: it helps identify swings, ranges, support, resistance, and possible changes in market behaviour.
- Timeframe context shows scale: it distinguishes a short-term fluctuation from a larger market move.
These elements answer different questions. Combining them does not remove uncertainty, but it can make the reasoning behind an analysis more consistent.
A practical TradingView analysis workflow
A structured workflow can prevent one attractive indicator reading from dominating the entire analysis. The order below is not a promise of a particular outcome or a fixed trading strategy. It is a way to organise observations before deciding whether a market deserves closer attention.
1. Start with the higher-timeframe picture
Begin by reviewing a timeframe that is broader than the one used for detailed entries. The purpose is to understand whether the market is trending, consolidating, or moving through a transition. Look at the sequence of significant highs and lows, the direction of larger price swings, and the areas where price has previously reacted.
A short-term momentum signal has a different meaning inside each environment. In a broad uptrend, a temporary negative reading may simply accompany a pullback. In a range, the same reading may indicate movement toward the lower boundary rather than the start of a new downtrend. Higher-timeframe context helps keep these interpretations separate.
2. Use a trend indicator for TradingView as directional context
A trend indicator for TradingView can help summarise whether price is currently aligned with an upward, downward, or less directional condition. The exact calculation varies between tools, so traders should understand what an indicator measures and how it responds to changing prices before relying on it.
The goal is not to make the trend tool decide everything. Instead, compare its reading with visible price action. If the indicator suggests an uptrend while price continues to form higher highs and higher lows, the observations are broadly aligned. If the indicator points upward while price is trapped in a narrow range, the signal may require more caution.
3. Mark market structure before looking for momentum confirmation
Market structure gives a chart a framework. Identify recent swing highs, swing lows, range boundaries, and areas where price has broken or rejected a prior level. This does not require predicting the next move. It simply establishes where the current price sits in relation to important chart features.
Momentum is often more informative when it appears near a meaningful structural event. For instance, increasing momentum after a clear break may support the view that participation has expanded, although it does not guarantee continuation. Weakening momentum near a prior high may suggest that the move deserves closer review, but it does not by itself confirm a reversal.
4. Review the momentum reading
Once direction and structure are understood, examine momentum. Ask whether momentum is strengthening, weakening, or fluctuating. Compare the reading with recent price movement rather than treating a single change as decisive. A sequence of observations is usually more useful than one isolated cross, colour change, or threshold event.
Also look for disagreement between price and momentum. If price reaches a new swing high while momentum does not show comparable strength, this may be a reason to investigate the move more closely. It is not proof that price must fall. Similarly, improving momentum during a price decline may reflect a rebound attempt, short covering, or a pause rather than a confirmed trend change.
5. Check the lower timeframe only after the context is clear
A lower timeframe can help refine an observation, but it can also introduce noise. Shorter charts contain more fluctuations and may produce frequent changes in momentum and direction. Use them to examine the behaviour of price near an area of interest, not to replace the broader analysis.
For example, a trader may first identify an upward higher-timeframe structure, then review whether a lower-timeframe pullback is losing downside momentum near a previously identified area. This is a more disciplined use of a momentum indicator than scanning multiple charts until one produces a favourable signal.
How to combine momentum, trend, and structure
The following framework can make chart reviews easier to repeat. It is not a mechanical buy or sell system. Its purpose is to keep different types of evidence distinct and to encourage traders to record why a conclusion was reached.
| Question | What to review | Why it matters |
|---|---|---|
| What is the broader direction? | Higher-timeframe swings and trend conditions | Places short-term movement in a wider context |
| Where is price located? | Support, resistance, range boundaries, and recent swing points | Shows whether price is near a meaningful structural area |
| How strong is the current move? | Momentum direction, persistence, and changes in strength | Describes the pace of recent price movement |
| Does the lower timeframe agree? | Short-term price behaviour around the area of interest | Helps distinguish a developing reaction from random noise |
| What could invalidate the interpretation? | Opposing structural break or failure to hold a key area | Encourages a defined and testable analysis |
When the signals agree
Confluence occurs when different observations point in a similar direction. A possible example is a higher-timeframe uptrend, a series of higher lows, price holding above a relevant support area, and momentum improving after a pullback. This alignment may make the scenario easier to explain and monitor.
Even when signals agree, confluence is not certainty. Indicators can respond to the same underlying price data, so several tools may appear to confirm one another without providing independent evidence. Traders should still consider volatility, the distance to nearby opposing levels, and whether the market is behaving in a way that matches the original interpretation.
When the signals disagree
Disagreement can be valuable because it highlights an unresolved condition. Suppose a trend indicator remains positive while momentum weakens and price approaches a previous high. Rather than forcing a directional conclusion, a trader may label the market as requiring confirmation.
Another example is a strong momentum reading during a move that remains inside a broad range. The momentum may be real, but the structural setting could limit how far the move travels. In such cases, waiting for clearer evidence or reducing the importance assigned to the momentum reading may be more logical than treating disagreement as a signal to act immediately.
Using multiple timeframes without creating confusion
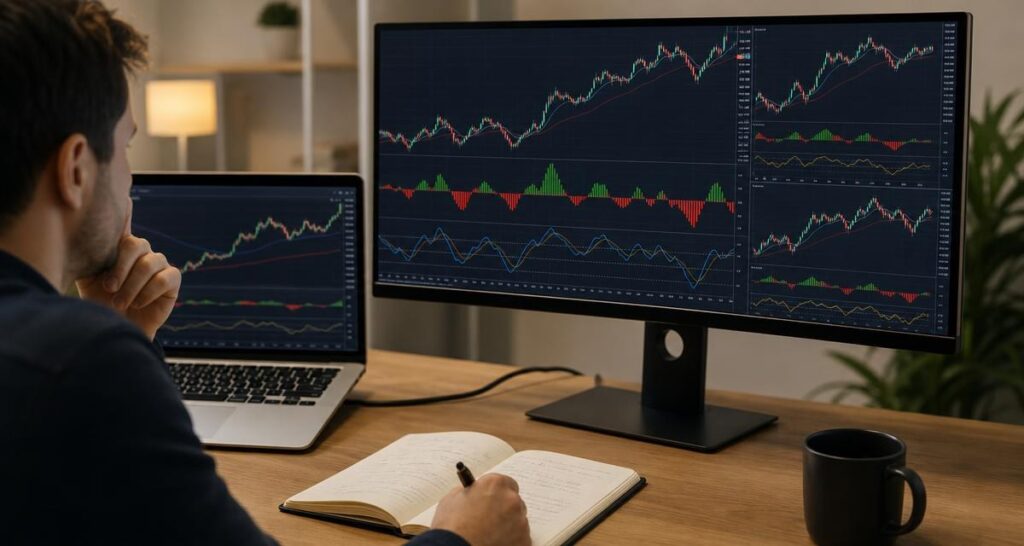
Multi-timeframe analysis is useful when each chart has a defined role. A broad timeframe can provide market context, an intermediate timeframe can show the active structure, and a shorter timeframe can reveal the immediate price response. The exact timeframe choices depend on the trader’s method and are not universal.
A common mistake is to switch between many timeframes until the charts appear to agree. That approach can encourage confirmation bias. Instead, decide in advance what each timeframe is meant to answer. If the higher timeframe establishes direction and the lower timeframe examines timing, do not allow a small lower-timeframe fluctuation to erase the larger picture without a structural reason.
- Define the broader trend or range.
- Identify the active structural area.
- Review momentum on the timeframe relevant to the current move.
- Use a shorter timeframe only to inspect behaviour around the area.
- Record what would change the analysis.
Where a TradingView indicator can support the process
A TradingView trading indicator can make repeated chart reviews more organised by displaying selected observations in a consistent format. This can be helpful for traders who want to compare trend, momentum, structure, and other market conditions without manually rebuilding the same layout each time.
VP ALGO TRADING develops and sells indicators and algorithmic trading tools for TradingView. Its listed AKMelytics – Market Intelligence Indicator is relevant to traders exploring a more structured indicator-based workflow. Any indicator should still be understood on its own terms, tested through personal review, and used as decision-support rather than as a substitute for independent analysis.
The company also identifies the Delphi Intelligence Smart Money Indicator for TradingView, with features related to trend analysis, momentum evaluation, market structure, institutional flow monitoring, multi-timeframe trend assessment, and smart money analysis. These categories show how momentum can sit within a broader analytical process rather than being treated as a standalone answer. They do not remove the need for risk awareness or guarantee a particular market result.
Questions to ask before relying on an indicator
- What market condition is the indicator designed to describe?
- Does it react quickly, or does it deliberately smooth price movement?
- Which signals are trend observations and which are momentum observations?
- How does it behave during ranges, sharp reversals, and low-activity periods?
- Can the reading be explained using visible price structure?
- What information is missing that must be reviewed separately?
Common mistakes when using momentum on TradingView
Treating every strong reading as an entry signal
A strong momentum reading can occur after price has already travelled a significant distance. Without checking nearby structure, the trader may be reacting to an extended move rather than identifying a favourable location. Momentum should describe what is happening, while the broader workflow determines how that information is interpreted.
Assuming weak momentum means an immediate reversal
Momentum often slows before price reverses, but it can also pause before the existing trend resumes. A loss of speed is not the same as a confirmed change in direction. Look for structural evidence, such as a meaningful break or failure to hold an important area, before assigning greater significance to the change.
Adding too many indicators
Several indicators may display different versions of the same price information. Adding more tools can make a chart look detailed while making the decision process less clear. A smaller set of complementary observations is often easier to understand, review, and document.
Ignoring the market environment
Trend-following interpretations can behave differently in a range, while reversal-focused interpretations can behave differently during a persistent trend. Identify the environment first. Then decide whether the momentum reading supports continuation, highlights exhaustion, or is simply inconclusive.
A simple checklist for reviewing momentum
Before treating a momentum observation as meaningful, work through a short checklist. The aim is not to produce certainty. It is to reduce impulsive interpretation and make the reasoning visible.
- What is the higher-timeframe direction or range condition?
- Where are the nearest important swing points and structural boundaries?
- Is price moving toward, away from, or through one of those areas?
- Is momentum strengthening, weakening, or merely fluctuating?
- Does a trend indicator for TradingView agree with the visible structure?
- Is the lower timeframe adding useful detail or just additional noise?
- What observation would show that the current interpretation is no longer valid?
Keeping a written record of these answers can also help distinguish a repeatable process from hindsight. Over time, traders can review whether they consistently confuse momentum with direction, overlook nearby structure, or change timeframe rules after seeing a chart outcome.
Final perspective
A momentum indicator for TradingView is most useful when it has a clearly defined role. It can describe the strength and pace of a move, while trend analysis provides directional context and market structure explains where price is operating. Multi-timeframe review then helps separate a short-term fluctuation from a broader condition.
Tools such as the AKMelytics – Market Intelligence Indicator can be considered within this kind of organised workflow, but no indicator should be treated as financial advice or as a guarantee of trading results. A careful process remains focused on context, uncertainty, and the possibility that an interpretation may be wrong.
Frequently asked questions
What is a momentum indicator for TradingView?
It is a charting tool used to assess the strength or pace of recent price movement. It can help show whether momentum is increasing, decreasing, or changing, but it does not independently establish the full market direction.
How is a momentum indicator different from a trend indicator for TradingView?
A momentum indicator focuses mainly on the strength and speed of price movement. A trend indicator is generally used to describe directional conditions over a broader period. Both can contribute to analysis, but they answer different questions.
Should momentum be used on its own?
It is usually more informative when reviewed with trend, market structure, price location, and timeframe context. Using it alone can make temporary fluctuations or late-stage moves appear more decisive than they are.
Can weakening momentum confirm a reversal?
No. Weakening momentum may occur before a reversal, but it can also accompany a normal pause or pullback. Confirmation requires additional evidence from price structure and the behaviour of the relevant market area.
How can multiple timeframes improve momentum analysis?
A broader timeframe can establish context, while a shorter timeframe can show how price behaves near a structural area. Giving each timeframe a specific role helps prevent minor fluctuations from dominating the analysis.
Can VP ALGO TRADING indicators guarantee profitable trades?
No guarantee should be assumed. VP ALGO TRADING positions its indicators and tools as educational and trading-decision assistance products rather than financial advice. Market outcomes remain uncertain, and traders should conduct their own analysis.


Recent Comments