
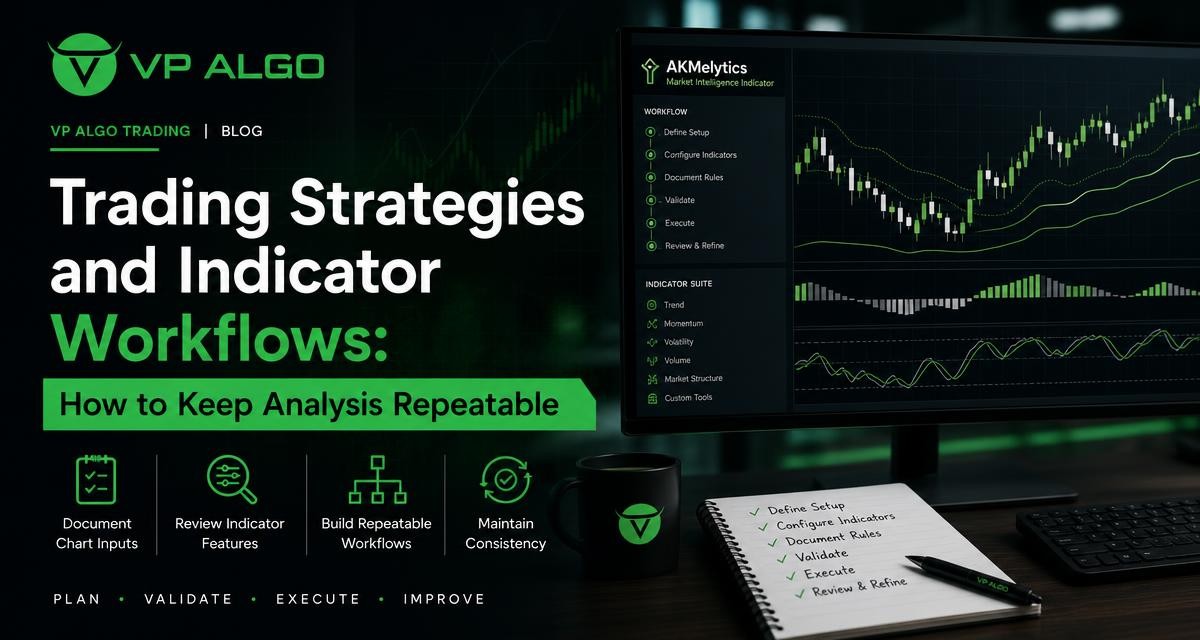
Trading strategies become easier to evaluate when the analysis behind them follows a consistent process. A repeatable workflow does not promise a universal method or remove uncertainty from markets. Instead, it helps traders record the same chart inputs, interpret indicator features in context and review decisions with less guesswork.
Why repeatability matters in trading analysis
Markets rarely provide identical conditions twice. Trends can weaken, momentum can change, and a price movement that looks clear on one timeframe may be ambiguous on another. This makes it difficult to judge a strategy if the trader changes the chart, timeframe, indicator settings or decision rules from one review to the next.
Repeatability gives the process a stable foundation. When the same broad sequence is used each time, a trader can distinguish between the quality of the method and the effect of changing market conditions. The goal is not to make every decision identical. The goal is to make the reasoning visible enough to review.
- Use defined chart timeframes rather than switching without recording the reason.
- Separate observation from interpretation and interpretation from action.
- Record which indicator features were available before the decision.
- Describe why a setup was accepted, rejected or left unresolved.
- Review the process instead of judging every decision only by its outcome.
Start by defining the purpose of the workflow
Before choosing a trading indicator or creating a checklist, decide what the workflow is meant to support. A process for studying broad market conditions may be different from one used to examine a possible entry. Combining both purposes without clear boundaries often produces a crowded chart and unclear decisions.
For example, a trader may use one stage to assess the general trend and market structure, a second stage to examine momentum and a third stage to decide whether the current setup deserves further attention. These stages can be reviewed together, but they should not be treated as identical signals.
Separate context from confirmation
Context describes the environment in which price is moving. It may include the visible trend, the relationship between higher and lower timeframes, recent structural changes and whether momentum appears to be strengthening or fading. Confirmation is the additional evidence a trader wants before considering a setup.
This distinction helps prevent a common mistake: treating every indicator output as an independent reason to act. Several features may be describing the same underlying price movement. A structured workflow asks what each feature adds, rather than simply counting signals.
Document the chart inputs before reading the signal
A useful record begins with the information that was available at the time of analysis. This includes the chart or market being studied, the timeframe, the selected indicator, relevant settings and the date and time of the review. If the workflow uses several timeframes, list each one and assign it a purpose.
Writing these inputs down reduces hindsight. After a price move has developed, it is easy to believe that the relevant trend or structure was obvious from the beginning. A contemporaneous note shows what was actually visible before the outcome was known.
| Input to record | What to describe | Why it helps |
|---|---|---|
| Chart and timeframe | The chart being reviewed and the role of each timeframe | Prevents silent changes to the analysis frame |
| Indicator settings | Selected features and any user-adjusted parameters | Makes later reviews easier to reproduce |
| Market context | Trend, momentum, structure and notable recent movement | Separates observation from the final decision |
| Decision state | Accepted, rejected, waiting or unclear | Records uncertainty instead of forcing a conclusion |
| Reason for review | What prompted the analysis | Shows whether the process is being applied consistently |
Use neutral language in the first pass
The initial note should describe what the chart shows without turning every observation into a forecast. Phrases such as “price is making higher swing points” or “momentum is weakening relative to the earlier move” are more useful for review than statements that assume what price must do next.
Neutral language also makes it easier to compare different trading strategies. A strategy can be assessed by the conditions it requires, the situations in which it should be ignored and the quality of its process, without presenting any single market interpretation as certain.
Review trading indicator features by function
A trading indicator is most useful in a workflow when its features have defined roles. Instead of asking whether an indicator is “accurate” in isolation, ask what question each feature is intended to help examine. This creates a more practical review framework.
Trend analysis
Trend-related features can help organize the direction and consistency of price movement. They may be used to describe whether the market appears directional, mixed or lacking a clear trend. The important point is to define how the observation affects the workflow. A trader might decide that unclear trend conditions require more caution or a separate review rather than immediate action.
Momentum evaluation
Momentum features can help identify whether movement appears to be strengthening, slowing or diverging from the recent price action. Momentum should not automatically be treated as a buy or sell instruction. A strong move may already be extended, while weak momentum can occur during a temporary pause within a broader trend.
Market structure
Market structure analysis focuses on relationships between swings, breaks and areas where the previous price pattern may have changed. A structure feature can support a more disciplined description of what has happened, but it still requires timeframe context. A change on a lower timeframe may not alter the broader structure being monitored on a higher timeframe.
Institutional activity and smart money concepts
Features associated with institutional activity or smart money concepts can form part of a trader’s market review. They should be treated as analytical inputs rather than proof that a particular participant will cause a future move. The workflow should state what the feature indicates, what it does not establish and what other conditions must be present before the chart is considered complete.
Build a step-by-step analysis sequence
A consistent sequence reduces the temptation to search through the chart for evidence after a preferred conclusion has already formed. The exact order can vary, but the following structure gives traders a practical starting point.
- Define the review. Record the chart, timeframe, date, purpose and indicator configuration.
- Describe the broad context. Note whether the market appears directional, mixed or unclear.
- Assess structure. Record relevant swings, breaks or changes without predicting what must happen next.
- Review momentum. Describe whether momentum supports, weakens or complicates the current context.
- Check additional features. Review institutional activity or smart money information if those features are part of the selected workflow.
- Compare timeframes. Identify agreement, conflict or missing information between the chosen chart views.
- Apply the decision rule. Decide whether the conditions meet the written requirements for further consideration.
- Record uncertainty. If the evidence conflicts or is incomplete, mark the setup as unclear rather than inventing a conclusion.
This sequence is not a universal strategy. It is a way to make the analysis process visible. Each trader can define the conditions that fit their own objectives, experience and risk controls, provided those conditions are written clearly enough to review.
Use multi-timeframe analysis without creating confusion
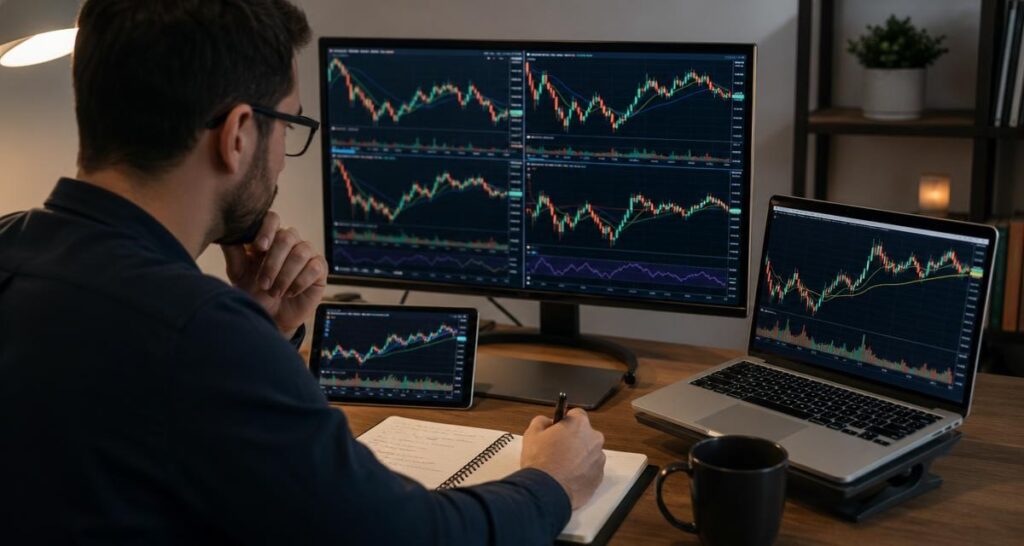
Multiple timeframes can provide useful context, but only when each timeframe has a specific job. A higher timeframe may be used to describe the broader environment, while a lower timeframe may be used to inspect more detailed movement. If both are used to produce the same type of conclusion, disagreements can become difficult to interpret.
| Timeframe role | Questions to ask | Common workflow mistake |
|---|---|---|
| Broader context | What is the larger trend or structural condition? | Using it as a precise entry trigger |
| Intermediate review | Does the recent movement support or conflict with the broader context? | Ignoring changes because the higher timeframe looks simple |
| Detailed view | What recent price and indicator behaviour needs closer inspection? | Letting short-term noise redefine the entire analysis |
When timeframes disagree, record the disagreement. Do not automatically give the most detailed chart the final word. A repeatable method can include a rule that conflicting readings require more review, a different setup classification or no decision at all.
Turn indicator observations into documented rules
Rules do not need to be complicated. They need to be specific enough that two separate reviews of similar conditions would produce comparable reasoning. “Use the indicator to find good trades” is too broad to evaluate. “Review the setup only when the selected trend and structure conditions are present” is more useful, even if the exact conditions still need refinement.
Define required, supporting and disqualifying conditions
A practical checklist can divide observations into three groups. Required conditions are the minimum features that must be present. Supporting conditions strengthen the case but are not sufficient on their own. Disqualifying conditions tell the trader when to stop the review or classify the setup as unsuitable for that workflow.
- Required: The basic context or structure that the method is designed to examine.
- Supporting: Momentum, timeframe alignment or other indicator information that adds context.
- Disqualifying: Conflicting structure, unclear conditions or missing information that prevents a consistent review.
This structure limits the tendency to treat one attractive signal as more important than the rest of the analysis. It also makes it easier to identify which part of a workflow needs improvement when reviews produce inconsistent results.
Review the indicator itself, not only the chart outcome
When assessing a trading indicator, review its usability as well as the chart observations it provides. Consider whether the features are understandable, whether the display supports the intended workflow and whether the tool helps organize information without encouraging overconfidence.
For traders using TradingView, a tool such as the AKMelytics – Market Intelligence Indicator can be considered within this broader process. The relevant review questions are practical: Which market conditions does the trader want to study? Which features relate to trend, momentum, market structure, institutional activity or smart money analysis? How will each feature be recorded, and what will happen when the readings conflict?
The purpose of this review is not to label one indicator as the best choice for every trader. It is to determine whether the tool’s available information fits the trader’s documented method and whether the trader can interpret it consistently. Installation or access questions should be handled through the provider’s stated support process rather than assumed from the chart appearance alone.
Keep a review journal that supports learning
A journal is most valuable when it captures the reasoning before the result is known. It can include a chart snapshot, the written context, the indicator features reviewed, the decision state and any questions that remained open. The record should be concise enough to maintain regularly.
During a later review, group entries by process issue rather than by isolated wins and losses. Look for patterns such as changing timeframes without recording why, treating a supporting feature as a required condition or taking a lower-timeframe change out of context. These observations can lead to a clearer workflow without implying that past outcomes guarantee future performance.
Questions for a weekly process review
- Did I use the same input fields for each review?
- Did I distinguish chart observations from assumptions about future price?
- Which indicator features were genuinely useful, and which were redundant?
- How often did conflicting timeframes lead to an unclear classification?
- Did I change settings or rules after seeing the outcome?
- What part of the workflow needs a clearer definition?
Avoid common workflow problems
One frequent problem is indicator stacking: adding more tools whenever the existing analysis feels uncertain. More features do not automatically create more clarity. If several indicators respond to the same price movement, they may create the appearance of agreement without adding independent information.
Another problem is turning visual labels into automatic instructions. Trend, momentum, structure and smart money features can support analysis, but they do not remove the need for context or personal risk controls. A disciplined workflow keeps the interpretation proportional to what the chart actually shows.
Finally, avoid changing the process after every disappointing outcome. A workflow should be refined through a defined review period and clear observations. Frequent changes make it difficult to know whether a result came from the market, the method or the latest adjustment.
Use a structured process without treating it as a promise
Trading strategies are frameworks for making and reviewing decisions under uncertainty. A repeatable indicator workflow can improve documentation, reduce impulsive interpretation and show where analysis is inconsistent. It cannot guarantee a particular result, eliminate losses or replace a trader’s responsibility to consider risk.
For traders evaluating tools such as a TradingView indicator, the most useful starting point is a clear process: define the chart inputs, assign each feature a purpose, compare timeframes deliberately, record uncertainty and review the reasoning later. That approach allows an indicator to serve as an organized source of market information rather than a substitute for judgment.
Frequently asked questions
What does it mean to make trading strategies repeatable?
It means using a documented sequence of inputs, observations and decision rules so similar market conditions are reviewed in a similar way. It does not mean that every market outcome will be the same.
How should I document a trading indicator workflow?
Record the chart, timeframe, settings, market context, indicator features reviewed, decision state and any conflicting information. Add the reason for accepting, rejecting or postponing the review.
Can one trading indicator provide a complete strategy?
An indicator can organize information about areas such as trend, momentum or market structure, but it does not remove the need for defined rules, context and risk controls. A tool should be evaluated as part of a process.
Why should timeframes have different roles?
Assigning roles prevents a broad context chart and a detailed chart from being treated as interchangeable. It also makes disagreements easier to record and interpret.
What should I do when indicator features conflict?
Record the conflict and follow a predefined rule, such as waiting for clearer conditions or classifying the setup as unresolved. Do not force agreement simply because a decision feels necessary.
Is a repeatable workflow a guarantee of profitable trading?
No. Repeatability improves the review process, but it cannot guarantee profits, predict future results or eliminate trading losses. Market conditions remain uncertain.


Recent Comments