
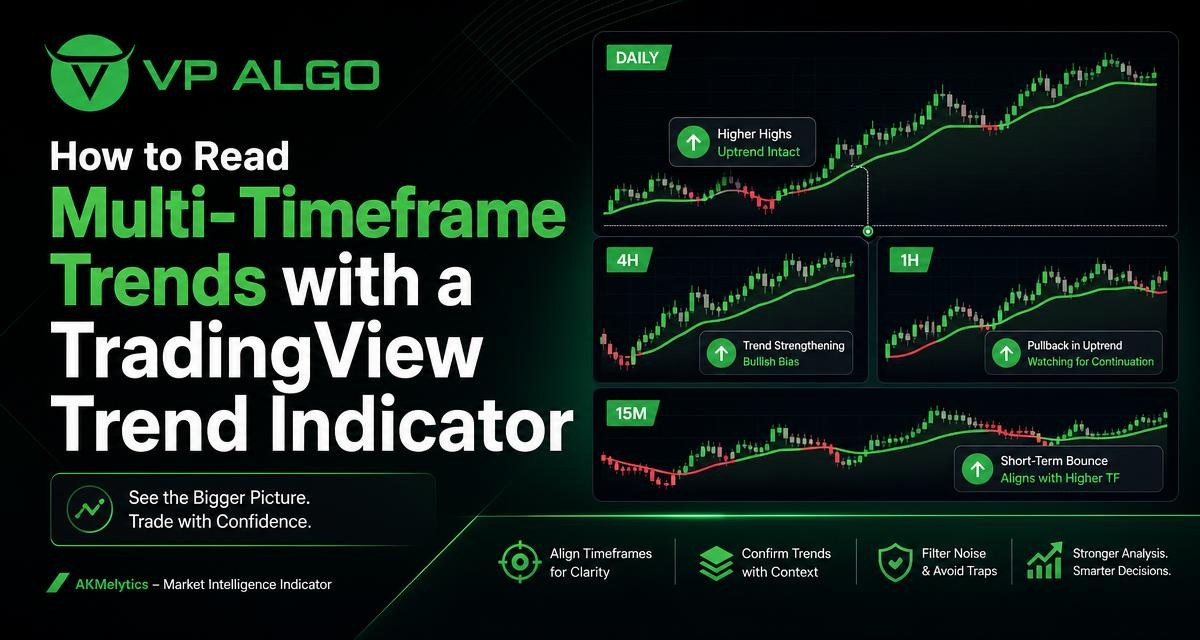
A trend indicator for TradingView can help organize market information, but a single chart timeframe rarely answers every analysis question. A higher timeframe may show the dominant direction, while an intermediate chart reveals the current phase of that move and a lower timeframe highlights short-term momentum. Reading these views together creates a more complete framework for technical analysis without treating any one signal as a complete trading decision.
Why one timeframe can give an incomplete picture
Markets do not move in only one direction at one speed. A chart can be rising over several weeks while declining during the current session. Similarly, a short-term rally may occur inside a broader downtrend. Both observations can be correct because they describe different time horizons.
When traders focus on one chart view, they may mistake a temporary move for a lasting trend. A lower-timeframe chart can make a small rebound look significant, while a higher-timeframe chart may show that the rebound has not changed the broader structure. Multi-timeframe analysis reduces this confusion by separating context from timing.
| Timeframe role | Main question | What to observe |
|---|---|---|
| Higher timeframe | What is the broader market direction? | Major swings, trend persistence, important support and resistance, and overall structure |
| Intermediate timeframe | What phase is the market currently in? | Pullback, continuation, consolidation, reversal attempt, and momentum changes |
| Lower timeframe | What is happening near the potential decision area? | Short-term momentum, price reactions, local structure, and confirmation or rejection |
What a trend indicator for TradingView can show
A trend indicator generally condenses price behaviour into visual information such as directional bias, trend changes, momentum conditions, or the relationship between recent and earlier price movement. On TradingView, this may appear through lines, colours, labels, panels, or other chart signals. The exact display depends on the indicator, so traders should understand what each element represents before using it.
The value of an indicator is not that it removes uncertainty. Its value is that it can make repeated observations easier to compare. Instead of switching between several unrelated observations, a trader can review direction, momentum, and structure using a consistent process. The indicator should remain part of the analysis rather than replacing price action, risk planning, or independent judgment.
Trend direction is not the same as trade timing
A trend reading answers a question about direction over a particular period. It does not automatically identify an entry, exit, position size, or suitable level of risk. A bullish reading on a higher timeframe may coexist with a short-term pullback, and a bearish reading may coexist with a temporary rally.
This distinction is especially useful for beginners. A signal that changes colour or direction on a lower timeframe may describe short-term movement rather than a complete reversal. Comparing the signal with the broader chart can help prevent an immediate reaction to every small fluctuation.
How to build a three-timeframe reading process
A practical process starts from the broadest chart and moves toward the chart used for detailed observation. The purpose is to avoid allowing short-term noise to define the whole analysis. The timeframes do not need to follow one universal combination; they should match the trader’s holding period and analytical purpose.
1. Start with the higher timeframe
First, identify the broader directional context. Look at the sequence of meaningful highs and lows, the slope or direction shown by the trend indicator, and whether price appears to be extending, retracing, or moving sideways. Do not rely on a single recent candle. The goal is to describe the larger environment in plain language.
Useful higher-timeframe descriptions might include “upward structure with a current pullback,” “downward structure with a temporary rally,” or “range-bound conditions.” These descriptions are more informative than simply labelling a chart bullish or bearish because they acknowledge that trend and correction can exist at the same time.
2. Examine the intermediate timeframe
The intermediate chart connects the broad context to the more immediate price action. It can show whether the current move is developing in the same direction as the higher-timeframe trend or moving against it. This is where traders can study the quality of a pullback, the persistence of momentum, and whether a consolidation is beginning to resolve.
If the higher timeframe is rising but the intermediate timeframe is falling, the difference should not automatically be treated as a contradiction. It may represent a normal correction, or it may signal that the broader trend is weakening. The next step is to observe how price and the indicator behave around relevant structural areas.
3. Use the lower timeframe for detail
The lower timeframe is useful for examining local behaviour, not for overriding every higher-timeframe observation. It may reveal whether short-term momentum is accelerating, fading, or repeatedly failing at a level. It can also help distinguish a clean continuation from a choppy, indecisive move.
Because lower timeframes contain more market noise, their readings should be interpreted with care. Several rapid changes in direction may reflect short-term volatility rather than a meaningful change in the broader market. A lower-timeframe signal becomes more useful when it fits the context established by the other charts.
How to compare trend readings across timeframes
After reviewing each chart, compare the readings rather than treating them as isolated signals. The key question is whether the timeframes are aligned, transitioning, or conflicting. Each condition can describe a different market environment and may require a different level of patience.
| Relationship between timeframes | Possible interpretation | Analytical focus |
|---|---|---|
| Higher, intermediate, and lower timeframes agree | Directional alignment | Check whether momentum is still developing and whether price is extended or near a decision area |
| Higher timeframe agrees with intermediate, lower timeframe differs | Short-term pullback or noise | Wait for evidence that the lower-timeframe move is correcting or continuing the broader trend |
| Higher timeframe differs from intermediate and lower timeframes | Possible transition or countertrend phase | Assess structure, momentum, and whether the higher-timeframe trend is weakening |
| All timeframes move sideways or change frequently | Low directional clarity | Recognise a range or uncertain environment rather than forcing a trend interpretation |
Aligned trends
When the three views point in the same direction, the market may have stronger directional consistency across the selected horizons. This does not guarantee a favourable outcome or remove the need for risk management. It simply means that the short-term movement is not obviously opposing the broader context.
Even during alignment, check whether the move is already extended. A trend can remain intact while momentum slows or price approaches a major area of prior activity. Alignment is therefore a starting condition for analysis, not a reason to ignore price location.
Conflicting trends
Conflicting readings are common and often informative. They may indicate a pullback within a larger trend, a developing reversal, or a range in which different participants are active at different horizons. Instead of forcing the charts into a single label, describe the conflict and identify what evidence would clarify it.
For example, a higher-timeframe uptrend with a declining intermediate trend may call for patience while the correction develops. A lower-timeframe upward signal during that correction could be an early sign of stabilisation, but it should not be treated as proof that the larger trend has resumed.
Combining trend, momentum, and market structure
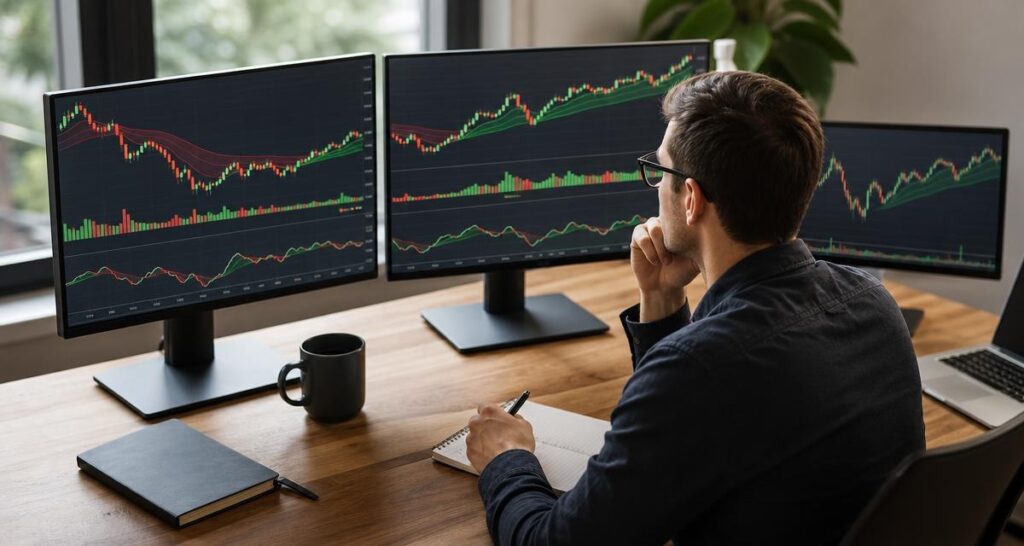
Trend direction is only one part of stock technical analysis. Momentum helps describe the strength or pace of a move, while market structure provides a framework for interpreting swings, breaks, and reactions. Considering these elements together can produce a more balanced reading than relying on a single coloured signal.
Trend context
Ask whether price is generally making higher highs and higher lows, lower highs and lower lows, or moving between a defined area. A trend indicator can support this observation by making directional changes easier to see, but the chart structure still needs to be understood.
Momentum condition
Momentum can be rising, fading, or mixed. A market may continue in the same direction while momentum weakens, which can indicate a slower advance rather than an immediate reversal. Conversely, a sharp momentum reading in the opposite direction may be a short-term reaction within a larger trend.
Market structure
Structure helps place indicator readings in context. A change in a lower-timeframe trend signal has a different meaning when it occurs after a meaningful structural break than when it appears in the middle of a narrow, directionless range. Review notable swing points and reactions instead of giving equal weight to every minor movement.
A useful sequence is: establish the broader trend, identify the current market phase, then evaluate lower-timeframe behaviour near relevant structure.
Common mistakes when using multiple timeframes
Using too many charts
Adding more timeframes does not always create more clarity. Too many views can produce several conflicting readings and encourage selective interpretation. A small, consistent set of timeframes is often easier to review and document.
Treating every disagreement as a reversal
A lower-timeframe change against the higher-timeframe direction may be an ordinary correction. Reversal analysis should consider the persistence of the move, structural changes, and whether momentum continues to support the new direction.
Changing timeframes to find confirmation
Repeatedly switching charts until they agree can create confirmation bias. Choose the timeframe framework before reviewing the market and apply the same process across different chart conditions. Consistency makes the result easier to evaluate.
Ignoring sideways conditions
Trend tools are naturally more straightforward when price is moving directionally. During a range, signals may change more often and provide less directional information. A neutral or uncertain reading is still a useful analytical conclusion.
Confusing an indicator with a complete system
An indicator can support observation, but it does not decide how much capital to risk, whether a trade fits a personal plan, or how losses should be managed. VP ALGO TRADING positions its TradingView tools for educational and trading-decision assistance rather than as financial advice. Traders remain responsible for evaluating their own approach.
Creating a repeatable multi-timeframe checklist
A checklist can keep the analysis focused and reduce impulsive interpretation. It also makes it easier to compare observations from one chart review to the next.
- What is the higher-timeframe structure: rising, falling, or ranging?
- Is the current move a continuation, pullback, consolidation, or possible transition?
- Does the intermediate timeframe support or challenge the broader direction?
- What is the lower timeframe showing: momentum, rejection, acceleration, or noise?
- Are the indicator readings consistent with price structure?
- Is the market near a meaningful area where the current interpretation could be tested?
- What information would invalidate the current view?
The final question is particularly valuable. Analysis is stronger when it includes conditions that would change the interpretation. This prevents a trader from holding onto an initial bias simply because an indicator appeared supportive at the beginning of the review.
Using AKMelytics within a TradingView analysis routine
AKMelytics – Market Intelligence Indicator is identified by VP ALGO TRADING as a TradingView indicator product. Within a multi-timeframe routine, a trader can use the available trend-related information as one structured input while separately reviewing momentum, market structure, and price behaviour.
The most useful approach is to apply the same questions on each selected timeframe: What is the directional reading? Is momentum supporting or weakening that direction? Does the price structure agree? Are the timeframes aligned or describing different phases? This keeps the tool in an analytical role instead of treating a single output as a guaranteed buy or sell instruction.
Traders who need help with installation, activation, or usage can contact the company through its support process. The supplied business information also states that a request-based seven-day free trial is available for its indicator and Telegram channel. Trial availability and conditions should be confirmed directly with VP ALGO TRADING before relying on them.
Final thoughts
Multi-timeframe analysis is a way to organise context, not a method for removing market uncertainty. A higher timeframe can define the broader environment, an intermediate timeframe can show the current phase, and a lower timeframe can reveal local momentum and structure. A trend indicator for TradingView can make these comparisons more consistent, provided its readings are interpreted alongside price action and market conditions.
The central habit is to avoid asking one chart to answer every question. Start broad, move gradually toward detail, record agreements and conflicts, and remain willing to describe the market as uncertain when the evidence is mixed. That process can make technical analysis more disciplined without presenting any indicator as financial advice or a guarantee of results.
Frequently asked questions
What is a trend indicator for TradingView?
It is a TradingView chart tool designed to help display or interpret directional market behaviour. Depending on the tool, it may present trend, momentum, or related market information through lines, colours, labels, or panels.
Why use more than one timeframe?
Different timeframes describe different parts of market behaviour. Using several views helps separate the broader trend from intermediate corrections and short-term price movement.
Which timeframe should be checked first?
Begin with the timeframe that represents the broadest context relevant to your analysis, then move to an intermediate chart and finally a lower timeframe for detail. The exact choices should match your intended holding period and process.
What does it mean when timeframes disagree?
Disagreement may reflect a pullback, a developing transition, or a range. It is not automatically a reversal. Review momentum, swing structure, and the persistence of the move before reaching a conclusion.
Can a TradingView trend indicator predict market direction?
No indicator can remove uncertainty or guarantee future market direction. A trend tool provides analytical information that should be considered with price structure, risk planning, and independent judgment.
Is a lower-timeframe signal enough to confirm a trend change?
Usually, a lower-timeframe signal alone provides limited context. Confirmation should be assessed against higher-timeframe structure and whether the new direction persists rather than appearing as a brief fluctuation.
Is AKMelytics financial advice?
No. VP ALGO TRADING positions its indicators as educational and trading-decision assistance tools, not as financial advice. Users remain responsible for their own analysis and decisions.


Recent Comments