
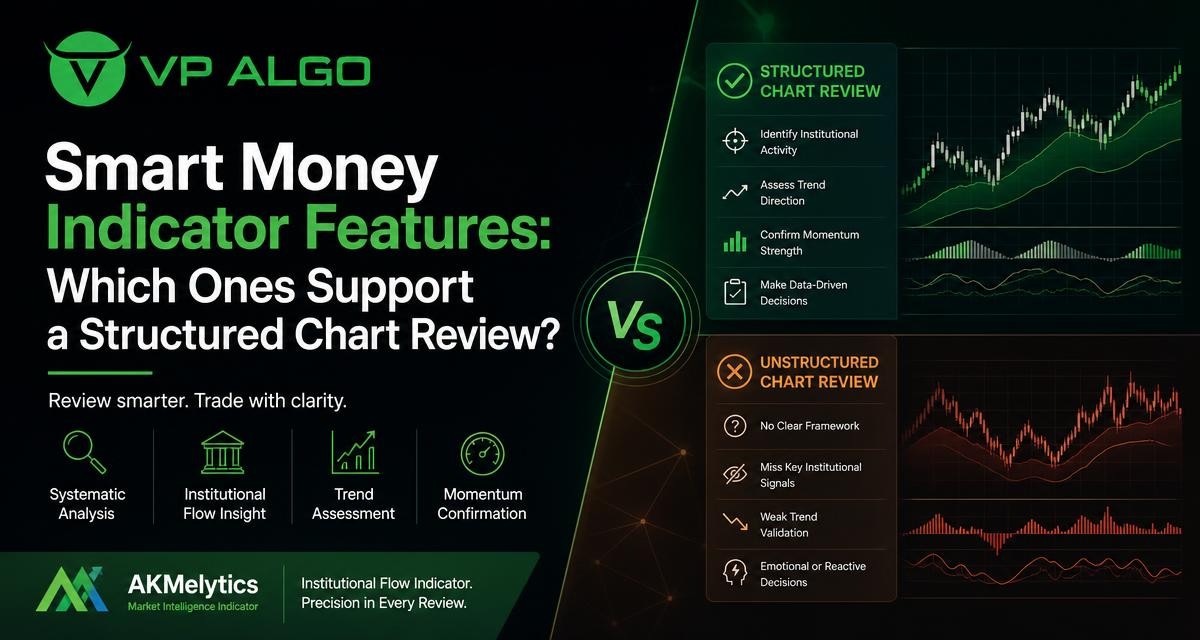
A smart money indicator can help bring several parts of chart analysis into one review process. Instead of examining trend, momentum, market structure and institutional activity as unrelated topics, traders can assess how these conditions appear to fit together. The AKMelytics – Market Intelligence Indicator from VP ALGO TRADING is designed for TradingView users who want this type of structured market review. It is a decision-support tool, not a promise of profitable trades or a replacement for a trader’s own analysis.
Why structure matters during chart analysis
Chart review can become inconsistent when every decision begins with a different question. One session may focus on a recent price move, while another may rely mainly on a momentum signal or a perceived support level. This makes it harder to understand why a setup was considered, rejected or kept under observation.
A structured workflow creates a repeatable order for reviewing market conditions. A trader can begin with the broader trend, examine market structure, consider momentum, review smart money concepts and then assess whether the overall picture is coherent. The purpose is not to force every chart into a trade. It is to make the reasoning behind a review easier to follow and evaluate.
What a structured review should do
- Separate the broader market context from short-term price movement.
- Show which conditions support a possible setup and which conditions create uncertainty.
- Reduce the temptation to act on one isolated signal.
- Give the trader a consistent checklist for comparing charts and timeframes.
- Make it easier to record what was visible before a decision was made.
An indicator can support this process by organizing relevant information on the TradingView chart. However, the trader still needs to interpret the information, define risk, select an appropriate approach and decide whether the conditions are suitable for their own plan.
Core features to assess in a smart money indicator
Not every indicator that uses the phrase smart money provides the same type of information. Some focus on market structure, while others emphasize momentum, trend direction or activity associated with larger market participants. When evaluating a tool, it is useful to ask how each feature contributes to the complete review rather than judging it by the number of signals displayed.
| Feature area | Role in chart review | Useful review question |
|---|---|---|
| Trend analysis | Provides context about directional conditions across the chart. | Is the current movement consistent with the broader direction? |
| Market structure | Helps organize swings, breaks and changes in price behavior. | Has the structure changed, or is price still following the previous pattern? |
| Momentum evaluation | Assesses the strength or weakness accompanying a move. | Does momentum support the move, or is price moving with limited confirmation? |
| Institutional activity | Provides a lens for reviewing activity associated with larger market participants. | Does the activity view add context to the current structure and trend? |
| Smart money concepts | Connects structure and activity into a broader market interpretation. | Does the overall picture suggest alignment, conflict or uncertainty? |
| Multi-timeframe assessment | Compares conditions across more than one chart perspective. | Are the higher and lower timeframes broadly aligned? |
This type of feature set is most useful when it helps the user ask better questions. A crowded chart with many labels may look advanced but still provide little practical value if the information does not improve the review process.
Trend analysis: start with the market context
Trend assessment is often a sensible first step because the same short-term pattern can have different meanings in different market environments. A movement that appears constructive on a lower timeframe may be a temporary rebound when viewed against a broader decline. Conversely, a brief pullback may look less concerning when it occurs within a wider upward structure.
A trend indicator for TradingView can help the trader begin by identifying the general directional context shown by the tool. This does not mean that the trend reading is automatically correct or that a trader should follow it without review. It means the chart has a defined starting point before more detailed signals are considered.
Questions for reviewing trend
- What direction is the broader chart context suggesting?
- Is the current price action moving with or against that context?
- Does the trend view agree with the market structure?
- Is the market directional, changing direction or showing limited commitment?
These questions help prevent a common mistake: treating a single short-term move as a complete market conclusion. Trend analysis is context, not a standalone trade instruction.
Market structure: identify changes in price behavior
Market structure gives traders a framework for examining how price forms swings and whether those swings continue to support the previous directional view. A market structure indicator may help highlight relevant changes, but the trader should still inspect the underlying chart rather than relying only on a label or visual marker.
For example, a trader may review whether recent highs and lows continue to follow the prior sequence or whether price has begun to behave differently. A break in structure can be worth investigating, but it should be considered alongside the timeframe, trend context and momentum. A single break does not automatically establish a lasting reversal.
How structure can fit into the workflow
- Review the existing directional context.
- Identify the most relevant recent swing points.
- Check whether price has maintained or challenged the previous structure.
- Look for agreement or disagreement from momentum and activity-related features.
- Record whether the structure appears established, developing or unclear.
This approach makes market structure more practical. Instead of using technical terminology as a shortcut, the trader connects the structural observation to a specific question: what has changed on the chart, and how significant might that change be within the chosen timeframe?
Momentum: distinguish movement from conviction
Price can move without showing the same degree of momentum throughout the move. Momentum evaluation adds another layer to the review by asking whether the current movement appears supported by strength or is losing energy. A momentum indicator for TradingView can therefore complement trend and structure analysis.
Momentum should not be treated as a guarantee that price will continue. Strong momentum can occur near an extended move, and weak momentum can appear before price resumes its earlier direction. Its practical role is to add information about the quality and pace of the movement being reviewed.
Using momentum without overreading it
- Compare momentum with the direction of the broader trend.
- Check whether momentum agrees with a recent structural change.
- Look for signs that price and momentum are not telling the same story.
- Consider whether the reading is changing or simply reflecting an earlier move.
- Avoid treating a momentum signal as sufficient evidence on its own.
When momentum, trend and structure point in different directions, that conflict is useful information. It may suggest that the chart deserves further observation rather than immediate action.

Institutional activity and smart money concepts
The phrase institutional flow indicator is often used to describe a tool that helps traders examine activity associated with larger market participants. In practice, users should understand what the indicator actually displays and avoid assuming that it provides direct knowledge of every institutional order. An activity-related feature is best used as one analytical lens within a wider review.
Smart money concepts commonly focus on how market structure, liquidity-related behavior and significant price areas may relate to the actions of larger participants. The useful question is not whether an indicator can reveal every decision made by an institution. The useful question is whether its smart money analysis adds organized context to the visible chart and helps the trader examine possible areas of interest more carefully.
Practical questions for activity analysis
- What activity or structure feature is being highlighted?
- Does it appear near an important swing, structural break or trend area?
- Is the activity view consistent with momentum?
- Does the higher timeframe support the interpretation?
- What evidence would invalidate the current reading?
This last question is especially important. A structured review should include conditions that would make the interpretation less convincing. That encourages balanced analysis instead of searching only for confirmation.
Multi-timeframe trend assessment
Reviewing more than one timeframe can help traders distinguish broad context from immediate chart movement. A higher timeframe may show the prevailing structure, while a lower timeframe may reveal a developing move or a short-term conflict. The purpose is not to make every timeframe agree. It is to understand how they relate.
For example, a lower-timeframe momentum improvement may be more meaningful when it occurs within a supportive higher-timeframe structure. The same improvement may deserve greater caution when the broader chart is moving in the opposite direction. A multi-timeframe assessment feature can make this comparison easier to organize, but it does not remove the need to choose timeframes that suit the trader’s method.
| Review layer | Main purpose | What to avoid |
|---|---|---|
| Higher timeframe | Establish broader trend and structural context. | Assuming broad direction determines every short-term move. |
| Working timeframe | Examine the setup, structure and momentum being considered. | Ignoring conflicts with the broader context. |
| Lower timeframe | Study more immediate price behavior if relevant to the plan. | Allowing small fluctuations to dominate the full analysis. |
How AKMelytics can support a repeatable review process
AKMelytics – Market Intelligence Indicator is offered by VP ALGO TRADING for TradingView users who want to review trend analysis, momentum, market structure, institutional activity, multi-timeframe trend conditions and smart money analysis within one workflow. Its value for a particular trader depends on how clearly those features fit the trader’s existing process.
A practical review can begin with the higher-timeframe trend, move to market structure, examine momentum, and then consider activity-related and smart money information. The trader can finish by asking whether the evidence is aligned enough to continue researching a setup or whether the chart remains uncertain. This sequence keeps the indicator in a supporting role rather than turning it into an automatic buy and sell indicator.
A simple chart-review checklist
- Choose the chart and timeframes that match your own analysis process.
- Record the broader trend shown by the chart and indicator features.
- Review current market structure and note any meaningful change.
- Assess whether momentum confirms, weakens or conflicts with the move.
- Examine institutional activity and smart money features as additional context.
- Compare the higher and lower timeframe readings.
- Write down the conditions that support the interpretation and the conditions that challenge it.
- Make any trading decision only within your own risk and decision framework.
The checklist is deliberately cautious. It does not tell the trader what outcome to expect. It creates a record of the reasoning used to evaluate the chart, which can be useful for reviewing decisions later.
What to look for when choosing a smart money indicator for TradingView
Feature coverage is only one part of the evaluation. Traders should also consider whether the display is understandable, whether the information fits their preferred chart style and whether the tool can be incorporated without making the review unnecessarily complicated. More signals do not automatically create better analysis.
- Clarity: Can you explain what each feature represents?
- Workflow fit: Does the indicator support the order in which you normally review a chart?
- Context: Can you distinguish trend, structure, momentum and activity rather than treating them as identical signals?
- Multi-timeframe usefulness: Does the presentation help you compare broader and nearer-term conditions?
- Decision discipline: Does the tool encourage review, or does it tempt you to act on every marker?
- Support needs: Do you know where to request help with installation, activation or usage?
VP ALGO TRADING states that customers can contact support for installation, activation or usage assistance. After purchase, customers are instructed to provide their TradingView ID by email for product access. The website also offers a request-based seven-day free trial for its indicator and Telegram channel. Trial details and access conditions should be confirmed directly with the company before relying on them.
Use indicators as analysis support, not financial advice
A smart money trading indicator can organize information, but it cannot remove uncertainty from financial markets. No indicator can guarantee a result, eliminate losses or replace the need for a personal trading plan. Past chart behavior also does not guarantee future results.
Before using any tool, traders should understand the features, test how the display fits their process and decide how they will manage risk. VP ALGO TRADING positions its indicators for educational and trading-decision assistance purposes rather than as financial advice. The final interpretation and any decision to trade remain the user’s responsibility.
Frequently asked questions
What is a smart money indicator?
A smart money indicator is a chart-based tool that helps organize analysis related to market structure, trend, momentum, institutional activity and smart money concepts. It should be treated as an analytical aid rather than a guaranteed signal service.
What does an institutional flow indicator show?
An institutional flow indicator may provide a way to review activity associated with larger market participants. Traders should examine exactly what the tool displays and should not assume that it reveals every institutional order or guarantees a market direction.
Can a smart money indicator replace technical analysis?
No. It can support technical analysis by bringing several review areas together, but traders still need to examine price, timeframe, market conditions and risk within their own decision process.
How should momentum be used with market structure?
Momentum can be used to assess whether a structural move appears supported by strength or is losing energy. It is most useful when compared with trend and structure rather than treated as an independent instruction.
Is AKMelytics available for TradingView?
Yes. VP ALGO TRADING offers AKMelytics – Market Intelligence Indicator for TradingView. Customers are instructed to provide their TradingView ID by email after purchase for product access.
Does the indicator guarantee profitable trades?
No. The indicator does not guarantee profits, eliminate losses or provide risk-free trading. It is intended to support educational analysis and trading decisions, and users remain responsible for their own choices and risk management.


Recent Comments