
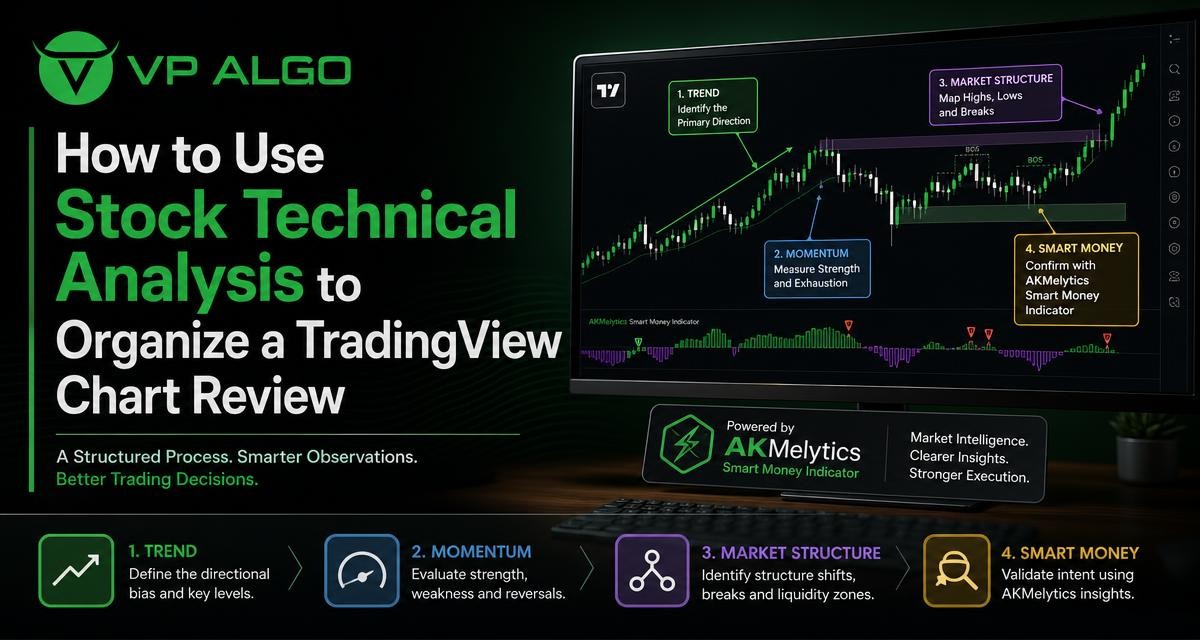
Stock technical analysis becomes more useful when a chart review follows a consistent order. Instead of reacting to one candle, signal or indicator reading, traders can examine trend, momentum, market structure and smart money observations as separate parts of the same process. This approach helps organize a TradingView chart review and makes it easier to explain why a market condition may or may not support further research.
Why a structured chart review matters
A TradingView chart can contain moving averages, oscillators, support and resistance levels, volume information, candlestick patterns and indicator signals. Each tool may answer a different question, but viewing everything at once can create confusion. A structured review reduces that problem by assigning each observation a clear role.
The goal is not to force every chart into a trade. It is to build a balanced view of the market. A trend reading may suggest direction, while momentum shows the strength or weakness behind that movement. Market structure provides context through swings and breaks, and smart money observations can add another perspective on institutional activity and liquidity-related behavior.
The four parts of a stock technical analysis review
A practical chart review can be divided into four stages. The stages are connected, but they should not be treated as interchangeable. A strong trend reading does not automatically confirm momentum, and a market structure event does not by itself establish a complete trading setup.
| Review area | Main question | What to observe |
|---|---|---|
| Trend | What is the broader direction? | Higher or lower swings, directional movement and multi-timeframe alignment |
| Momentum | How strong is the current movement? | Acceleration, slowing movement, signal changes and possible divergence |
| Market structure | How is price behaving around important swings? | Breaks, retests, support, resistance and changes in structure |
| Smart money observations | What may institutional activity or liquidity behavior suggest? | Flow-related information, areas of interest and smart money concepts |
1. Start with the broader trend
Trend analysis should usually come before detailed entry analysis. Begin with a higher timeframe that gives enough context for the market being reviewed. Look at whether price is forming a sequence of higher highs and higher lows, lower highs and lower lows, or a less directional range.
A trend indicator for TradingView can help summarize directional conditions, but the reading should be compared with the visible price structure. If an indicator suggests an upward trend while price is repeatedly failing near resistance, that difference deserves attention rather than being ignored.
Use multiple timeframes carefully
Multi-timeframe trend assessment can help separate the larger market condition from shorter-term movement. For example, a higher timeframe may show a broad upward structure while a lower timeframe is in a temporary pullback. Those observations are not necessarily contradictory; they describe different parts of the same market.
Record the trend in simple terms before moving on. A note such as “higher timeframe upward, lower timeframe retracing” is more useful than a vague statement that the chart looks bullish. If the timeframes disagree, treat that disagreement as part of the analysis.
2. Review momentum separately
Momentum addresses the quality and force of price movement. It can help answer whether a move is accelerating, losing strength or moving sideways. This distinction matters because price can remain in an established trend while short-term momentum begins to weaken.
A momentum indicator for TradingView may highlight changes that are difficult to judge from candles alone. However, momentum should be read in context. A strong momentum reading during a breakout means something different from the same reading after an extended move into a known resistance area.
- Is momentum increasing in the same direction as the broader trend?
- Is momentum weakening while price continues to advance or decline?
- Does a momentum change occur near support, resistance or a structural level?
- Is the reading consistent across the timeframes being reviewed?
Momentum is best used as a condition or filter rather than as a standalone buy and sell instruction. A signal may identify a change in pressure, but it cannot remove the need to evaluate market structure, risk and the wider context.
3. Map market structure
Market structure describes how price develops through swings, breaks and reactions. Marking recent highs and lows can make a chart easier to interpret, especially when the market is moving between directional phases and consolidations.
A market structure indicator may help identify structural events, but traders should still understand what the event represents on the chart. A break above a prior high may indicate a change in short-term behavior, yet the quality of that break depends on factors such as location, follow-through and the surrounding trend.
Questions to ask about structure
- Which swing points are currently most important?
- Has price broken a prior high or low, or merely tested it?
- Did the break hold, or did price quickly return to the previous range?
- Where are support and resistance zones visible on the selected timeframe?
- Is the market trending, consolidating or transitioning between conditions?
It is also useful to distinguish a structural break from a temporary price spike. A single wick can show rejection or a liquidity event, but it does not always establish a lasting change in direction. Reviewing the candles that follow the event can provide more context.
4. Add smart money and institutional activity observations
Smart money concepts focus on how larger participants, liquidity and market structure may relate to price behavior. In a chart review, these observations can complement trend, momentum and structure analysis rather than replace them.
An institutional flow indicator or smart money indicator may present information about flow-related conditions, areas of interest or other market intelligence. The interpretation should remain measured. These observations can help a trader ask better questions, but they do not confirm future price movement or eliminate uncertainty.
The AKMelytics Smart Money Indicator is designed for TradingView and includes features related to trend analysis, momentum signals, market structure, institutional flow monitoring, multi-timeframe trend assessment and smart money analysis. Used as part of a review process, it can help bring several chart observations into one workspace while leaving the trader responsible for interpretation.
A repeatable TradingView chart review process
Once the four areas are understood, apply them in the same order each time. Consistency makes it easier to compare reviews and identify which observations are actually influencing a decision.
- Select the instrument and review timeframes. Decide which chart and timeframes are relevant before studying individual signals.
- Describe the broader trend. Note whether the higher timeframe is directional, ranging or transitioning.
- Mark important structure. Identify recent swing highs, swing lows, support, resistance and meaningful breaks.
- Assess momentum. Record whether momentum confirms, weakens or conflicts with the trend.
- Review smart money observations. Consider flow-related information, liquidity behavior and areas of interest shown by the available tools.
- Check for alignment. Look for agreement between the four categories, but also record conflicts.
- Write a neutral conclusion. Describe the current condition and what would need to change before further analysis.
This process can be completed with a short written checklist. The value comes from separating observations before combining them. For example, “uptrend” is a trend observation, “weakening momentum” is a momentum observation, and “price below prior resistance” is a structure observation. Keeping those statements distinct prevents one positive signal from hiding several areas of uncertainty.
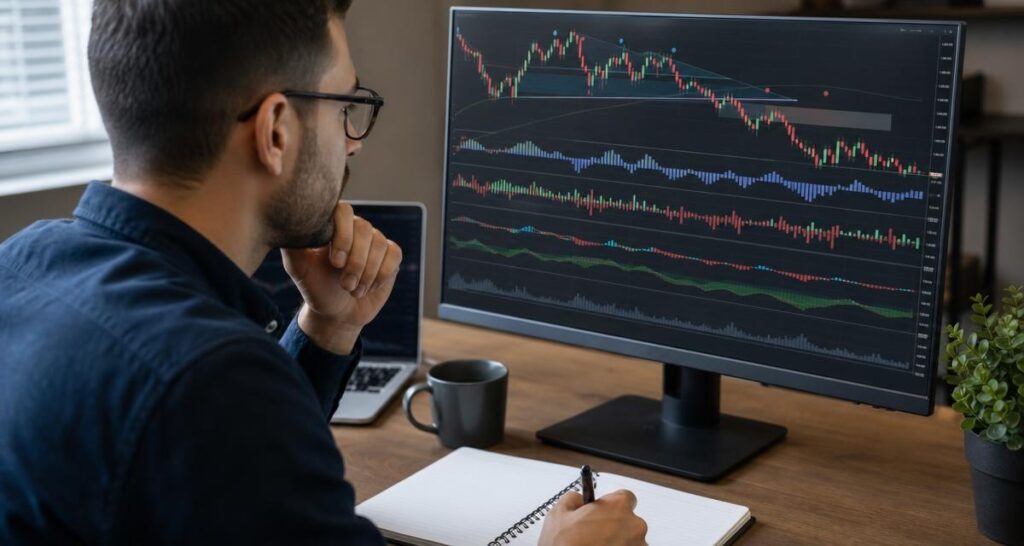
How to organize indicator information on a TradingView chart
Chart layout affects concentration. Too many overlapping indicators can make price difficult to see, while too few reference points may leave the review incomplete. Arrange tools according to the questions they answer.
- Price area: Keep candles, visible swing levels and support or resistance easy to read.
- Trend information: Use trend readings where they can be compared with the actual direction of price.
- Momentum panel: Place momentum information separately when possible so changes are not confused with structure.
- Market intelligence: Review smart money and flow-related observations alongside the price areas they describe.
Save separate layouts if different review styles require different levels of detail. A broad market review may need fewer annotations, while a detailed structural review may require more swing points and zones. The best layout is the one that supports clear thinking rather than displaying the greatest number of signals.
How to handle conflicting readings
Conflicting readings are normal. A chart may show a higher timeframe uptrend, weakening lower-timeframe momentum, a nearby resistance zone and mixed flow information. That combination should not be simplified into an automatic yes or no.
When signals disagree, identify the source of the conflict. It may come from different timeframes, a transition between trend and range conditions, or a price move that has already travelled a significant distance. Waiting for a clearer relationship between trend, momentum and structure may be more informative than adding another indicator.
A useful chart review does not require every tool to agree. It requires the trader to understand why the readings differ and to record the uncertainty clearly.
Separate observation from interpretation
One effective journaling method is to write two lines for each category. The first line states what the chart shows. The second explains what that observation could mean, without treating it as a prediction.
- Observation: Price remains above the latest higher low.
- Interpretation: The current structure has not yet invalidated the upward sequence.
- Observation: Momentum has weakened near a prior resistance area.
- Interpretation: The move may require confirmation before being treated as continued strength.
This distinction can reduce emotional reactions and make later review more objective. It also helps traders evaluate whether an indicator added useful context or merely repeated information already visible on the chart.
Common mistakes in stock technical analysis
Starting with a signal instead of context
Beginning with a buy or sell signal can lead to selective analysis. The trader may search for evidence that supports the signal while overlooking trend direction, nearby resistance or weakening momentum. Starting with context creates a more balanced review.
Using too many indicators
Several indicators may use similar price data and produce similar signals. Adding more tools does not necessarily create more information. If the chart becomes difficult to read, remove anything that does not answer a specific question.
Confusing a tool with a decision
A TradingView indicator can organize information, identify conditions or draw attention to areas for further study. It does not make the broader decision-making process unnecessary. Traders still need to define their own rules, account for uncertainty and manage risk independently.
Ignoring the timeframe
A signal on a short timeframe may conflict with a broader market structure. That conflict does not automatically make either reading wrong, but it does change its meaning. Always record the timeframe beside an observation.
Treating past signals as proof of future results
Historical chart behavior can be useful for learning how a tool presents information. It should not be treated as a guarantee of future performance. Market conditions change, and technical analysis remains an uncertain decision-support method.
Using the AKMelytics Smart Money Indicator in a review routine
Traders evaluating the AKMelytics Smart Money Indicator can begin by identifying which part of the review it supports. Trend analysis and multi-timeframe assessment can provide broader context. Momentum signals can help describe the strength of a move. Market structure features can draw attention to swings and breaks, while institutional flow and smart money analysis can add another layer of market observation.
A practical approach is to review the chart without drawing a conclusion first, then compare those observations with the indicator output. This makes it easier to judge whether the tool clarifies the chart, highlights an overlooked condition or creates an apparent conflict that needs further study. The indicator is intended to assist trading decisions and education, not to provide official financial advice or guarantee an outcome.
Build a simple chart review template
A written template makes the process easier to repeat. Keep it short enough to use consistently, but detailed enough to capture conflicts.
| Section | Notes to record |
|---|---|
| Instrument and timeframe | Chart reviewed and timeframes used |
| Trend | Higher-timeframe direction and lower-timeframe condition |
| Momentum | Strengthening, weakening or mixed readings |
| Structure | Key swings, breaks, retests, support and resistance |
| Smart money observations | Flow-related information, liquidity areas and indicator context |
| Conflicts | Readings that do not currently agree |
| Next review condition | What information would justify examining the chart again |
The final line is deliberately conditional. Rather than forcing a prediction, it defines what the trader wants to observe next. This can encourage patience and create a clearer record of how the chart developed over time.
Final considerations
Stock technical analysis is easier to apply when the chart review has a defined sequence. Start with trend, examine momentum, map market structure and then consider smart money and institutional activity observations. Use indicators to organize information and support research, not as substitutes for judgment or risk management.
For TradingView users, the AKMelytics Smart Money Indicator brings together features related to trend, momentum, structure, institutional flow and smart money analysis. Whether using that tool or another TradingView indicator, a consistent review template can make charts more readable and decisions more deliberate. The purpose is not to predict every move, but to understand the conditions shown on the chart before taking any further action.
Frequently asked questions
What is stock technical analysis?
Stock technical analysis is the study of price behavior, chart structure, momentum and related market information to evaluate current conditions. It can support research and decision-making but does not guarantee future results.
What should I review first on a TradingView chart?
Start with the broader trend and the relevant timeframes. Then examine market structure, momentum and smart money observations so that individual signals are interpreted in context.
How does momentum differ from trend?
Trend describes the broader direction of price, while momentum describes the strength or speed of the current movement. A market can remain in an established trend while short-term momentum weakens.
What does a market structure indicator show?
A market structure indicator may help identify swings, breaks, retests or changes in the way price is behaving. Its output should be compared with the visible chart and the timeframe being reviewed.
What is the AKMelytics Smart Money Indicator?
The AKMelytics Smart Money Indicator is a TradingView indicator offered by VP ALGO TRADING. Its features relate to trend analysis, momentum signals, market structure, institutional flow monitoring, multi-timeframe assessment and smart money analysis.
Can a smart money indicator predict market direction?
No indicator can remove market uncertainty or guarantee a direction. A smart money indicator can organize relevant observations and support further analysis, but traders must interpret the information independently.
How can I make my chart reviews more consistent?
Use the same sequence and a written template for each review: trend, momentum, market structure, smart money observations, conflicts and conditions to monitor next. This creates a clearer record without requiring every signal to agree.


Recent Comments