
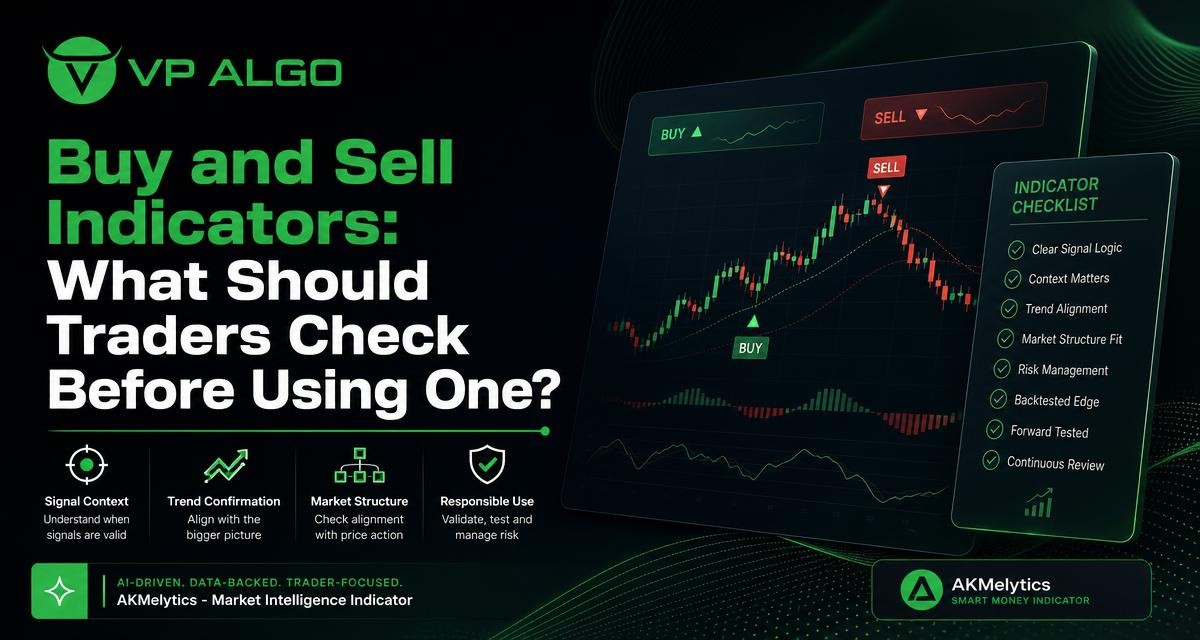
A buy and sell indicator can help traders organise market information, but a signal alone is not a complete trading decision. Before using one, examine how it defines potential entries, what market context it considers, whether its signals confirm the broader trend, and how it fits into your own risk and decision-making process. This framework can help you assess an indicator more carefully, including tools such as the AKMelytics – Market Intelligence Indicator from VP ALGO TRADING.
What does a buy and sell indicator actually do?
A buy and sell indicator is a charting tool that processes market data and presents possible areas of interest. Depending on its design, it may use price movement, momentum, trend conditions, market structure, volume-related information or other calculations to highlight a potential long or short setup. The output may appear as a label, marker, line, colour change or other visual element on a TradingView chart.
The important distinction is between highlighting a condition and making a decision. An indicator can draw attention to a market event, but it cannot know your account circumstances, risk tolerance, trading plan or response to a changing market. A useful tool should therefore be treated as part of a structured process rather than as an automatic answer to every chart question.
Signal generation is only one part of the evaluation
Some indicators focus mainly on entries. Others combine several analytical elements to provide a wider view of the market. A market intelligence tool may help a trader review trend direction, momentum, market structure, institutional activity and smart money conditions in one workflow. This broader context can be useful when a trader wants to understand why a signal appears rather than simply react to a coloured marker.
However, more features do not automatically make an indicator better. The real question is whether the information is clear enough to interpret consistently. If a tool shows too many conflicting readings, it may add confusion instead of improving chart analysis.
Check the market context behind every signal
The same buy or sell signal can mean different things in different market conditions. A signal that appears during a well-defined directional move may deserve a different review from one that appears while price is moving sideways between nearby support and resistance areas. Before acting on any output, ask what the wider chart is doing.
- Is the market trending, ranging or transitioning between conditions?
- Is price moving with strong momentum or drifting without clear follow-through?
- Is the signal appearing near a significant swing high, swing low, support area or resistance area?
- Does the higher timeframe support the direction shown on the current chart?
- Could the signal be reacting to a short-term fluctuation rather than a meaningful change in market structure?
This process helps prevent isolated signals from being taken out of context. It also gives traders a practical way to compare the indicator’s output with the price action they can already see on the chart.
Assess trend confirmation before using a signal
Trend confirmation is one of the first checks to make when evaluating a buy and sell indicator. A trader may use a trend indicator for TradingView to identify directional conditions, but the method should be understandable. For example, the tool may distinguish between upward, downward and uncertain conditions using its trend analysis. The trader still needs to decide what confirmation is sufficient for the intended setup.
Multi-timeframe analysis can add useful perspective. A shorter chart may show a temporary move against the direction visible on a higher timeframe. Neither view should automatically be ignored, but the conflict should be recognised. A trader who understands that the timeframes disagree may make a more deliberate choice than someone who sees only a single buy or sell label.
Questions to ask about trend confirmation
- Which timeframe is producing the signal?
- Does the higher timeframe show the same directional bias?
- Is the trend reading based on a confirmed condition or a developing move?
- Does the signal appear early, during continuation or after an extended move?
- What would invalidate the trend interpretation?
A good evaluation framework does not require every timeframe to agree perfectly. It requires the trader to understand the relationship between them and to avoid treating a lower-timeframe signal as independent from the broader chart.
Review momentum rather than relying on direction alone
Direction and momentum are related, but they are not identical. Price can be moving upward while momentum is weakening, or it can begin to accelerate after spending time in a narrow range. A momentum indicator for TradingView can help traders examine the strength and pace of a move alongside the buy or sell output.
Momentum information is most useful when it answers a specific question. Is the move gaining strength? Is the current push losing energy? Is a possible reversal supported by a meaningful change, or is it simply a brief counter-move? These questions are more practical than assuming that any momentum reading automatically confirms an entry.
When a signal and momentum reading disagree, that disagreement is information. It may suggest that the setup needs more confirmation, that the market is entering a transition, or that the indicator is responding to different parts of the available data. A trader can then decide whether to wait, investigate a different timeframe or reject the setup according to a predefined plan.
Understand market structure and price behaviour
Market structure provides a framework for interpreting how price forms successive highs and lows. It can help traders distinguish between continuation, a possible reversal and an unclear environment. A market structure indicator may identify structural events or make them easier to review, but the trader should still understand the underlying price behaviour.
Before treating a buy signal as meaningful, consider whether price has formed a structure that supports a bullish interpretation. For a sell signal, ask whether the market has shown evidence consistent with weakening or bearish structure. The exact rules will depend on the trader’s approach, but the principle is consistent: a marker should be examined alongside the sequence of price movements that surrounds it.
| Area to check | What to examine | Why it matters |
|---|---|---|
| Trend | Directional bias across the selected timeframes | Shows whether the signal agrees with the broader market condition |
| Momentum | Strength, acceleration or weakening of the current move | Helps distinguish active movement from a fading push |
| Market structure | Recent highs, lows, breaks and potential transitions | Places the signal within actual price behaviour |
| Signal context | Location, timing and surrounding chart conditions | Reduces the risk of reacting to an isolated label |
| Smart money analysis | Institutional activity or flow-related conditions shown by the tool | Adds another perspective without replacing independent review |
Consider what a smart money indicator can and cannot show
The phrase “smart money” is often used to describe analysis focused on institutional activity, liquidity, order flow concepts or the behaviour of larger market participants. A smart money indicator can organise related conditions on a chart and may help traders investigate whether price action appears consistent with those concepts.
That information should be interpreted carefully. An indicator does not provide direct certainty about the intentions of every institutional participant, and a smart money reading is not proof that a particular trade will work. Use it as one analytical layer alongside trend, momentum, market structure and the actual location of price.
For traders comparing tools, it is worth asking whether the smart money analysis is presented in a way that is understandable and actionable within their process. If the output cannot be explained in plain language, it may be difficult to use consistently or review after a trade.

Look for confirmation instead of collecting signals
Adding several indicators to a chart does not necessarily create stronger confirmation. If each tool measures a similar aspect of price movement, the chart may appear to offer multiple confirmations when it is really repeating one type of information. A better approach is to combine complementary questions.
- What is the prevailing trend on the relevant timeframe?
- Does current momentum support or contradict that direction?
- What does market structure suggest about continuation or transition?
- Is the signal appearing in a location that makes sense for the setup?
- What conditions would cause the setup to be rejected?
This kind of process is more useful than counting how many arrows, labels or coloured bars appear. A single well-understood tool that brings several relevant perspectives together may be easier to evaluate than a crowded chart made up of unrelated indicators.
Evaluate usability on TradingView
Technical capability is only part of a TradingView trading indicator’s value. A tool should also be practical to read during the type of analysis you perform. Review the chart display, terminology, alerts or visual markers available to you, and how quickly you can understand the information without overlooking important price details.
Before committing to regular use, consider testing the indicator across the chart conditions you normally study. Observe how it behaves during directional markets, sideways periods and sudden changes in momentum. The purpose is not to search for a perfect signal, but to learn what the tool is showing and where its interpretation becomes less clear.
VP ALGO TRADING offers the Delphi Intelligence Smart Money Indicator for TradingView, with features related to trend analysis, momentum signals, market structure, institutional flow monitoring, multi-timeframe trend assessment and smart money analysis. The business also identifies the AKMelytics – Market Intelligence Indicator as its service offering. Traders interested in using the tool can review its operation and contact the company for installation, activation or usage assistance. The website also offers a request-based seven-day free trial for its indicator and Telegram channel; eligibility and current terms should be confirmed directly.
Use testing to understand, not to promise results
Historical chart review can help a trader learn how an indicator behaves. You can examine where signals appeared, what the surrounding trend looked like and whether market structure or momentum supported the output. This type of review is educational and can reveal patterns in the tool’s behaviour.
It should not be treated as proof of future performance. Past observations do not guarantee future results, and an indicator does not eliminate losses or remove the need for independent judgment. If you test a tool, record the assumptions behind your review, including the timeframe, market conditions and rules used to interpret each signal. That makes the evaluation more honest and repeatable.
Build responsible rules around indicator outputs
A buy and sell indicator is easier to use responsibly when it sits inside a written plan. The plan should define what counts as confirmation, when a signal is ignored, how different timeframes are handled and what information is required before a decision is considered. It should also acknowledge that no indicator can predict every market movement.
- Do not enter solely because a visual marker appears.
- Define the market context that must be present before a signal is considered.
- Decide in advance how conflicting trend, momentum and structure readings will be handled.
- Use position and risk decisions appropriate to your own circumstances rather than copying someone else’s approach.
- Review decisions over time to identify whether you followed your process.
- Remember that indicator outputs are for educational and trading-decision assistance purposes, not financial advice.
Responsible use also means accepting that some signals will be wrong, late or unsuitable for the current market. The goal is not to force every output into a trade. The goal is to make the decision process more structured and easier to review.
How to decide whether an indicator fits your process
Before choosing a tool, write down the information you actually need from a chart. If your main difficulty is identifying direction, a clear trend view may be most useful. If you struggle to interpret reversals, market structure and momentum may deserve more attention. If you want to study institutional activity and smart money concepts, look for an indicator that explains those conditions rather than presenting unexplained signals.
Then assess whether the tool’s output matches your experience level and workflow. Beginners may benefit from clear definitions and a smaller number of understandable readings. More experienced traders may want multi-timeframe context and the ability to compare several analytical layers. In both cases, clarity is more valuable than a long list of features that cannot be incorporated into a consistent plan.
The AKMelytics – Market Intelligence Indicator is positioned for traders who want a structured view of trend, momentum, market structure, institutional activity and smart money conditions on TradingView. It may be worth reviewing if those are the areas you want to bring together, while keeping expectations realistic and making your own decisions about whether the tool fits your method.
Frequently asked questions
What is a buy and sell indicator?
It is a charting tool that highlights conditions which may be relevant to a potential buying or selling decision. The output should be reviewed with market context and a personal trading plan rather than followed automatically.
Can a buy and sell indicator guarantee profitable trades?
No. An indicator cannot guarantee profits, eliminate losses or predict future market movement. Past chart behaviour also does not guarantee future results.
What should I check before using a buy and sell indicator?
Check how it handles trend, momentum, market structure, signal timing and multi-timeframe context. Also make sure you understand the tool’s terminology and how its output fits your own rules.
What is a smart money indicator used for?
A smart money indicator may organise information related to institutional activity, flow or smart money concepts. It provides an analytical perspective, not certainty about the actions or intentions of market participants.
Is a TradingView indicator suitable for beginners?
It can be, provided the beginner understands what the readings mean and does not treat signals as automatic instructions. Start by learning the tool, reviewing chart context and using a clearly defined decision process.
What does the AKMelytics – Market Intelligence Indicator include?
The offering is associated with analysis of trend, momentum, market structure, institutional flow, multi-timeframe conditions and smart money concepts for TradingView. Contact VP ALGO TRADING for current product and usage details.
Does VP ALGO TRADING provide financial advice?
No. The company positions its indicators and trading software as tools for educational and trading-decision assistance, not as financial advice or personalised investment guidance.


Recent Comments