
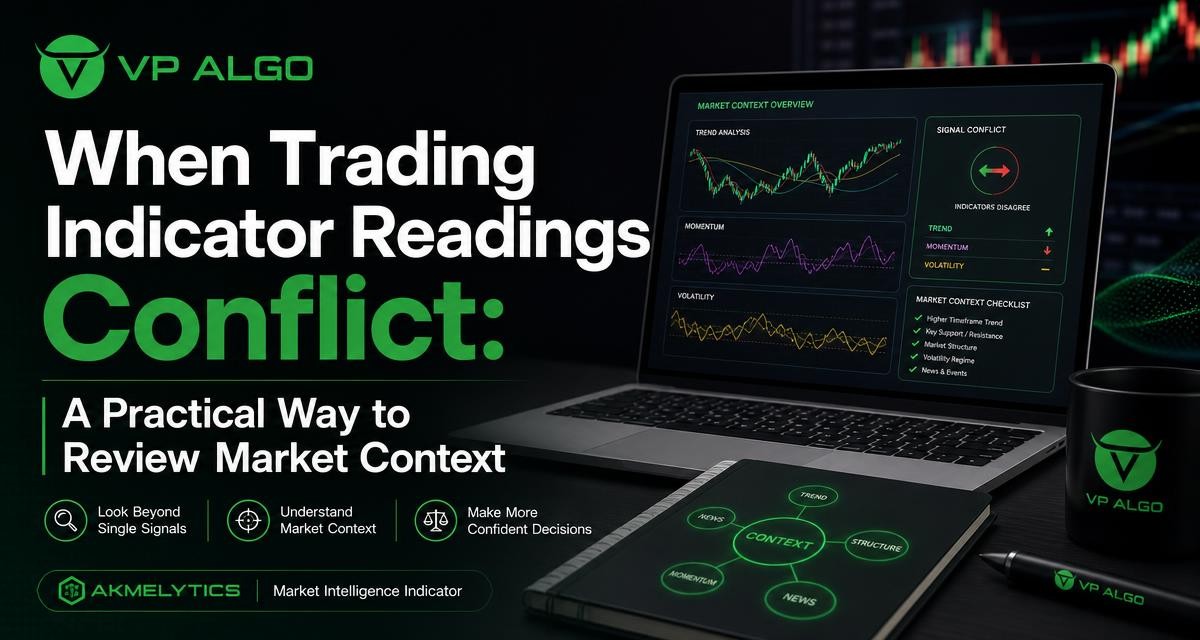
When a trading indicator gives a bullish reading while another suggests weakness, the disagreement is not automatically a problem with either tool. Different indicators examine different parts of price behaviour, and conflicting readings often show that the market is in a transition, moving sideways, or being viewed from mismatched timeframes. Instead of treating one signal as decisive, traders can review the broader market context and ask what each reading is actually measuring.
Why trading indicator readings can conflict
A trading indicator is a method of interpreting market data, not a complete description of market conditions. A trend-based tool may respond to the direction of recent price movement, while a momentum tool measures the speed or persistence of that movement. A market structure indicator may focus on swing highs, swing lows, breaks, and shifts in the way price is forming. These perspectives can disagree without being internally inconsistent.
For example, price may remain above a recent structure level while short-term momentum begins to weaken. In that situation, the broader trend may still be intact, but the immediate move may be losing strength. Similarly, a strong momentum reading can appear during a short price surge even when the wider market is moving sideways. The useful question is not simply which indicator is right. It is whether the readings describe the same market condition and the same timeframe.
Start by identifying what each tool measures
Before combining signals, write down the purpose of each trading indicator on the chart. This simple step helps prevent several tools from being treated as independent evidence when they are actually responding to similar price information.
| Reading or tool type | What it may help you review | Question to ask |
|---|---|---|
| Trend analysis | The prevailing direction and whether price is moving consistently | Is the market making a sustained directional move or only a short reaction? |
| Momentum analysis | The strength, speed, or persistence of recent movement | Is the current move gaining strength, slowing, or changing character? |
| Market structure | Swing points, structural breaks, and possible shifts in direction | Has price actually changed its sequence of highs and lows? |
| Institutional activity or flow analysis | Contextual clues related to larger market participation | Does the activity reading support or challenge the visible price behaviour? |
| Multi-timeframe assessment | Whether conditions align across selected chart periods | Is the short-term signal consistent with the broader chart context? |
The table is a framework for investigation, not a list of automatic rules. No single category should be assumed to produce a guaranteed outcome. The value comes from understanding how the readings fit together and recognising when the evidence is mixed.
Use market structure as the organising framework
When signals conflict, market structure can provide a useful reference point. Instead of beginning with a buy or sell label, review the sequence of meaningful highs and lows. Ask whether price is continuing an established pattern, testing an important area, or showing evidence of a possible structural change.
Continuation and temporary weakness
A market can maintain its broader direction while short-term momentum fades. A pullback, pause, or consolidation may cause a momentum indicator to weaken even though price has not invalidated the wider structure. In this case, the conflicting reading may be describing a temporary loss of speed rather than a confirmed reversal.
That distinction matters because traders often interpret any negative momentum change as a complete bearish signal. A more careful review separates the condition of the current move from the condition of the broader trend. If structure remains consistent, the reading may call for patience and closer observation rather than an immediate conclusion.
Possible structural change
Conflict deserves more attention when price begins to break a level or sequence that previously supported the trend. A weakening momentum reading combined with a meaningful change in market structure may provide a different context from momentum weakness alone. Even then, the event should be assessed according to the trader’s own timeframe and rules.
A market structure indicator can help make this review more systematic by highlighting relevant swings and potential structural events. It should not replace the trader’s judgement. Chart scale, selected timeframe, and the significance assigned to each swing can affect how the same price action is interpreted.
Check whether the timeframes agree
Many apparent conflicts are really timeframe conflicts. A short-term chart may show a bearish pullback while a broader chart continues to show an upward structure. Both readings can be valid because they answer different questions.
Before acting on a signal, record the timeframe that produced it and compare it with the timeframe used for the wider market view. A practical review might ask:
- What is the broader directional condition?
- Is the current move a continuation, pullback, consolidation, or possible reversal?
- Does the lower-timeframe signal oppose the larger structure or simply describe a temporary move within it?
- Would the conclusion change if the chart were viewed at a wider scale?
This process does not require every timeframe to agree. Markets frequently contain short-term movement against a broader direction. The goal is to know which timeframe is being used for context and which is being used to describe the immediate condition.
Separate signal, confirmation, and context
Another source of confusion is treating every chart label as a complete entry or exit instruction. A signal may identify a condition worth investigating, while confirmation may require a further price or structure event. Context explains whether the condition appears in a market where the signal has a clear meaning.
For instance, a momentum shift may be more informative after an extended directional move than in the middle of a narrow range. A structure break may require attention to whether the break is meaningful on the selected timeframe. A smart money indicator or institutional flow indicator may add another perspective, but it still needs to be considered alongside actual price behaviour and the trader’s defined process.
A simple three-layer review
- Signal: What has the trading indicator identified?
- Confirmation: Has price or structure provided evidence that supports the interpretation?
- Context: What is the broader trend, momentum condition, timeframe relationship, and market environment?
If only the first layer is present, the reading may be better treated as an observation than a complete trading conclusion. This does not make the indicator useless. It places the reading in the role it was designed to serve.

Look for disagreement between price and the indicator
Indicator disagreement can also occur when price and the indicator move in different directions. Price may continue to rise while momentum weakens, or price may decline while a momentum reading improves. Such divergence can be worth investigating, but it is not proof that a reversal will occur.
Review the size and quality of the price move, the location of relevant structure, and whether the divergence appears on a meaningful timeframe. A divergence that develops during a brief fluctuation may carry a different interpretation from one that persists while price tests a major swing area. Avoid turning divergence into a prediction without examining the rest of the chart.
Reduce false certainty with a written checklist
Conflicting readings can encourage impulsive decisions, especially when traders search for one final signal to remove all uncertainty. A written checklist creates a pause between seeing a chart event and assigning meaning to it.
- What is the market doing on the broader timeframe?
- Which reading is conflicting, and what does that tool measure?
- Is price trending, ranging, pulling back, or transitioning?
- Has market structure changed, or has only momentum changed?
- Are the indicators using comparable timeframes?
- What evidence would confirm or weaken the current interpretation?
- Is there enough alignment for the trader’s predefined process, or is waiting more appropriate?
The final question is particularly important. A framework should allow for uncertainty. If the evidence remains mixed, standing aside or waiting for more information can be a valid part of a disciplined process. An indicator should support structured analysis, not force a decision whenever its display changes.
How a multi-factor TradingView indicator can support review
Some traders prefer to examine trend, momentum, market structure, institutional activity, and smart money concepts through separate tools. Others prefer a multi-factor TradingView indicator that brings several categories into one analytical view. The main benefit of the latter approach is organisation: related readings can be reviewed together instead of scattered across multiple chart layouts.
VP ALGO TRADING offers the AKMelytics – Market Intelligence Indicator, described as a TradingView indicator with features related to trend analysis, momentum signals, market structure, institutional flow monitoring, multi-timeframe trend assessment, and smart money analysis. Used appropriately, such a tool can help traders investigate whether different parts of the market picture are aligned or in conflict.
It should still be treated as an aid for education and trading-decision assistance, not as financial advice or a guarantee of a particular outcome. Traders remain responsible for understanding the readings, defining their own rules, and considering the risks associated with their decisions. Product access and usage questions can be directed to the company’s support process.
Common mistakes when indicators disagree
Choosing the most convenient reading
It is easy to favour the signal that supports an existing opinion. A better approach is to document both sides of the conflict before deciding what the evidence means. If the bullish and bearish readings are both clear, the correct conclusion may be that the chart is unresolved.
Adding more indicators without a purpose
Adding another tool can increase the number of opinions without increasing clarity. Before using a new trading indicator, identify the specific gap it is meant to address. If two existing tools already measure similar momentum behaviour, a third may only repeat the same information.
Ignoring the chart’s time horizon
A signal on a short-term chart should not automatically override a broader structural view. Label each observation by timeframe and decide in advance how different timeframes will be prioritised in the analysis.
Expecting certainty from a technical reading
Technical tools organise evidence; they do not remove uncertainty. Reviewing market context is valuable precisely because a single reading cannot describe every condition affecting price.
A practical process for resolving conflicting readings
When a trading indicator conflicts with another signal, begin by pausing rather than immediately selecting a winner. Identify the purpose of each tool, confirm the timeframe of each reading, and review the broader structure. Then classify the market as directional, ranging, pulling back, or potentially changing character based on the evidence available to you.
Next, separate what is observed from what is inferred. “Momentum has weakened” is an observation. “Price must reverse” is an inference that requires additional support. This distinction makes chart reviews more precise and helps prevent indicator labels from becoming predictions.
Finally, record the conclusion and what would change it. A useful review might say that the broader structure remains intact, short-term momentum is weaker, and additional confirmation is needed. That statement is more actionable than simply calling the chart bullish or bearish because it explains the source of the uncertainty.
Frequently asked questions
What should I do when two trading indicators give opposite signals?
Identify what each indicator measures, compare their timeframes, and review the broader market structure. The conflict may reflect different aspects of the same market rather than an error.
Is a market structure indicator more important than a momentum indicator?
Neither is automatically more important. Market structure describes the organisation of price movement, while momentum describes the strength or speed of movement. Their roles are different and should be interpreted together.
Can conflicting readings signal a market reversal?
They can highlight a condition worth investigating, but conflict alone does not confirm a reversal. Look for supporting changes in price behaviour and structure on a relevant timeframe.
Why do indicators disagree across timeframes?
Each timeframe summarises a different portion of price movement. A short-term pullback can appear bearish while the broader chart remains structurally bullish, so both readings may be valid in context.
Should I add more indicators to resolve the disagreement?
Only if the additional tool has a clearly different purpose. More indicators can create more noise when they repeat information already shown by the existing tools.
Can a TradingView indicator make trading decisions for me?
A TradingView indicator can organise readings and support analysis, but it does not replace a trader’s judgement, risk process, or responsibility for decisions. It should not be treated as financial advice.
What is the main lesson when indicator readings conflict?
Do not treat one reading as decisive in isolation. Review trend, momentum, market structure, timeframe, and the wider context before forming a conclusion.


Recent Comments