
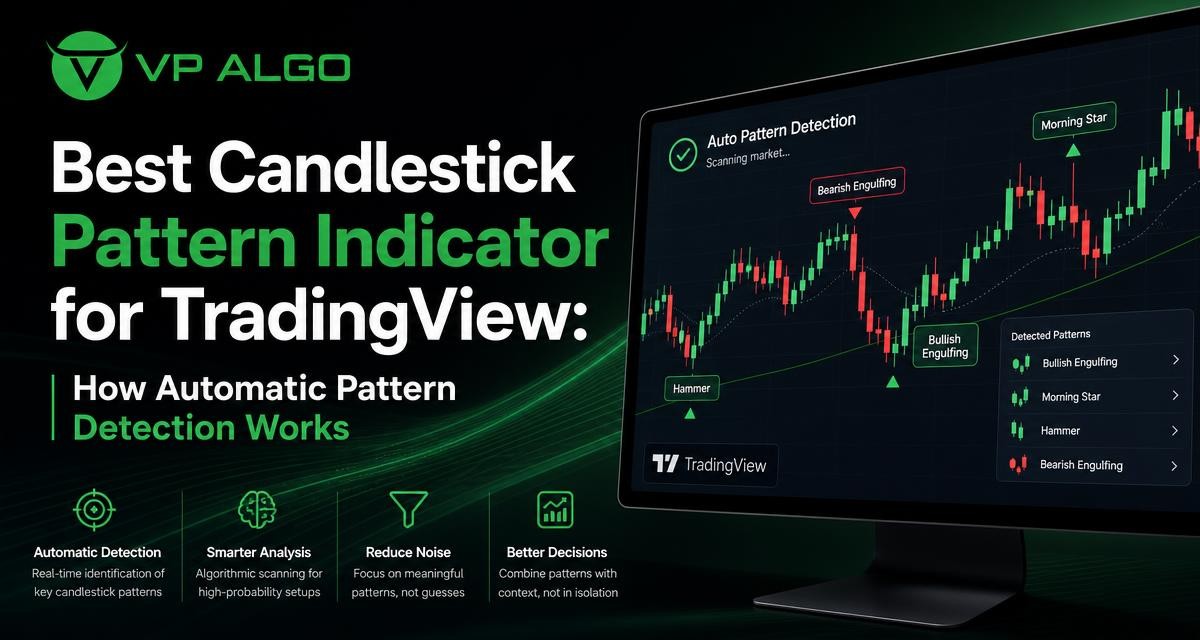
A candlestick pattern indicator for TradingView can scan price bars and mark formations such as engulfing candles, doji candles, hammers, and other commonly studied patterns. Its main value is reducing the need to inspect every candle manually. However, automatic detection is only the first step. A useful interpretation also considers the prevailing trend, momentum, market structure, volatility, and the location of the pattern on the chart.
What is a candlestick pattern indicator for TradingView?
A candlestick pattern indicator is a charting tool that examines the open, high, low, and close of each candle. It compares the shape and relationship of current candles with predefined rules, then displays a label, symbol, color, or alert when a formation is detected.
TradingView provides a visual environment in which these markings can be placed directly on a price chart. Depending on the indicator, a trader may be able to adjust which formations appear, change the visual design, or use alerts when a qualifying candle closes. The exact features vary between indicators, so the name alone does not tell you how reliable, configurable, or informative a tool will be.
What the indicator actually evaluates
Most candlestick detection is based on relationships rather than on a candle’s appearance in isolation. The indicator may evaluate the size of the real body, the length of the upper and lower wicks, the candle’s direction, and its position relative to recent candles. It may also compare a current candle with the previous one or two candles.
For example, a bullish engulfing formation generally involves a bullish candle whose body covers the body of the preceding bearish candle. A doji is usually identified when the open and close are close together. A hammer-like formation typically has a relatively small body and a longer lower wick. These descriptions are simplified; individual scripts may use different thresholds and definitions.
How automatic candlestick detection works
Automatic detection usually follows a sequence of rule-based checks. Understanding this process helps traders interpret labels without assuming that every marked formation has the same meaning in every market condition.
1. The indicator reads the candle data
Each chart candle contains four core price points: open, high, low, and close. From these values, an indicator can calculate the real body, upper wick, lower wick, total range, and whether the candle closed higher or lower than it opened.
The calculations are applied to the selected chart timeframe. A formation detected on a five-minute chart is not necessarily visible in the same way on an hourly chart because the candles are built from different price data.
2. It applies pattern definitions
The script then checks whether the candle or group of candles meets the conditions assigned to a pattern. A two-candle pattern may require a particular relationship between consecutive bodies. A three-candle pattern may require a sequence of directions and a specific placement of each candle.
Some definitions use fixed relationships, while others use proportions. For instance, a rule may compare wick length with body length instead of requiring a single absolute number of points. This allows the same general pattern to be recognized on instruments with different price scales, although the settings still affect the result.
3. It places a visual marker
When the conditions are met, the indicator can place text above or below the relevant candle. The label may identify the pattern by name, use a short abbreviation, or display a colored marker. Clear labeling matters because a crowded chart can make it difficult to distinguish meaningful information from visual noise.
4. It may trigger an alert
Some indicators can be used with TradingView alerts when a pattern is detected or when a candle closes with the required formation. An alert can help with monitoring, but it does not replace chart review. A notification tells you that a rule was met; it does not establish the quality of the setup or determine whether a trade is appropriate.
Common candlestick patterns an indicator may identify
The available pattern list depends on the script, but many indicators focus on formations that traders commonly study in technical analysis.
| Pattern type | Typical visual idea | What still needs to be examined |
|---|---|---|
| Doji | The open and close are close together compared with the candle range. | Whether the candle appears at a meaningful support, resistance, or trend location. |
| Engulfing pattern | A candle body covers the body of the preceding candle. | The direction of the broader trend and whether follow-through occurs. |
| Hammer or shooting star | A small body with a prominent wick on one side. | Whether the wick shows rejection at a relevant price area. |
| Inside bar | A candle forms within the range of the previous candle. | Whether the market is consolidating and how a later breakout develops. |
| Morning or evening star | A multi-candle sequence that may suggest a change in short-term pressure. | Volume, trend strength, market structure, and confirmation after the sequence. |
| Harami | A smaller candle forms within the previous candle’s body. | Whether the pattern represents a pause or a genuine change in momentum. |
These names describe formations, not guaranteed outcomes. The same pattern can appear during a strong trend, a range, or a period of erratic price movement. Its interpretation changes with the surrounding chart.
Why a detected pattern is not a standalone signal
A candlestick formation describes what price has just done. It does not, by itself, explain why price moved, whether the move will continue, or whether the current location offers a sensible trading opportunity. Treating every label as an automatic buy or sell instruction can lead to repeated entries in low-quality conditions.
Context helps separate a potentially useful observation from a routine candle shape. A bullish formation after a prolonged decline may deserve a different reading from the same formation in the middle of a sideways range. Likewise, a bearish pattern near a well-defined resistance area may be more relevant than one that appears far from any visible structure.
Trend context
Start by asking whether the market is making broadly higher highs and higher lows, lower highs and lower lows, or moving sideways. A pattern that agrees with the larger trend may be used as a point for further investigation. A pattern that contradicts the trend may represent a reversal attempt, but it requires stronger evidence than a simple label.
Multi-timeframe review can add perspective. A formation on a lower timeframe may occur inside a larger bullish or bearish structure. Looking at more than one timeframe can help prevent a small candle formation from dominating the entire analysis.
Momentum
Momentum describes the strength and persistence of recent price movement. If a bullish candlestick pattern appears while upward pressure is weakening, the formation may need more confirmation. If it appears alongside sustained momentum, it may provide a clearer continuation context, although it still does not guarantee a result.
Momentum should be evaluated using a consistent method rather than by relying on the pattern name. Traders may examine the speed of recent moves, the size of successive candles, or a separate momentum tool. The goal is to understand whether the candle is supported by broader price behavior.
Market structure and key levels
Market structure includes swing highs, swing lows, breakouts, pullbacks, and areas where price has previously reacted. A candle formation near a meaningful structural level may carry more analytical importance than an identical formation in open space.
For example, an apparent rejection candle close to a prior swing level may be worth reviewing for confirmation. The same shape in the middle of a broad range may simply reflect normal short-term fluctuation. Structure does not make a setup certain; it provides the location needed for a more informed interpretation.
Volatility and trading conditions
Candle proportions can change significantly when volatility expands or contracts. A long wick in a volatile session may not have the same significance as a long wick during a quiet period. Indicators that use rigid thresholds can also produce different numbers of labels as market conditions change.
Consider whether the pattern is appearing during a news-driven move, a narrow consolidation, or an orderly trend. The indicator can identify the shape, but the trader must judge whether the surrounding conditions make that shape relevant.
What to evaluate when choosing an indicator
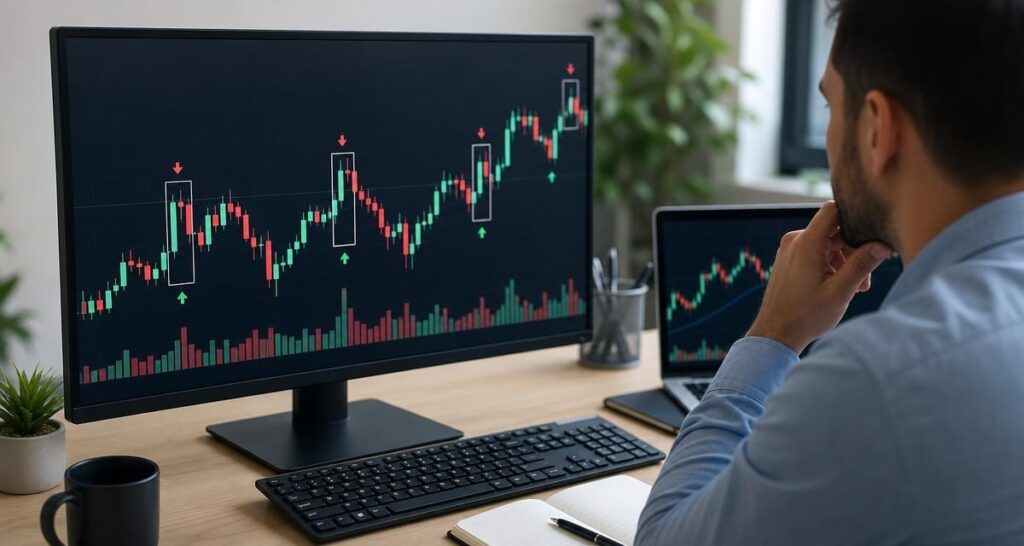
The best candlestick pattern indicator for TradingView is not necessarily the one with the longest list of formations. A practical tool should help you read the chart more consistently without creating unnecessary distractions.
Pattern definitions and transparency
Look for an explanation of how the indicator defines each formation. If a tool labels a candle but does not explain the underlying conditions, it becomes harder to test or apply consistently. Clear definitions also help you understand why two indicators may mark different candles as the same pattern.
Closed-candle behavior
Find out whether markings appear only after a candle closes or whether they can change while the candle is still forming. An unfinished candle can change its body and wick several times before the close. A label that appears intrabar may disappear later if the final candle no longer meets the rule.
This distinction is especially important when reviewing historical charts. A trader should know whether a historical label reflects information that was available at the time or whether it was added or changed after later price data became available.
Repainting and historical consistency
Repainting refers broadly to signals or markings that change after their initial appearance. Not every change has the same cause, and the term should be examined carefully. Some indicators update because the current candle is still open; others use later bars or calculations that can alter historical displays.
Ask whether the indicator documents its behavior, whether alerts are based on confirmed candles, and whether the visual history remains consistent when you reload the chart. This does not turn an indicator into a forecasting tool, but it makes the information easier to evaluate honestly.
Customization and chart readability
Useful settings may include selecting specific pattern groups, changing label placement, adjusting colors, or limiting alerts. Customization should improve decision-making rather than encourage constant changes until the chart appears to support a preferred idea.
Readability is also important. If every candle receives a label, the indicator may hide the structure you actually need to see. A smaller set of well-understood patterns is often easier to review than a crowded display.
Alerts and workflow compatibility
If you monitor several charts, alerts can help identify when a formation deserves attention. Check what event creates the alert, whether it occurs during the candle or after confirmation, and whether the alert message identifies the relevant pattern and timeframe.
Alerts should fit into a written process. A sensible workflow might be to receive the notification, review the higher-timeframe trend, inspect structure and momentum, and then decide whether the chart meets your own rules. The alert is a prompt for analysis, not the analysis itself.
How to use automatic detection in a structured process
- Choose the market and timeframe. Keep the chart settings clear so you know exactly which candles the indicator is analyzing.
- Review the larger trend. Identify whether price is trending upward, trending downward, or ranging.
- Locate the detected pattern. Check whether it is near a swing point, support, resistance, breakout area, or consolidation.
- Assess momentum and volatility. Decide whether recent price behavior supports the interpretation or makes the candle less meaningful.
- Wait for confirmation when required by your method. Confirmation might involve a later close, a structural change, or a failure of price to invalidate the formation.
- Define risk before acting. A pattern label should not replace position sizing, invalidation rules, or a plan for managing an unsuccessful idea.
- Record the observation. A journal can show which patterns and market conditions are useful for your own process rather than relying on memory.
This process keeps the indicator in its proper role: a tool for organizing observations. It does not promise a particular market outcome, and it should not be presented as a substitute for independent analysis.
Combining candlestick detection with broader TradingView tools
Candlestick patterns become more informative when they are viewed alongside other forms of chart analysis. A trend indicator can help describe directional conditions, while a momentum indicator can show whether recent movement is strengthening or weakening. A market structure indicator can help highlight swings, breaks, and areas that deserve closer attention.
Smart money concepts and institutional activity tools may provide another layer of market interpretation, but they should also be treated as analytical aids rather than automatic instructions. VP ALGO TRADING develops TradingView indicators such as the Delphi Intelligence Smart Money Indicator, which is positioned around trend analysis, momentum evaluation, market structure, institutional activity, multi-timeframe assessment, and smart money analysis. That broader context can complement a candlestick-focused review, but it does not make any individual pattern certain.
When combining tools, avoid giving every indicator equal authority. Decide in advance what each tool contributes. For example, one may describe trend, another may identify structure, and the candlestick indicator may highlight a possible timing area. If several tools repeat the same information, adding more labels may increase complexity without improving the decision process.
Common mistakes with candlestick pattern indicators
Using every label as a trade signal
Automatic detection can create the impression that every marked candle deserves action. In practice, many formations occur during ordinary market noise. Use the label to begin a review, not to skip one.
Ignoring the candle close
A pattern may look complete before the candle closes and then change shape. Checking confirmed candles can make historical review and live decision-making more consistent.
Overfitting settings
Changing thresholds repeatedly can make a past chart look cleaner while reducing confidence that the same settings will remain useful in different conditions. Document changes and evaluate them across varied examples instead of selecting settings from a small number of attractive charts.
Confusing a pattern with a forecast
A candlestick formation summarizes a recent arrangement of price. It does not provide certainty about the next candle, the next session, or a broader market move. Responsible use includes acknowledging uncertainty and planning for invalidation.
Final considerations
A candlestick pattern indicator for TradingView can save time by identifying recurring candle formations and presenting them consistently. Its usefulness depends on more than the number of patterns it recognizes. Definitions, closed-candle behavior, repainting characteristics, alert logic, readability, and compatibility with a wider analysis process all matter.
The strongest approach is to combine automatic detection with trend analysis, momentum, market structure, volatility awareness, and clearly defined risk rules. VP ALGO TRADING’s TradingView tools are intended to support educational analysis and trading-decision assistance, not to provide financial advice or guarantee results. Before relying on any indicator, learn how it calculates its markings and test how it fits your own method.
Frequently asked questions
What does a candlestick pattern indicator do?
It examines candle data and marks formations that match predefined rules. The markings can help traders find patterns more efficiently, but they do not determine whether a trade will succeed.
Are candlestick pattern indicators accurate?
Accuracy depends on the pattern definitions, settings, market conditions, and how the results are evaluated. A detected formation is an observation, not a guaranteed forecast.
Does a candlestick pattern indicator repaint?
Some indicators can change markings while a candle is still forming or when their calculations use later data. Check the indicator’s documentation and determine whether alerts are based on confirmed candle closes.
Which candlestick patterns should beginners study first?
Beginners may start with a small group such as doji, engulfing patterns, hammer-like candles, shooting stars, and inside bars. Learning their context is more useful than memorizing a long list of names.
Can candlestick patterns be used without other indicators?
They can be studied on their own, but broader context often improves interpretation. Trend, momentum, market structure, support and resistance, and volatility can help explain whether a formation is significant.
How should I use alerts for detected patterns?
Use an alert as a prompt to inspect the chart. Confirm the candle status, review the larger trend and structure, and apply your own trading and risk rules before considering any action.
Is a TradingView candlestick indicator financial advice?
No. An indicator is a software tool for chart analysis. It does not replace independent research, personal risk assessment, or advice from a qualified financial professional.


Recent Comments