
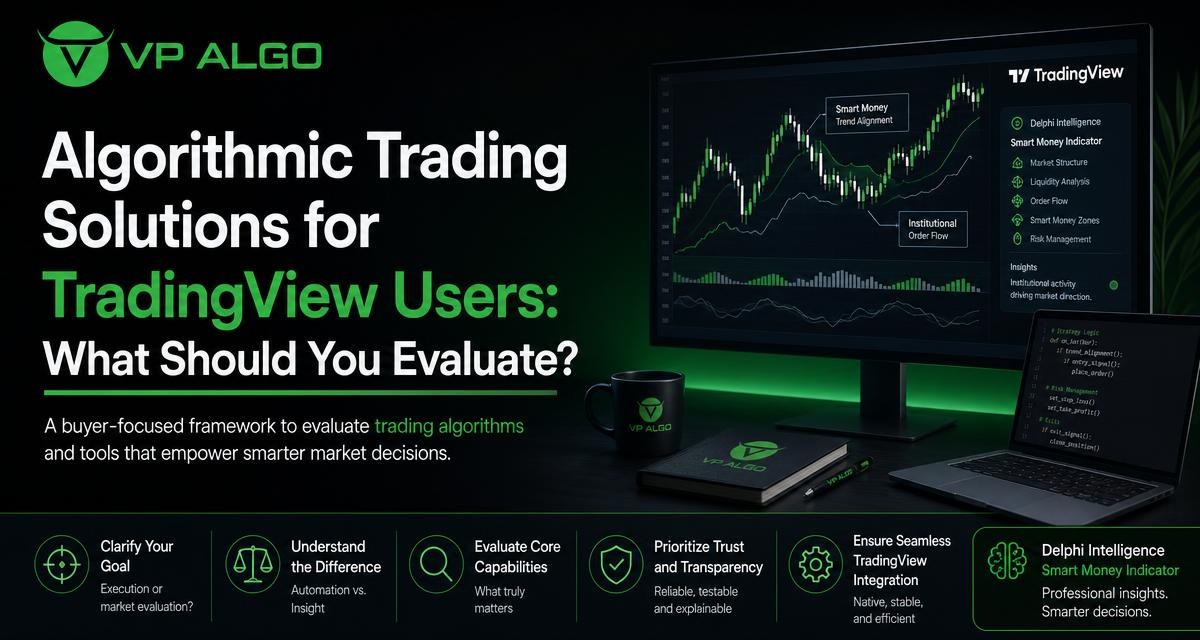
Algorithmic trading solutions can mean very different things to TradingView users. Some tools automate order execution, while others analyse price behaviour and present structured information for a trader to interpret. Understanding that distinction is the first step in evaluating whether a TradingView tool fits your process. A product such as the Delphi Intelligence Smart Money Indicator is designed to support market evaluation through trend analysis, momentum, market structure, institutional activity and smart money concepts rather than replace the trader’s judgement.
What do algorithmic trading solutions actually provide?
The term algorithmic trading solutions is broad. In one context, it refers to software that follows programmed rules and sends orders automatically. In another, it describes indicators and analytical tools that process market information and make patterns easier to review. Both categories can involve algorithms, but they serve different purposes.
A TradingView indicator generally belongs to the second category. It may calculate or organise data, identify changes in trend, display momentum signals, map market structure or highlight conditions associated with institutional activity. The trader then decides how to interpret those observations and whether they fit a broader trading plan. This is different from a trading bot that independently manages entries, exits and orders.
| Type of tool | Primary function | What the user still needs to evaluate |
|---|---|---|
| Analytical indicator | Processes market information and displays conditions or signals | Context, confirmation, risk, timing and whether the signal fits the trading plan |
| Rule-based strategy | Applies a defined set of conditions to identify possible trade scenarios | Rules, assumptions, market context and how results should be interpreted |
| Automated execution system | Can connect programmed logic to order execution, where supported | Execution controls, broker or exchange compatibility, risk settings and monitoring |
This distinction matters because an indicator may be valuable without being an automated execution system. Traders looking for a clearer way to study a chart should assess the quality and usefulness of the analysis rather than assume that every algorithmic product places trades automatically.
Start with the problem the TradingView tool should solve
Before comparing features, define the difficulty in your current process. A trader may struggle to identify the prevailing trend, distinguish a pullback from a reversal, understand a change in market structure or keep several timeframes aligned. Another trader may already have a clear analytical process but want a more organised view of momentum and smart money conditions.
A useful product should address a specific need without creating unnecessary complexity. For example, a tool that combines trend, momentum and market structure may help a user review several dimensions of price behaviour in one workspace. It does not remove the need for preparation or risk management, but it can make the evaluation process more structured.
Questions to ask before choosing a solution
- Am I looking for chart analysis, automated execution or both?
- Which part of my current process is inconsistent or difficult to review?
- Do I need a single-timeframe view or multi-timeframe context?
- Can I explain what each displayed signal or condition means?
- Will the tool support my existing method, or encourage decisions I cannot clearly justify?
Evaluate the core analytical features
Feature lists are useful only when they explain how a tool may fit into real chart analysis. The Delphi Intelligence Smart Money Indicator includes features related to trend analysis, momentum signals, market structure, institutional flow monitoring, multi-timeframe trend assessment and smart money analysis. A buyer should consider how these elements work together rather than judge the product by the number of labels or signals on the chart.
Trend analysis
A trend component can help a trader establish an initial directional view. It may be used to ask whether price is showing a sustained directional pattern, moving within a range or transitioning between conditions. This is a starting point, not a complete trading decision. A trend reading should be considered alongside timeframe, recent price behaviour and the trader’s own entry and risk rules.
When reviewing a trend indicator for TradingView, look for clarity. If the display is difficult to read or produces too many competing messages, it may add visual noise instead of improving analysis. The most useful presentation is one that helps the user understand the current condition and the reason it is relevant.
Momentum signals
Momentum analysis focuses on the strength or persistence of a price move. It can help a trader consider whether a move has supporting energy, is losing strength or is developing after a period of consolidation. Momentum should not be treated as proof that price will continue in the same direction. It is one piece of context that may support or challenge a market view.
When assessing a momentum indicator for TradingView, consider whether it complements trend and structure analysis. A momentum reading that is disconnected from the broader chart may be less useful than one that helps explain why a move deserves attention.
Market structure
Market structure provides a framework for studying swing points, directional changes and the way price develops over time. A market structure indicator can help traders organise questions such as whether a recent move confirms continuation, signals a possible shift or remains inside a broader range.
Structure-based tools still require interpretation. The same chart may look different depending on the timeframe and the importance assigned to recent versus older swing points. Buyers should therefore look for a tool that presents structure in a way they can understand and apply consistently, rather than relying on unexplained markings.
Institutional activity and smart money concepts
Smart money analysis and institutional flow monitoring are often used to examine areas of market activity that may be relevant to larger participants. In practice, these concepts should be approached as analytical frameworks, not as a promise that a tool can reveal every institutional decision or predict the next move.
A smart money indicator for TradingView may help users organise observations around liquidity, structure or notable activity, depending on the features provided. The important evaluation point is whether the information improves the user’s chart review and can be combined with a defined decision process. No indicator eliminates uncertainty, and no displayed condition should be treated as guaranteed confirmation.
Why multi-timeframe analysis deserves attention
A setup that appears attractive on one timeframe may look less convincing when viewed against a broader trend. Multi-timeframe trend assessment helps traders compare short-term movement with higher-timeframe conditions. This can be useful when a lower-timeframe signal is actually a retracement within a larger move, or when a short-term change conflicts with the broader market structure.
When evaluating this feature, ask how the information is presented. A practical tool should make timeframe relationships easier to review, not force the user to interpret an overcrowded display. It is also important to understand which timeframe is being assessed and how quickly the displayed condition may change as new price data appears.
| Evaluation area | What to look for | Practical question |
|---|---|---|
| Trend context | A clear view of directional conditions across relevant timeframes | Does the short-term view agree with or oppose the broader trend? |
| Momentum | Information that helps assess strength or weakening movement | Is momentum supporting the current structure, or showing hesitation? |
| Market structure | Understandable swing and transition information | What changed, and on which timeframe did it change? |
| Smart money conditions | Organised context for activity and liquidity-related observations | Does this add useful context or simply add more chart labels? |
| Usability | Readable charts and settings that can be understood | Can I use the tool consistently without guessing what it shows? |
Indicator support is not the same as automated execution
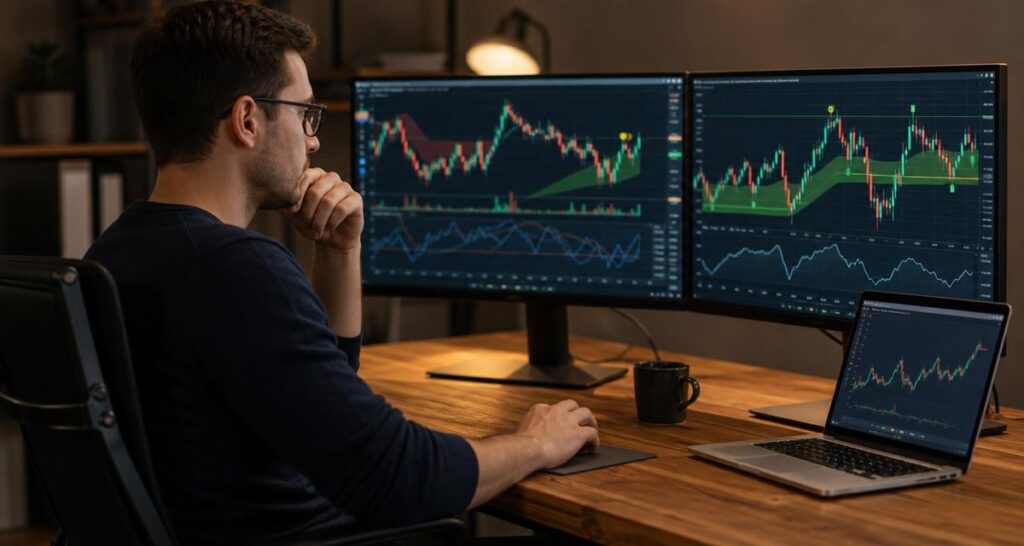
This is one of the most important distinctions for buyers. An analytical indicator supports a trader’s evaluation of the market. Automated execution follows programmed rules to place or manage orders. A TradingView indicator may be suitable for the first purpose without providing the second.
If your goal is fully automated trading, you need to investigate capabilities that are separate from visual analysis. These may include rule definition, order routing, broker or exchange compatibility, execution controls, position sizing and monitoring. Those details should never be assumed from the presence of the word “algorithmic” in a product description.
If your goal is to improve discretionary analysis, an indicator can still be a useful algorithmic trading solution. Its value may come from organising several analytical perspectives and helping you apply the same review process across charts. The trader remains responsible for interpreting the information and making decisions consistent with their own plan.
Assess clarity, learning requirements and day-to-day usability
A technically sophisticated tool is not automatically a practical one. New users need to understand the terminology, while experienced traders need to see how the indicator fits with their existing workflow. Before committing to a product, review its instructions, visual layout and available support resources.
VP ALGO TRADING provides the Delphi Intelligence Smart Money Indicator for TradingView and states that customers can contact support for installation, activation or usage assistance. After purchase, customers are instructed to provide their TradingView ID by email for product access. These practical steps should be part of the buying decision because access and setup affect how quickly a trader can begin evaluating the tool.
Signs that a tool may be easier to adopt
- The main features are explained in language a trader can understand.
- The chart display separates important conditions from secondary information.
- The product makes clear whether it is an indicator, a strategy or an execution tool.
- Installation and activation instructions are available.
- Users can ask for assistance with setup or usage when needed.
- The tool can be tested or reviewed without assuming that its signals guarantee a result.
The company offers a request-based 7-day free trial for its indicator and Telegram channel. Trial access should be used to learn the interface and assess whether the information is useful in your own review process, rather than to judge a tool by a small number of chart outcomes.
Use a disciplined evaluation process
Comparing algorithmic trading solutions becomes easier when every product is reviewed against the same criteria. Start by writing down the market questions you need to answer. Then observe whether the tool helps you answer them with less confusion and greater consistency.
- Define the intended use. Decide whether you want chart analysis, trade planning support, automated execution or a combination of clearly separate tools.
- Review the feature scope. Check whether trend, momentum, structure, institutional activity and multi-timeframe analysis match your needs.
- Learn the terminology. Do not use a signal you cannot explain. Understand what each display is intended to represent.
- Examine chart usability. Look for readable visuals, sensible organisation and settings that do not overwhelm the main analysis.
- Test it against your process. Compare the tool with your existing review routine across different market conditions, without treating individual outcomes as proof.
- Check access and support. Confirm how activation works, what information is required and where to ask for installation or usage help.
- Set realistic expectations. Use the indicator as decision assistance and educational support, not as a guarantee of profitable results.
This process also helps prevent a common mistake: choosing a product because it displays many signals. More information is not always better information. The strongest fit is usually the tool that helps you make your own analysis more organised and repeatable.
What algorithmic trading solutions cannot do for you
Even a well-designed indicator cannot remove market uncertainty. It cannot guarantee that a trend will continue, that momentum will persist or that a smart money condition will lead to a particular outcome. It also cannot decide whether a potential setup fits your account, tolerance for loss, schedule or broader plan.
Trading tools should therefore be treated as aids to analysis. They can help structure observations, but they do not replace risk management, education or personal responsibility. VP ALGO TRADING positions its indicators for educational and trading-decision assistance purposes rather than as financial advice.
A useful TradingView indicator should make your reasoning clearer, not encourage you to stop reasoning.
Is the Delphi Intelligence Smart Money Indicator worth evaluating?
For TradingView users who want a structured way to review several market dimensions, the Delphi Intelligence Smart Money Indicator is relevant to consider. Its stated feature set covers trend analysis, momentum signals, market structure, institutional flow monitoring, multi-timeframe trend assessment and smart money analysis.
Its suitability depends on your objective. If you want an analytical tool that supports discretionary chart evaluation, these features may align with your workflow. If you are specifically looking for an automated execution system, you should confirm the product’s role rather than assume that an indicator performs that function. The right buying decision comes from matching the tool to the problem you want to solve and understanding its limitations before use.
Frequently asked questions
Are all algorithmic trading solutions automated?
No. Some solutions automate order execution, while others use algorithms to analyse market information and display conditions on a chart. A TradingView indicator generally supports analysis rather than independently placing trades.
What does the Delphi Intelligence Smart Money Indicator analyse?
The indicator includes features related to trend analysis, momentum signals, market structure, institutional activity, multi-timeframe trend assessment and smart money concepts.
Can a smart money indicator guarantee profitable trades?
No. An indicator cannot guarantee profits or eliminate trading losses. Its information should be interpreted as analytical and educational support within the trader’s own process.
Is this indicator suitable for beginners?
It may be useful for beginners who are learning to organise market analysis, but users should first understand the displayed concepts and avoid relying on unexplained signals. Support is available for installation, activation or usage assistance.
How can I evaluate a TradingView indicator before buying?
Define your analytical needs, review the feature set, study the chart presentation, understand the terminology and use any available trial or product guidance to assess whether it fits your process.
Does the indicator provide financial advice?
No. VP ALGO TRADING positions its indicators as tools for educational and trading-decision assistance, not as financial advice or personalised investment guidance.
What should I check if I want automated execution?
Confirm whether the product supports execution at all, then investigate its rules, order routing, broker or exchange compatibility, controls and monitoring requirements. Do not infer these capabilities from an indicator’s analytical features.


Recent Comments