
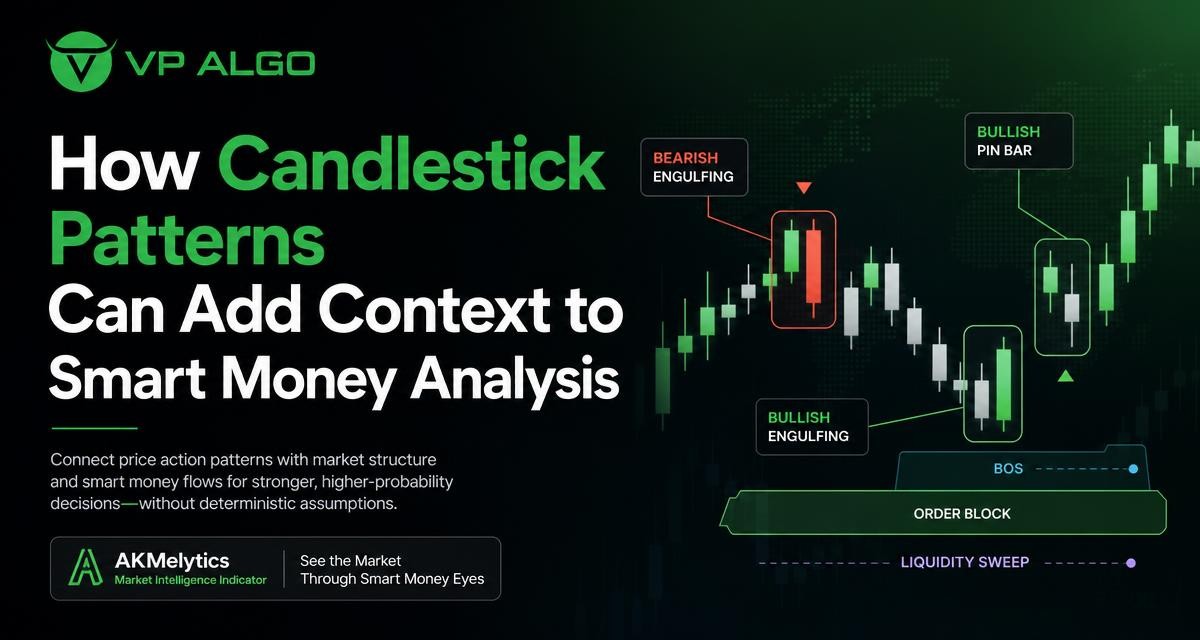
Candlestick patterns can help traders read the details behind a price move, but they are most useful when viewed alongside market structure, momentum and broader smart money analysis. A single candle rarely explains the whole market. Its location, size, follow-through and relationship with nearby highs and lows often matter more than its name.
Why candlestick patterns need context
A candlestick shows the open, high, low and close for a selected period. This information describes how price behaved during that period, including whether buyers or sellers controlled the close and whether the market rejected a particular area. Patterns such as pin bars, engulfing candles, doji formations and inside bars give traders a simple visual language for these observations.
However, the same pattern can have very different meanings in different conditions. A bullish-looking rejection candle near an established support area may suggest that sellers struggled to push price lower. The same shape in the middle of a strong downward move may simply be a temporary pause. Treating every familiar formation as an independent signal can remove the context that gives price action its meaning.
| Price-action observation | What it may show | Context to examine |
|---|---|---|
| Long upper wick | Rejection of higher prices during the candle | Nearby resistance, trend direction and the next candle |
| Long lower wick | Rejection of lower prices during the candle | Support, liquidity areas and broader selling pressure |
| Engulfing candle | A strong change in short-term participation or momentum | Where it formed and whether follow-through appears |
| Small real body | Temporary balance or indecision | Consolidation, volatility and the candles that follow |
What smart money analysis adds
Smart money analysis is commonly used as a framework for examining market structure, liquidity, institutional activity and the way price moves through important areas. It does not provide certainty about who placed every order or guarantee what price will do next. Instead, it encourages traders to study the relationship between price, structure and participation.
Market structure may include swing highs, swing lows, breakouts, pullbacks and changes in the direction of movement. Liquidity concepts focus attention on areas where orders may be concentrated, while momentum analysis considers the strength and persistence of a move. A smart money indicator can help organize some of these observations on a chart, but the output still requires interpretation and risk control.
Structure defines the broader situation
Before interpreting a candle, traders can ask whether the chart is making higher highs and higher lows, lower highs and lower lows, or moving sideways. This first assessment creates a working bias without assuming that the trend must continue. A bullish candle in a rising structure is not automatically a trade opportunity, but it may deserve more attention than the same candle during a weak, declining structure.
Liquidity gives the candle a location
Many candlestick patterns become more informative when they appear near a previous swing, a consolidation boundary or another level that has attracted repeated attention. A wick that briefly moves beyond a visible high or low may show rejection, but traders should wait to see whether price holds back inside the range or continues beyond it. The location helps frame the observation; it does not confirm an outcome by itself.
Momentum helps assess follow-through
A pattern can look convincing at the close and still fail if the next candles show little participation. Conversely, a modest-looking candle may be part of a sustained move when momentum is building. Reviewing candle range, closing position and subsequent price action can help distinguish a meaningful change in pressure from a short-lived fluctuation.
How common candlestick patterns fit into the framework
Rejection candles and pin bars
A long wick with a relatively small body often indicates that price travelled away from an area and then returned before the close. The shape may reflect rejection, but the interpretation depends on direction and location. A lower-wick rejection near a relevant support area can show that lower prices were not accepted during that period. Traders still need to assess the larger trend, the strength of the level and whether later candles confirm the response.
At resistance, an upper-wick rejection may show that buyers could not maintain higher prices. In a strong uptrend, though, one upper wick may represent profit-taking rather than a full reversal. This is why a candlestick should be treated as evidence within a sequence, not as a standalone instruction.
Engulfing patterns
An engulfing candle covers the body of a preceding candle and can signal a notable shift in short-term pressure. A bullish engulfing formation may attract attention after a decline or near support, while a bearish version may be relevant after an advance or near resistance. The pattern is more informative when the surrounding structure supports the same interpretation.
Size also matters. An unusually large engulfing candle may show strong movement, but entering immediately can expose a trader to a poor price if the market retraces. Reviewing the next candle, nearby liquidity and the distance to structural levels may provide a more balanced assessment than reacting to the formation alone.
Doji candles and indecision
A doji generally shows that the open and close were close together, although price may have travelled significantly during the period. It can represent temporary balance between buyers and sellers. A doji near a major decision area may encourage closer observation, but it does not automatically mean that a reversal is coming.
In a quiet consolidation, several small-body candles may simply reflect limited movement. In a volatile expansion, a doji with long wicks can show a struggle between opposing forces. The surrounding candles and the market’s structure are essential to the interpretation.
Inside bars and consolidation
An inside bar forms within the range of a preceding candle and can show temporary compression. Traders may watch for a break from the smaller range, but the direction of that break should be evaluated against the broader chart. An upside break into a nearby resistance zone may have limited room, while a downside break during an established decline may still require confirmation.
A practical process for combining candles with smart money concepts
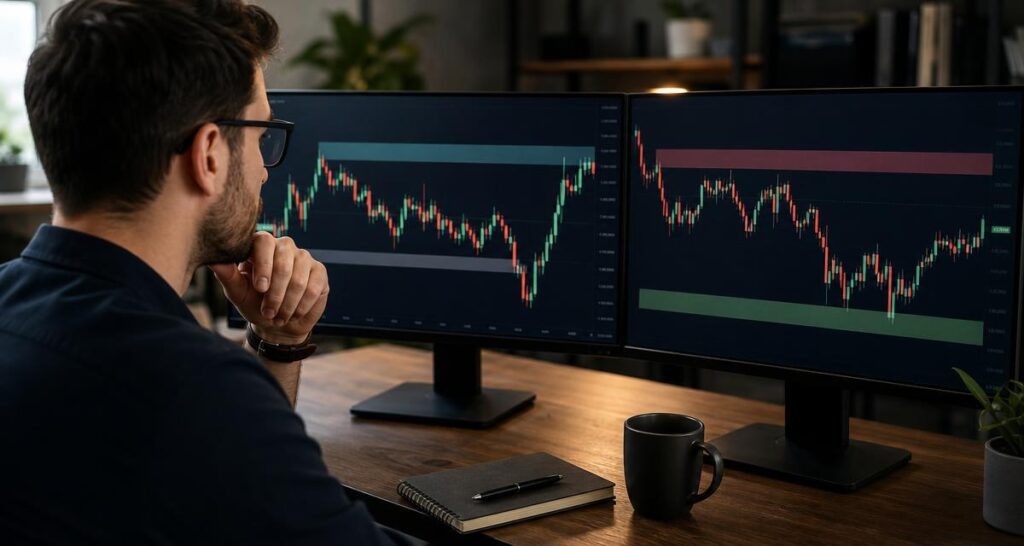
A repeatable process can reduce the temptation to assign too much importance to one attractive pattern. The following sequence is not a guaranteed strategy. It is a way to organize chart observations before making any trading decision.
- Start with the higher-level structure. Identify the most recent meaningful swing highs and lows. Decide whether the market is trending, reversing, or ranging on the timeframe being reviewed.
- Mark areas of interest. Note previous reactions, consolidation boundaries, possible support and resistance, and locations where price has moved quickly away.
- Observe liquidity behavior. Check whether price has approached, briefly crossed or decisively broken a prior high or low. Avoid assuming that every wick represents a deliberate liquidity sweep.
- Read the candlestick sequence. Examine the candle’s body, wicks, close and relationship with the preceding candles. Give more weight to a sequence than to a pattern label.
- Check momentum and follow-through. Look at the next candles and the pace of movement. A pattern that lacks continuation may be a warning to remain patient.
- Define invalidation before acting. Determine what price behavior would challenge the interpretation. This supports disciplined risk planning instead of changing the view after the market moves.
- Review multiple timeframes carefully. A setup on a lower timeframe can conflict with the broader structure. Multi-timeframe analysis may provide additional context, but it can also create confusion if every chart is given equal weight.
Using a smart money indicator without outsourcing judgment
A TradingView indicator built around trend analysis, momentum, market structure, institutional activity and smart money concepts can help traders bring several chart observations into one workspace. This may make it easier to review conditions consistently, especially when manual analysis becomes difficult to organize.
Even so, an indicator should be treated as an analytical aid rather than an automatic decision-maker. Displayed zones, signals or directional readings depend on the underlying calculations and the selected timeframe. Traders should understand what a tool is measuring, compare its information with the chart and avoid assuming that a visual signal predicts the next move.
| Question | Why it matters |
|---|---|
| What is the broader structure? | It places the short-term candle within a larger directional or ranging environment. |
| Where did the pattern form? | Location helps distinguish a reaction near an important area from movement in the middle of nowhere. |
| What happened afterward? | Follow-through can support or weaken the initial interpretation. |
| Does another timeframe disagree? | Conflicting structure can increase uncertainty and calls for greater selectivity. |
| What would invalidate the idea? | A predefined invalidation point helps prevent emotional reinterpretation. |
Common mistakes when reading candlestick patterns
Trading the name instead of the location
Memorizing pattern names can be useful, but the label is not the analysis. A hammer, engulfing candle or doji does not carry the same implication at every price level. Begin with structure and location, then use the candle to describe what happened there.
Assuming a wick proves institutional activity
A wick can show rejection during a candle, but it cannot independently prove which type of market participant caused the movement. It is safer to describe the visible price behavior and then assess whether the broader evidence supports a particular interpretation.
Ignoring the next candles
Waiting for confirmation does not remove uncertainty, but it can prevent a trader from treating an unfinished idea as a completed signal. The next candles may confirm acceptance beyond a level, rejection back into a range or a lack of meaningful follow-through.
Using too many indicators
Adding multiple tools does not necessarily improve analysis. If several indicators display similar information, the chart may become more complicated without adding independent evidence. A focused combination of structure, momentum and price action is often easier to review than a crowded layout.
Confusing analysis with a guarantee
Smart money concepts and candlestick patterns describe possibilities, not certainties. Markets can react unexpectedly to information, liquidity changes and shifts in participation. Sound analysis should therefore be paired with position sizing, a defined risk limit and the willingness to remain out of a trade when the evidence is unclear.
Building a useful chart-review routine
Consistency matters more than finding a perfect formation. Before a trading session or review, record the higher-timeframe structure, the key areas on the chart and the conditions that would make a setup more or less attractive. Then assess whether the current candles are showing rejection, continuation, compression or uncertainty.
A trading journal can make this process more objective. Save the chart, describe the structure without hindsight and note what happened after the pattern appeared. Reviewing a collection of examples can reveal whether a trader is entering too early, relying on candle names or overlooking the broader trend. The purpose is not to prove that one pattern always works, but to improve the quality of the decision process.
Final perspective
Candlestick patterns are most valuable when they add detail to a broader market view. Smart money analysis can provide a framework for reviewing structure, liquidity, momentum and potential institutional activity, while the candle shows how price behaved at a specific moment. Used together, these ideas can support a more organized chart-reading process.
For traders using a TradingView smart money indicator such as the AKMelytics – Market Intelligence Indicator, the practical goal is not to follow every displayed signal. It is to combine tool-based information with independent observation, define uncertainty clearly and make decisions that fit a considered risk plan. No pattern or indicator can remove market risk, so context should always come before confidence.
Frequently asked questions
What are candlestick patterns?
Candlestick patterns are recurring price formations built from the open, high, low and close of one or more candles. They describe price behavior such as rejection, momentum, indecision or consolidation.
How do candlestick patterns support smart money analysis?
They can show how price reacts near structural levels, liquidity areas or zones of interest. This adds short-term detail to broader analysis of market structure, momentum and participation.
Is a candlestick pattern a guaranteed trading signal?
No. A pattern represents a possible interpretation of price action, not a guaranteed outcome. Its usefulness depends on location, surrounding structure, follow-through and risk management.
What is the role of a smart money indicator?
A smart money indicator can organize information related to trend, momentum, market structure, institutional activity and smart money concepts on a chart. It should support analysis rather than replace the trader’s judgment.
Should traders wait for confirmation after a pattern appears?
Many traders review subsequent price action to see whether the market accepts or rejects a level. Confirmation cannot eliminate risk, but it may provide more information than acting on the first candle alone.
Can beginners use candlestick patterns with market structure analysis?
Yes, beginners can start with a small set of formations and focus on where they occur. Learning to identify swings, trends, ranges and invalidation points is generally more useful than memorizing a large list of pattern names.


Recent Comments