
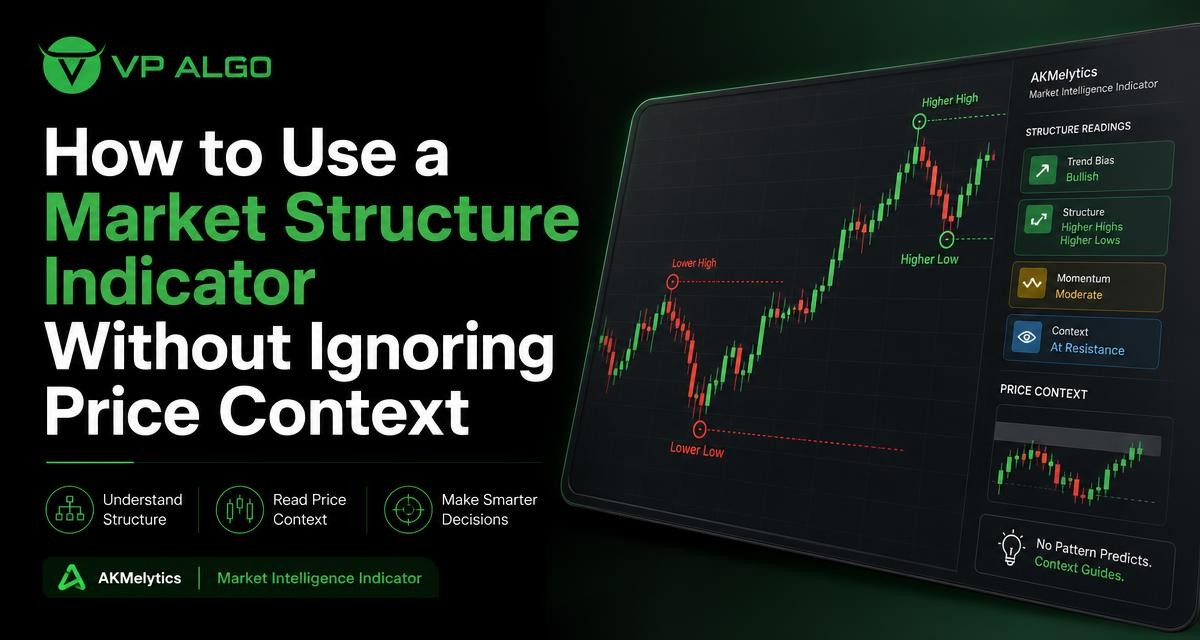
A market structure indicator can help organise the way traders view swing highs, swing lows, breaks and shifts in directional behaviour. However, an indicator is only one part of the chart. The candles that create each move, the location of price, the timeframe and the surrounding market conditions still matter. Used properly, structure readings can support a more disciplined review of price action without turning a visual signal into a prediction.
What a market structure indicator is designed to show
Market structure describes the sequence and relationship between important price points. In a rising sequence, traders may observe higher highs and higher lows. In a declining sequence, lower highs and lower lows may dominate. When price stops following the previous sequence, the chart may begin to show a possible change in behaviour.
A market structure indicator can mark or organise these observations on a TradingView chart. Depending on its design, it may identify swing points, highlight breaks in structure, or distinguish between a continuation and a possible shift. The useful contribution is not that the tool knows what will happen next. Its contribution is that it can make a large amount of chart information easier to review consistently.
That distinction matters. A structure label is an interpretation of completed or developing price data. It does not remove uncertainty from the next candle. Traders still need to examine whether the marked level is meaningful, how price reached it and whether the broader chart supports the same reading.
Why price context matters more than an isolated label
The same structure event can carry different meaning in different locations. A break above a recent high near the middle of a noisy range is not the same as a break above a well-tested resistance area after a prolonged decline. The label may look similar, but the surrounding price context changes the question a trader should ask.
Context includes the market’s recent direction, the distance from notable levels, the size and speed of the move, and the way candles behaved before and after the event. It also includes timeframe. A bullish structural reading on a short-term chart can exist inside a broader bearish move on a higher timeframe. Neither observation automatically cancels the other; they describe different parts of the chart.
| Context to review | Questions to ask | Why it matters |
|---|---|---|
| Recent direction | Has price been making higher highs, lower lows or overlapping swings? | It helps separate a continuing sequence from a range or transition. |
| Location | Is the structure event near a previous high, low, range boundary or other visible level? | Location provides context for whether the move is testing an important area. |
| Candle behaviour | Did candles close strongly, reject the level or overlap heavily? | The candle sequence shows how price interacted with the area. |
| Timeframe relationship | Does the lower-timeframe reading agree with or sit inside a higher-timeframe structure? | It reduces the risk of treating a small move as the entire market picture. |
| Follow-through | Did subsequent candles hold beyond the level, or did price quickly return? | Later behaviour helps you review the quality of the original interpretation. |
A practical process for reading structure and price action together
1. Begin with an unmarked view of the chart
Before focusing on indicator labels, look at the chart itself. Identify the most visible highs, lows, range boundaries and areas where price previously reacted. This first pass helps prevent the tool from becoming the only source of interpretation.
You do not need to mark every minor fluctuation. Concentrate on the swings that are clear enough to matter to the timeframe you are studying. If the chart is so compressed or volatile that several competing structures appear possible, record that uncertainty rather than forcing a single answer.
2. Define the current structural condition
Next, use the market structure indicator to compare its markings with your own reading. Is the chart showing a directional sequence, a consolidation, or a transition between the two? Look for the latest confirmed swing points and consider whether the most recent break has actually changed the sequence or merely extended it temporarily.
A useful habit is to describe the condition in neutral language. For example, “price has moved above a recent swing high” is more precise than “the market is now bullish.” The first statement describes what is visible. The second adds a conclusion that may require more evidence.
3. Examine how price reached the marked level
The path toward a structure level can be as important as the level itself. A steady sequence of directional candles tells a different story from a choppy move made of overlapping candles. A rapid move may show urgency, but it can also leave price at an extended location. A slow approach may indicate balance or hesitation.
Review the candle bodies, wicks and closes around the level. Ask whether buyers or sellers were able to maintain control beyond the area, or whether each attempt was quickly rejected. This does not establish what will happen next, but it gives a clearer account of what happened at the point of interest.
4. Use candlestick patterns as evidence, not as instructions
Candlestick patterns can add detail to a structure reading. A long wick near a prior high may show rejection during that candle. A strong close beyond a visible level may show that price finished the period away from the level. Several overlapping candles may suggest hesitation or temporary balance.
These observations should remain connected to location. A familiar-looking candle formation in the middle of a range may be less informative than a similar formation at a clearly observed swing point. No candlestick pattern guarantees continuation or reversal. It simply describes the relationship between the open, high, low and close for one or more periods.
- Note the pattern’s location rather than reading it in isolation.
- Check whether the candle closed near an important level or returned inside the prior range.
- Compare the pattern with the candles immediately before and after it.
- Avoid treating the pattern name as a substitute for chart analysis.
5. Check the higher-timeframe picture
Multiple-timeframe analysis can help put a local structure event into perspective. A higher timeframe may show a broad range while a lower timeframe shows several directional swings inside that range. In that situation, a lower-timeframe break can still be a real movement, but it may not represent a change in the broader condition.
Keep the process consistent. Begin with the broader timeframe to identify the main areas and general structure, then move to the working timeframe for detail. If you use a still lower timeframe, treat it as a refinement of the same analysis rather than a replacement for the higher-level view.
6. Review momentum without allowing it to override location
Momentum information can help explain whether a move is expanding, slowing or moving with limited conviction. It can be useful alongside structure, particularly when a break occurs after a period of compression or when price begins to lose speed near a prior extreme.
Even so, strong movement does not make a level irrelevant. Price can move quickly into an area where sellers or buyers previously responded. Conversely, a quiet move can still matter if it gradually changes the sequence of swing points. Momentum is one piece of context, not a final verdict.

How to interpret common structure events
A break above a prior swing high
Start by asking which swing high was broken and why that swing matters. Was it a minor fluctuation or a prominent point that defined the recent range? Then examine the close. Price moving above a level intrabar is different from a candle closing above it, and a close above the level is different again from holding above it over subsequent periods.
Also consider whether the move is occurring inside a larger range or near a higher-timeframe boundary. The structure indicator can draw attention to the event, while price context helps describe its significance and its limitations.
A break below a prior swing low
The same reasoning applies to a move below a swing low. Identify the quality of the low, the location of the move and the behaviour of the closing candles. A quick move below a level followed by a return inside the prior range should be recorded as different behaviour from sustained trading below that level.
There is no need to assign certainty to either outcome. The useful task is to distinguish what the chart has confirmed from what remains unresolved.
A possible shift after a long trend
After an extended directional move, traders may pay attention to a failure to create a new high or low, followed by a break of a previous swing. This can be a meaningful change in the sequence, but it is not automatically a complete reversal. Price may enter a range, retrace part of the prior move or create a new structure on a different timeframe.
Use the indicator to identify the sequence change, then inspect whether price is accepting the new area or repeatedly rejecting it. A single label is a starting point for review, not a conclusion about the future direction.
Common mistakes when using a market structure indicator
Taking every label as equally important
Charts contain major swings and minor swings. If every marked point receives the same weight, the chart can become difficult to interpret. Give more attention to levels that are visually prominent, repeatedly observed or relevant to the timeframe being analysed.
Changing the interpretation after the move starts
It is easy to redraw the story once a large candle has appeared. To reduce this problem, write down the structural condition before reviewing what happened next. Note the important levels, the alternative interpretations and what evidence would change your view. This creates a more honest record of the analysis.
Confusing an indicator output with a trade decision
A structure label does not define position size, invalidation, timing or risk. Those questions depend on a trader’s own process and circumstances. A market structure indicator may organise information, but it does not replace a complete plan or make a decision on the trader’s behalf.
Using too many tools without a clear purpose
Adding more indicators can create the appearance of confirmation while making the chart harder to understand. Each tool should answer a distinct question. For example, structure may describe swing relationships, price action may show behaviour at a level, and momentum may describe the speed or strength of movement. If several tools simply repeat the same information, the extra labels may not improve the analysis.
A simple chart-review checklist
Use the following checklist when reviewing a structure reading. It is designed to encourage observation and consistency, not to produce a guaranteed signal.
- What is the dominant condition on the selected timeframe: directional movement, range or transition?
- Which swing points are genuinely significant, and which are minor fluctuations?
- What event has the indicator marked, and can you describe it without making a prediction?
- Where is the event located relative to previous highs, lows and range boundaries?
- How did the candles approach, test and close around the level?
- Does the higher-timeframe structure support, limit or complicate the local reading?
- What evidence would show that the interpretation is no longer valid?
- Have you separated chart observation from any separate trading decision?
How TradingView tools can support a repeatable process
TradingView indicators can make chart review more structured by displaying selected information consistently. A tool that includes market structure, trend or momentum features may help traders compare charts and timeframes using the same visual framework. The benefit comes from a repeatable process, not from assuming that an indicator can see the future.
Before relying on any tool, learn what its labels represent, when a swing is considered confirmed and how the display behaves as new candles form. Review historical charts carefully, including periods where the reading was unclear or changed. This helps you understand the tool’s role and prevents you from treating its output as independent proof.
VP ALGO TRADING develops and sells TradingView indicators and algorithmic trading tools intended to assist with market evaluation and trading decisions. As with any charting tool, users should treat the information as educational and analytical support, not as financial advice or a promise of a particular result.
Final perspective
A market structure indicator is most useful when it helps you ask better questions about the chart. It can organise swing relationships and draw attention to possible changes, but it cannot replace visible price action. Combine the reading with location, candle behaviour, timeframe context and a clear description of what has actually occurred.
The goal is not to find a label that predicts the next move. The goal is to build a consistent method for observing uncertainty, testing an interpretation and recognising when the chart does not provide enough information for a confident conclusion.
Frequently asked questions
What does a market structure indicator show?
It generally organises or marks swing highs, swing lows, structural breaks and possible changes in the relationship between those points. The exact display depends on the indicator’s design and settings.
Can a market structure indicator predict the next price movement?
No indicator can guarantee what price will do next. A structure reading is an interpretation of available chart data and should be considered alongside price context and uncertainty.
How do candlestick patterns improve structure analysis?
They add detail about how price behaved around a level, including rejection, strong closes, hesitation and overlap. Their meaning depends on location and surrounding candles rather than on the pattern name alone.
Should structure be analysed on more than one timeframe?
Reviewing more than one timeframe can show whether a local movement sits within a broader trend, range or transition. It does not remove ambiguity, but it can prevent a short-term reading from being treated as the whole market picture.
What is the difference between a structure break and a confirmed trend change?
A structure break describes price moving beyond a selected swing point. A trend change is a broader interpretation that may require additional evidence, such as a new sequence of swings and sustained behaviour beyond the level.
Can a market structure indicator replace a trading plan?
No. It may support chart organisation and analysis, but it does not define risk, position sizing, timing or personal decision rules. Those elements require a separate process.
What should I do when the indicator and price action appear to disagree?
Pause and investigate. Check the swing definitions, timeframe, level location and candle closes. The disagreement may reveal a transition or an interpretation that needs more evidence rather than a reason to force agreement.


Recent Comments