
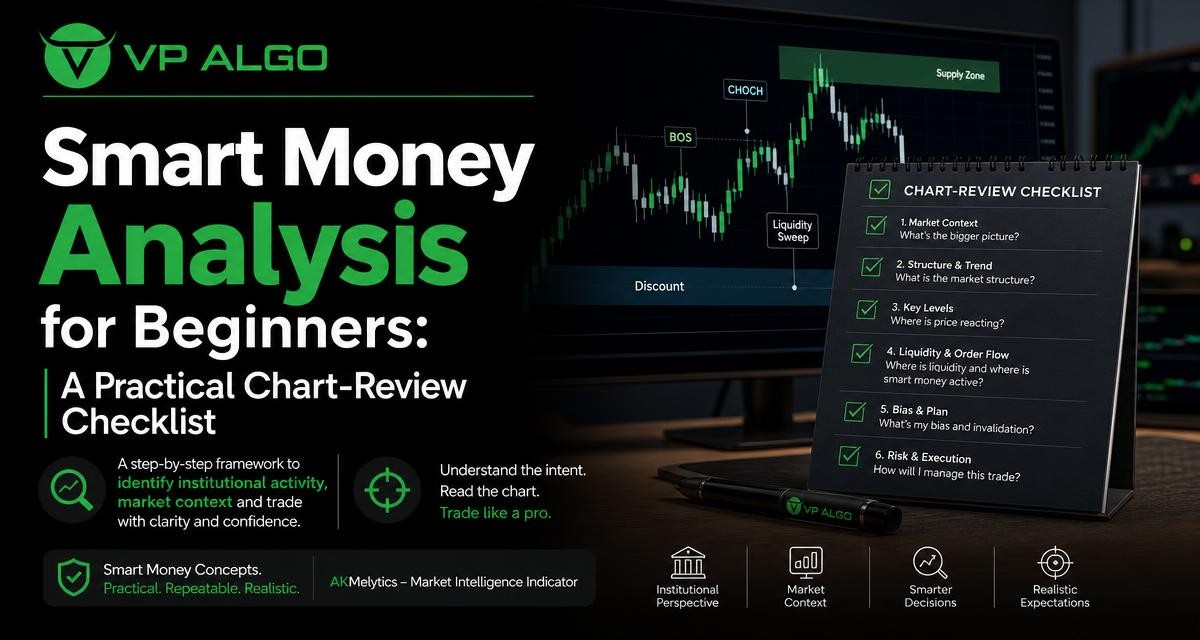
A smart money trading indicator can help beginners organise chart analysis, but it should not replace judgment, risk management or a clearly defined trading plan. The most useful approach is to treat smart money concepts as a checklist: first identify the broader trend, then study momentum, market structure, possible institutional activity and the quality of the current market context.
What smart money analysis means
Smart money analysis is a way of interpreting price behaviour through the actions and positioning of larger market participants. The term is often used when traders study market structure, liquidity, momentum, breakouts, reversals and areas where buying or selling pressure may be concentrated.
For a beginner, the concept does not require assuming that every large participant acts as one group or that a chart reveals exactly what institutions are doing. Instead, it provides a framework for asking better questions. Is price moving with a clear trend? Has structure changed? Is momentum supporting the move? Could the current price be reacting around an important area?
This distinction matters. A smart money trading indicator may organise signals and highlight conditions, but no indicator can remove uncertainty from the market. The goal is a more consistent review process, not a promise of a correct prediction.
The five parts of a beginner-friendly chart review
A practical review can be divided into five connected areas. Looking at them in the same order helps prevent a common beginner mistake: reacting to one attractive signal while ignoring the larger market context.
| Review area | Key question | What to record |
|---|---|---|
| Trend | What direction is price generally taking? | Higher highs, lower lows, or a range |
| Momentum | Does current pressure support the move? | Strength, weakening pressure, or conflicting signals |
| Market structure | Has price respected or broken a significant level? | Structure continuation, break or possible change |
| Institutional activity | What does price behaviour suggest about concentrated participation? | Reaction zones, unusual movement or flow-related clues |
| Context | Does the setup fit the timeframe and trading plan? | Timeframe alignment, invalidation point and risk |
These categories should be considered together. A bullish trend with weakening momentum deserves a different interpretation from a bullish trend with strong continuation and supportive market structure. The checklist is useful because it encourages evidence to be weighed rather than counted.
Step 1: Start with the trend
Trend analysis gives the chart a starting point. On a rising market, price may form a sequence of higher highs and higher lows. On a declining market, lower highs and lower lows may dominate. When neither pattern is clear, the market may be ranging or transitioning.
Begin on a broader timeframe before examining a more detailed chart. This can help you avoid treating a short-term price movement as a complete trend reversal. A move that looks bearish on a lower timeframe may simply be a pullback within a wider uptrend.
Questions to ask
- Is price making consistent progress in one direction?
- Are recent swings extending the existing trend or failing to do so?
- Is the market trending, consolidating or moving between two visible boundaries?
- Does the lower timeframe support the broader directional picture?
A trend indicator for TradingView can make this first review more structured by helping you view directional conditions alongside the chart. However, the indicator should be read as part of the analysis rather than as an automatic instruction to buy or sell.
Step 2: Evaluate momentum separately from direction
Direction and momentum are related, but they are not identical. Price can remain in an uptrend while its upward momentum begins to weaken. It can also move sharply in a new direction before the broader structure has fully changed.
Momentum analysis asks whether the current pressure is expanding, holding steady or fading. Look for agreement between price movement and momentum-related signals. If price is making new highs but momentum is not supporting the move, the difference is worth recording. It is not proof of an immediate reversal, but it may call for greater caution.
A simple momentum checklist
- Identify the current directional move.
- Check whether momentum supports that direction.
- Note any weakening, divergence or sudden change in pressure.
- Wait for market structure to provide additional context before drawing a conclusion.
A momentum indicator for TradingView can assist with this part of the process, particularly when a beginner is learning to separate price direction from the strength of the move. The most useful record is not simply “momentum is bullish” or “momentum is bearish,” but whether momentum agrees with the trend and structure.
Step 3: Map market structure
Market structure describes the way price forms and breaks important swings. It is one of the central ideas within smart money concepts because it gives traders a way to distinguish continuation from a possible change in direction.
Mark the most meaningful recent swing highs and lows rather than every small movement. A break above a minor fluctuation may have little significance, while a break of a well-defined swing can change how the chart should be interpreted. The importance of a level depends on the timeframe, the strength of the move and how price behaved around it.
Structure terms in plain language
- Continuation: Price extends the existing pattern of higher highs and higher lows, or lower highs and lower lows.
- Break: Price moves beyond a previously observed swing or boundary.
- Possible change: Price breaks a meaningful structural point and begins behaving differently from the prior trend.
- Range: Price moves between relatively clear upper and lower areas without sustained directional progress.
A market structure indicator can help display these relationships, but visual clarity does not make the interpretation certain. A temporary move beyond a level may fail, especially in fast or congested markets. Consider whether the move is sustained and whether momentum and the broader trend agree with it.
Step 4: Consider institutional activity carefully
Many traders use smart money analysis to look for clues associated with larger orders or concentrated participation. Price may react strongly from a particular area, move rapidly through a level or repeatedly encounter buying and selling pressure. These observations can be useful, but they should not be presented as direct proof of what a specific institution has done.
An institutional flow indicator or related smart money tool may help organise observations about market activity. Use it to identify areas for further review, then return to the chart and ask whether price action confirms the idea. A highlighted area is a point of interest, not an automatic entry.
How to review a possible activity zone
- Note where the sharp movement began.
- Check whether the area produced a clear reaction or was simply crossed without hesitation.
- Compare the zone with nearby market structure.
- Look for confirmation from trend and momentum.
- Define what would make the interpretation invalid before considering any trade.
This approach keeps the analysis grounded. It also reduces the temptation to label every candle, gap or reversal as evidence of institutional intent. The chart shows observed behaviour; the explanation remains an interpretation.

Step 5: Check multiple timeframes
Multi-timeframe analysis can make a chart review more coherent. A broader timeframe can provide the market context, while a lower timeframe can show the detail of a pullback, breakout or reaction. The purpose is not to collect as many signals as possible. It is to understand whether the smaller movement fits the larger picture.
| Timeframe role | Purpose | Beginner question |
|---|---|---|
| Higher timeframe | Establish broad direction and major structure | What is the market generally doing? |
| Middle timeframe | Study the active swing or consolidation | Is the current move continuing or changing? |
| Lower timeframe | Examine detail and timing context | Does the smaller move support the broader view? |
Different timeframes may produce different signals without either one being wrong. A lower-timeframe decline can occur inside a higher-timeframe advance. When signals conflict, record the conflict rather than forcing a single conclusion.
Turning the checklist into a repeatable routine
A checklist is most useful when it can be completed consistently. Before opening a position, write down the current market condition in plain language. For example, you might describe a chart as “higher-timeframe uptrend, short-term pullback, momentum mixed, structure not yet confirmed.” This is more informative than relying on a single coloured signal.
Five-minute chart-review process
- Describe the broad trend. State whether the market is rising, falling or ranging.
- Mark meaningful swings. Avoid filling the chart with every minor fluctuation.
- Assess momentum. Record whether it confirms or challenges the directional view.
- Review activity zones. Treat highlighted areas as locations for investigation, not guaranteed setups.
- Write the invalidation condition. Decide what evidence would show that the idea is no longer valid.
After the review, ask whether there is a clear reason to act at all. “No trade” can be a valid conclusion when the trend, momentum and structure do not align. Waiting for better-defined conditions is part of disciplined analysis.
Using a smart money trading indicator responsibly
An indicator can reduce the amount of manual chart marking and present several types of information in one workspace. The Delphi Intelligence Smart Money Indicator offered by VP ALGO TRADING is described as combining trend analysis, momentum evaluation, market structure, institutional activity, multi-timeframe trend assessment and smart money analysis. The AKMelytics – Market Intelligence Indicator is also positioned within this market-intelligence and smart-money category.
For a beginner, the value of such a tool is best judged by whether it makes the review process clearer and more repeatable. It should help you ask better questions, not encourage automatic decisions. Learn what each display represents, compare it with the underlying price action and keep a record of situations where signals agree or conflict.
Good habits when testing an indicator
- Read the documentation and understand each signal before using it.
- Test your review process in a practice environment or through historical chart study.
- Do not change rules after seeing the outcome of a past move.
- Record losing, winning and unclear examples rather than only attractive setups.
- Use position sizing and risk limits that are appropriate for your own circumstances.
VP ALGO TRADING positions its indicators as tools for educational and trading-decision assistance purposes rather than financial advice. An indicator does not know your objectives, financial position or tolerance for loss, so those decisions remain your responsibility.
Common beginner mistakes
Following a single signal
A strong-looking arrow or highlighted zone can attract attention, but it is only one piece of evidence. Check the broader trend, market structure and momentum before assigning meaning to it.
Confusing a pullback with a reversal
Short-term price movement often runs against the broader trend. A pullback becomes more significant when meaningful structure changes and the new direction receives continued support. Until then, describe it accurately as a pullback or uncertain transition.
Adding too many indicators
Several tools may appear to confirm one another while actually measuring similar aspects of price. More displays can create more noise. Choose a review process you can explain and repeat.
Ignoring uncertainty
Smart money concepts are interpretations of market behaviour, not a direct view into every participant’s intentions. Use conditional language in your notes and define what would change your view.
Final checklist before making a decision
Use the following questions as a final filter:
- What is the broad trend?
- Where are the meaningful structural highs and lows?
- Is momentum supporting the current direction?
- Is there a clearly defined area of interest?
- Do the timeframes agree, or is there a conflict?
- What evidence would invalidate the analysis?
- Does the idea fit a written trading plan and acceptable risk level?
If several answers are unclear, the chart may not offer a well-defined situation. The checklist is not designed to force a trade. Its purpose is to make uncertainty visible and improve the quality of the decision-making process.
Frequently asked questions
What is a smart money trading indicator?
It is a chart-based tool that helps organise concepts such as trend, momentum, market structure, institutional activity and possible smart money conditions. It provides analytical information rather than guaranteed outcomes.
Are smart money concepts suitable for beginners?
They can be, provided they are learned as a structured way to study price behaviour. Beginners should start with trend and market structure, then add momentum and activity analysis gradually.
Does a smart money indicator predict the market?
No. It may highlight conditions or areas for review, but market outcomes remain uncertain. Signals should be evaluated alongside context, risk limits and a trading plan.
What should I check first on a chart?
Start with the broader trend and major market structure. Then review momentum, possible activity zones and lower-timeframe behaviour.
Can one indicator replace technical analysis?
No. An indicator can organise parts of technical analysis, but it does not replace understanding price behaviour, testing a process or managing risk.
How should beginners use a TradingView smart money indicator?
Use it as a review aid: understand its displays, compare them with price action, document aligned and conflicting signals, and avoid treating any single output as an automatic trade instruction.


Recent Comments