
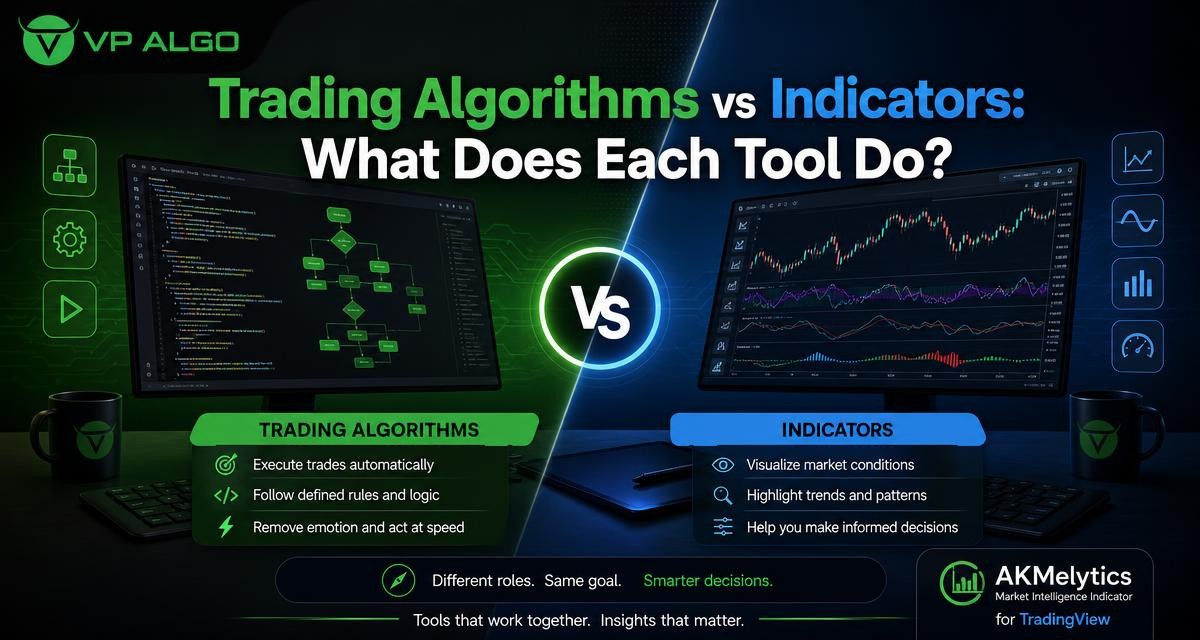
Trading algorithms and indicator-assisted analysis can both help traders organize market information, but they do different jobs. An algorithm follows defined rules to process data or perform a task, while an indicator presents calculated or structured information for a trader to interpret. Understanding that distinction makes it easier to build a practical TradingView workflow and use tools such as the AKMelytics – Market Intelligence Indicator appropriately.
Why the distinction between algorithms and indicators matters
The terms “algorithm” and “indicator” are sometimes used interchangeably in trading discussions. That can create confusion, especially when a platform tool uses calculations, signals, trend readings, or market-structure labels. A tool may rely on algorithms internally without being an automated trading system. In the same way, an indicator may support a trading process without making decisions on the trader’s behalf.
The most useful distinction is based on the tool’s role in the workflow. Trading algorithms are rule-based processes. They can scan information, transform data, identify conditions, or execute a predefined instruction when the relevant technology supports execution. A TradingView indicator is generally an analytical layer on a chart: it organizes market observations so the user can assess context, timing, and potential setups.
| Aspect | Trading algorithms | Indicator-assisted analysis |
|---|---|---|
| Primary role | Apply a defined sequence of rules to data or actions | Display calculated information that supports analysis |
| Typical output | Screening results, conditions, alerts, or automated actions where supported | Visual signals, trend readings, momentum information, or market-structure observations |
| Human involvement | Depends on the design; some systems automate more of the workflow | The trader normally interprets the information and makes the final decision |
| Main strength | Consistency in applying predefined rules | Clarity and organization when reviewing market conditions |
| Main limitation | Rules may behave poorly when market conditions change | Readings still require context, judgment, and risk awareness |
What are trading algorithms?
A trading algorithm is a set of instructions for handling market-related information or actions. The instructions may describe what data to examine, which conditions must be present, and what should happen next. For example, an algorithm could be designed to identify when several predefined conditions occur together, sort instruments according to those conditions, or generate an alert for further review.
Not every algorithm is a trading bot, and not every algorithm places orders. Some algorithms are analytical. Others can support screening, signal generation, portfolio processes, or execution when connected to suitable systems. The important question is not simply whether a tool uses code or calculations, but what the tool is configured to do after processing the information.
How an algorithmic workflow is structured
A basic algorithmic workflow usually contains several connected stages. First, the process receives market data or chart information. It then applies rules, calculations, or conditions to that input. The result may be a classification, a notification, a displayed output, or an action. A trader or system can then review the result according to the intended workflow.
- Input: The process receives the relevant price, volume, time, or chart data.
- Rules: The algorithm applies its programmed conditions or calculations.
- Output: It produces a result such as a condition, alert, ranking, or chart reading.
- Review or action: The result is assessed or used in the next step of the trading process.
This structure can reduce inconsistency in the mechanical parts of analysis. It does not remove the need to understand the rules, evaluate the quality of the data, or consider how the process behaves in different market environments. A rule that appears useful in one context may be less informative when volatility, trend conditions, or market structure change.
What does a TradingView indicator do?
A TradingView indicator converts market information into a visual or numerical format on a chart. Depending on its design, it may help a trader examine trend direction, momentum, market structure, institutional activity, or other conditions. The purpose is usually to make observations easier to organize rather than to replace analysis altogether.
For example, a trend indicator for TradingView may help a user assess directional conditions across a selected timeframe. A momentum indicator for TradingView may highlight changes in the strength or pace of price movement. A market structure indicator may help organize observations about breaks, shifts, or other structural features. These readings can be useful, but they still need to be considered alongside the broader chart context.
Indicator readings are evidence, not automatic conclusions
A chart label or signal is an output of a calculation. It is not a guarantee that a particular market event will follow. The meaning of the output depends on the rules behind the indicator, the timeframe being reviewed, and the way the trader combines it with other observations.
This is particularly relevant for tools that combine several analytical ideas. An indicator can bring trend analysis, momentum evaluation, market structure, institutional flow monitoring, multi-timeframe trend assessment, and smart money analysis into one chart-based workflow. That can make information easier to review, but it does not turn a market reading into certain knowledge or financial advice.
How algorithms and indicators overlap
Although the two tools have different roles, they often overlap technically. An indicator normally uses calculations or programmed rules to create its displayed readings. In that sense, an indicator may contain algorithmic logic. The difference is that the visible result is intended to support analysis, while a broader trading algorithm may be designed to handle a sequence of decisions or processes beyond chart display.
Consider a rule that identifies a change in momentum. In an indicator, the result might appear as a line, color change, label, or signal on a TradingView chart. In a larger algorithmic workflow, the same condition might become one input among several rules used for screening or alert generation. The underlying calculation can be similar even though the overall purpose is different.
The practical difference is workflow, not just technology
When comparing tools, ask what happens after the calculation is complete. Does the output simply help the trader inspect a chart? Does it filter a list of instruments? Does it trigger an alert? Does it connect to an execution process? These questions are more useful than assuming that every coded tool is an automated trader.
| Workflow question | What to look for |
|---|---|
| What information is processed? | Price, momentum, trend, structure, flow, timeframe, or other supported chart information |
| What is displayed? | Lines, labels, zones, conditions, signals, or a combined market view |
| Who interprets the result? | The trader, an additional rule set, or an automated process, depending on the tool |
| What happens next? | Further chart review, watchlist filtering, alert monitoring, or another defined step |
Where a market intelligence indicator fits
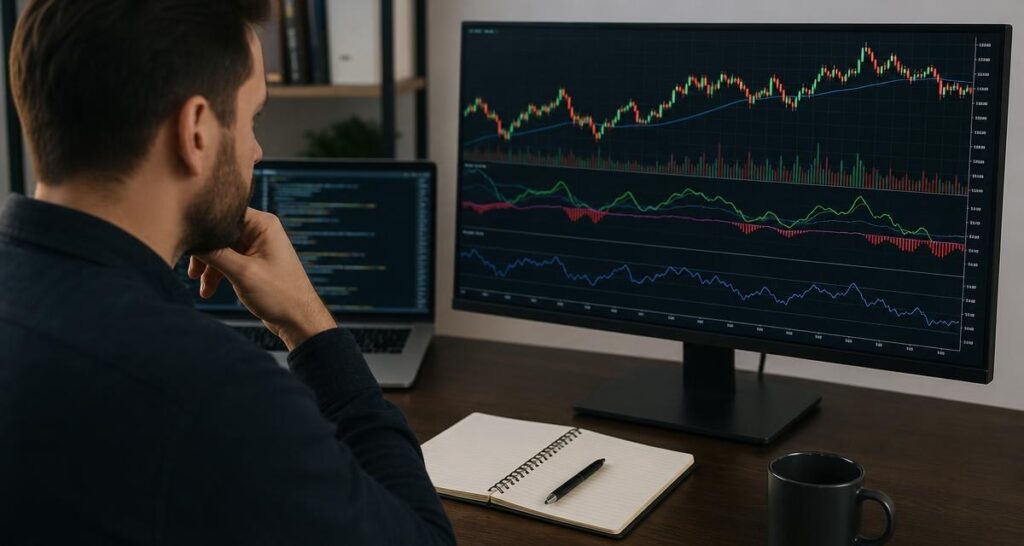
The AKMelytics – Market Intelligence Indicator is positioned as a TradingView tool for organizing several types of market observation. Its relevant areas include trend analysis, momentum signals, market structure, institutional activity, multi-timeframe trend assessment, and smart money analysis. Rather than treating each observation as an isolated chart exercise, a market intelligence approach can help a trader review these elements within one structured process.
That structure is useful when a chart contains more information than the trader can comfortably track at once. A trader may first consider the wider trend, then examine momentum, review market structure, and finally assess whether the overall picture is consistent across timeframes. The indicator can assist with that review by presenting supported readings in a more organized way.
A possible analysis sequence
The exact workflow remains the trader’s responsibility, but a logical sequence can make chart review more repeatable. The following approach illustrates how indicator-assisted analysis may fit into a broader process without presenting it as an automatic trading method.
- Start with context: Review the broader chart and selected timeframe before focusing on an individual signal.
- Assess trend: Consider whether the available trend readings point to a clear direction or a less decisive environment.
- Review momentum: Examine whether momentum supports, weakens, or conflicts with the observed trend.
- Study market structure: Look for structural information that helps place recent price movement in context.
- Compare timeframes: Check whether the market view changes meaningfully from one timeframe to another.
- Form a plan: Use the combined observations to decide whether further analysis is justified, rather than treating one output as a complete decision.
This kind of sequence can help beginners avoid jumping directly from a single label to a trade decision. More experienced traders may use it as a checklist for confirming that their analysis has considered the dimensions they intended to review.
When trading algorithms may be useful
Trading algorithms can be helpful when a trader wants a repeatable way to handle clearly defined conditions. A rule-based process can reduce the need to manually repeat the same scan across charts or timeframes. It may also help separate the mechanical part of analysis from the interpretive part.
- Consistent screening: The same stated conditions can be applied across a selected set of charts or data.
- Structured alerts: A process can identify when predefined conditions deserve attention.
- Repeatable analysis: The trader can document which inputs and rules produced a result.
- Reduced manual repetition: Routine calculations or filtering may be handled by the tool.
However, consistency is not the same as correctness. An algorithm follows its rules even when the market context is unsuitable for those rules. A clear description of the process, an understanding of its assumptions, and ongoing review are therefore important parts of responsible use.
When indicator-assisted analysis may be useful
Indicators are often most useful when the main challenge is organizing observations. A trader may understand trend, momentum, and market structure separately but struggle to review them in a consistent order. A TradingView indicator can make those observations more visible and help create a repeatable chart-review routine.
Indicators can also support communication and learning. A visible chart output gives the trader something concrete to examine and question. Instead of asking whether a tool is simply “right” or “wrong,” the trader can ask what the reading measures, what conditions may weaken its relevance, and whether other parts of the chart support the same interpretation.
Questions to ask before relying on an indicator
- What market information does the indicator use?
- Which timeframe is being reviewed?
- Is the current market trending, ranging, or changing character?
- Does momentum support the trend reading, or conflict with it?
- Does market structure provide additional context?
- Am I treating a signal as a prompt for analysis or as a guaranteed outcome?
How to combine both tools without confusing their roles
A practical workflow can use algorithmic rules and indicator readings together, provided each has a clear purpose. For example, an algorithmic process may filter charts according to predefined conditions, while an indicator helps the trader inspect trend, momentum, structure, and smart money observations on the remaining charts. The algorithm narrows the review; the indicator organizes the review.
Another approach is to use indicator outputs as inputs to a larger rule set. In that case, the trader should document exactly how each reading is used and what additional conditions are required. Combining more signals does not automatically improve analysis. If several outputs describe closely related information, the extra complexity may create a false impression of confirmation.
| Task | Potentially suitable tool | Useful discipline |
|---|---|---|
| Find charts meeting defined conditions | Algorithmic screening process | Write down the conditions before reviewing results |
| Organize trend and momentum observations | TradingView indicator | Review readings in the context of timeframe and price action |
| Examine structure and institutional activity | Market intelligence indicator | Use the readings as analysis support, not certainty |
| Decide whether a setup deserves further attention | Combined workflow | Keep the decision rules and risk considerations separate from the visual signal |
Common mistakes when comparing these tools
Assuming every algorithm is a trading bot
An algorithm can be used for analysis, screening, calculations, alerts, or execution. Calling every algorithm a trading bot hides these important differences. Before evaluating a tool, identify whether it provides information, performs a process, or takes an action.
Expecting one indicator to explain the entire market
No chart display can remove uncertainty from market analysis. Trend, momentum, structure, and flow readings each provide a particular perspective. A combined indicator may make those perspectives easier to review, but the trader still needs to understand what each component contributes.
Confusing a clean workflow with a guaranteed result
A well-organized process can improve consistency without guaranteeing a profitable outcome. Markets change, signals can conflict, and a setup can fail even when several readings appear aligned. Tools should therefore be used for educational and trading-decision assistance, not as a substitute for independent judgment or financial advice.
Choosing the right role for each tool
If your main difficulty is repeating the same scan or applying a fixed set of conditions, an algorithmic process may address that workflow problem. If your difficulty is interpreting several market dimensions on a chart, an indicator may be more appropriate. Many traders will find that the two roles complement each other rather than compete.
For users of TradingView, the key is to define the next step before adding another tool. Decide whether you need faster filtering, clearer chart context, multi-timeframe assessment, or a more consistent review process. A market intelligence indicator such as AKMelytics can be considered within that framework, particularly when trend, momentum, market structure, institutional activity, and smart money concepts are all part of the trader’s intended analysis.
Frequently asked questions
Are trading algorithms the same as trading indicators?
No. Trading algorithms are rule-based processes that handle information or actions, while indicators generally display calculated information to support chart analysis. An indicator may use algorithmic calculations internally without being an automated trading system.
Does a TradingView indicator automatically place trades?
Not necessarily. A TradingView indicator is primarily an analytical chart tool. Whether any separate automation or execution process exists depends on the specific system and its supported integrations.
What can the AKMelytics – Market Intelligence Indicator help me review?
It is designed to support review of areas such as trend analysis, momentum, market structure, institutional activity, multi-timeframe trend assessment, and smart money analysis within a TradingView workflow.
Can an indicator replace a trading strategy?
An indicator can support a strategy, but it does not automatically define every part of one. A complete trading process also requires clear rules for context, review, decisions, and risk considerations.
Is a smart money indicator a guarantee of profitable trades?
No. A smart money indicator provides analytical information and should not be treated as a guarantee of a particular market outcome or as financial advice.
How should beginners start using algorithmic tools and indicators?
Start by learning what each tool measures and defining its role in the workflow. Review trend, momentum, structure, and timeframe context before treating any output as a reason for further analysis.


Recent Comments