
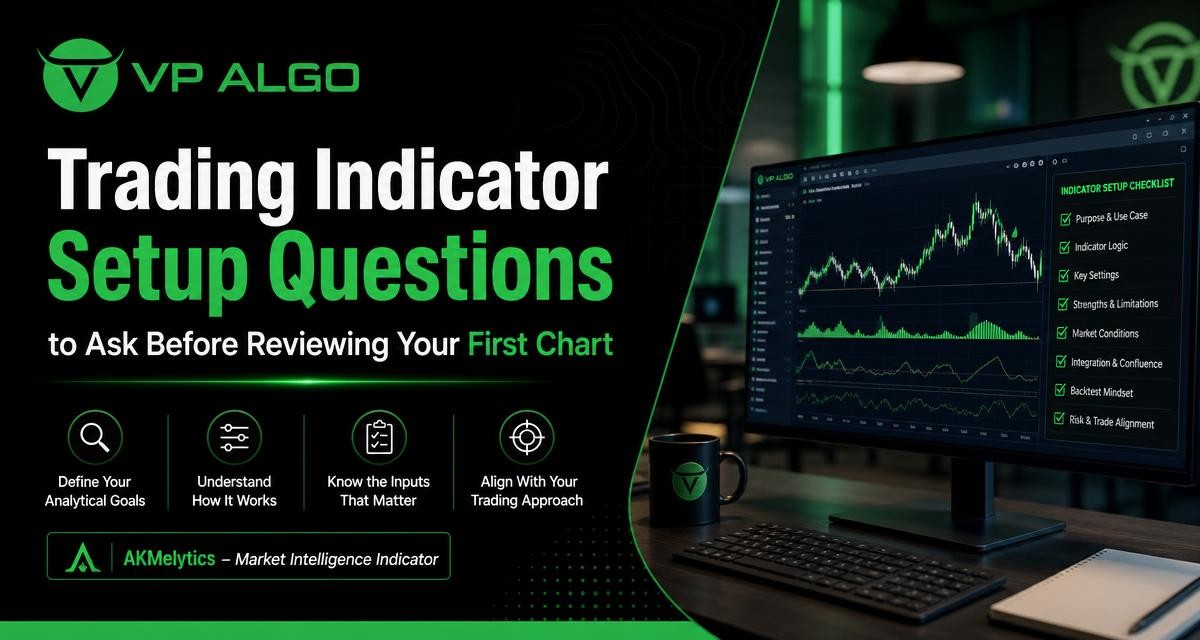
Before reviewing your first chart with a trading indicator, clarify what the tool is designed to show, how it is installed and which questions you expect it to help answer. A structured setup does not predict market outcomes, but it can make chart review more consistent and help you interpret trend, momentum, market structure and other readings more carefully.
Why setup questions matter before chart review
Adding an indicator to a TradingView chart is only the beginning. The more important step is understanding what its signals represent and how they fit into your own analysis. Without that context, a trader may treat every label, line or highlighted area as an instruction to enter or exit a position. That can lead to confused chart reading and decisions based on a feature that was never intended to work on its own.
A good setup process begins with expectations. You should know whether the tool is primarily helping you assess direction, momentum, market structure, institutional activity, smart money conditions or a combination of these areas. You should also know what the indicator does not do. An indicator can organize information and support decision-making, but it does not remove uncertainty or guarantee a particular trading result.
Question 1: What is the main analytical goal?
Start by defining the job you want the trading indicator to perform. Are you trying to understand the broader trend before studying a setup? Do you want additional information about momentum? Are you looking for market structure developments, institutional flow monitoring or smart money concepts? These are related areas, but they are not identical.
Writing down one primary goal makes the first review more useful. For example, you might use the chart review to ask whether the current trend and market structure agree, rather than immediately looking for a buy or sell label. If the indicator combines several analytical functions, separate them mentally so that you can identify which reading is influencing your interpretation.
| Analytical area | Question to ask | What to clarify |
|---|---|---|
| Trend | What is the broader directional context? | How the tool presents trend and whether the reading changes across timeframes |
| Momentum | Is current movement gaining or losing strength? | Whether momentum is a confirmation signal or an independent analytical view |
| Market structure | What have recent highs, lows or structural changes shown? | How structure-related markings are defined and displayed |
| Institutional activity | What information is being used to represent institutional flow? | How to interpret the feature without assuming it predicts a trade |
| Smart money concepts | Which conditions are being highlighted? | What each label means and how it relates to the rest of the chart |
Question 2: Is the indicator installed and activated correctly?
A reading is only worth reviewing if the tool is available on the intended TradingView account and chart. Before analysing anything, confirm that the indicator has been added to the correct chart and that its display settings are visible. Check that the chart timeframe, symbol and other basic chart details match the context you intended to study.
For the AKMelytics – Market Intelligence Indicator, access is handled through the product process. After purchase, customers are instructed to provide their TradingView ID by email for product access. If installation, activation or usage questions arise, VP ALGO TRADING states that customers can contact support for assistance. This makes access verification an appropriate first step rather than trying to interpret an incomplete or inactive display.
Use a simple access checklist
- Confirm that you are signed in to the correct TradingView account.
- Check that the TradingView ID supplied for access is accurate.
- Verify that the indicator appears on the intended chart.
- Review whether the relevant display elements are enabled.
- Contact support if installation or activation is unclear.
Question 3: Which features should you understand first?
A multi-feature trading indicator can present more information than a first-time user can process at once. The AKMelytics – Market Intelligence Indicator is described as including features related to trend analysis, momentum signals, market structure, institutional flow monitoring, multi-timeframe trend assessment and smart money analysis. You do not need to treat every feature as equally important during your first review.
Instead, learn the purpose of each major feature and the relationship between them. A trend reading may provide broader context, while momentum may describe the strength of a current move. Market structure may help you examine how price has developed, and multi-timeframe assessment may help you compare a wider view with a more detailed chart. The goal is not to collect as many signals as possible. It is to understand what each part contributes to the analysis.
Questions for learning the interface
- What does each line, label, colour or highlighted area represent?
- Which features are descriptive, and which are intended as analytical confirmations?
- Can several features display different readings at the same time?
- What should you do when trend, momentum and structure do not agree?
- Are the settings adjustable, and do you understand the effect of each adjustment?
If you cannot explain a chart element in your own words, do not rely on it as a decision-making shortcut. Spend time reviewing the product guidance or ask for usage assistance before assigning a meaning to the reading.
Question 4: What timeframe should you review first?
Timeframe selection affects the context of every chart observation. A reading on a broader timeframe may describe a different market condition from a reading on a shorter timeframe. This does not automatically make one timeframe correct and the other incorrect; it means the two views answer different analytical questions.
A practical first review can move from broad context to detailed observation. Begin by asking what the larger trend and multi-timeframe assessment suggest. Then examine the timeframe you normally use for chart analysis. Finally, compare the readings rather than assuming that a short-term signal overrides the broader picture. If the timeframes disagree, record that disagreement as part of the analysis instead of forcing a single conclusion.
| Review stage | Purpose | Question to record |
|---|---|---|
| Broader timeframe | Establish general context | What is the prevailing trend or structural condition? |
| Working timeframe | Study the chart you normally analyse | Do momentum and structure support the broader context? |
| Detailed view | Inspect recent price behaviour | What has changed recently, and is that change meaningful? |
Question 5: What does a signal actually mean?
The word “signal” can create unrealistic expectations if its meaning has not been defined. A signal may be an indication that certain conditions are present, a visual prompt for further analysis or a way to organize several observations. It should not automatically be treated as a guaranteed buy or sell instruction.
Before relying on any signal, ask what conditions produce it, whether it can change as new chart data appears and how it relates to other features. Also ask whether the signal is intended to be reviewed alongside market structure, trend and momentum rather than in isolation. This distinction is particularly important for traders comparing a smart money indicator, market structure indicator or momentum indicator for TradingView. Each tool may highlight a different part of the market picture.
A useful indicator reading should lead to a better question about the chart, not replace the need to understand the chart.

Question 6: How will you separate observation from decision?
Chart review becomes clearer when you separate what the indicator shows from what you decide to do about it. For example, an indicator may display a trend condition or identify a change in structure. That is an observation. Whether the information fits your own method, risk controls and trading plan is a separate decision.
This separation helps prevent the tool from becoming an automatic decision-maker. VP ALGO TRADING positions its indicators for educational and trading-decision assistance purposes rather than as financial advice. The user remains responsible for interpreting the information, considering uncertainty and deciding whether the analysis is appropriate for their own approach.
A practical chart-review note
- Write down the trend reading without describing it as a trade instruction.
- Record the momentum and market structure observations separately.
- Note whether the different features agree or conflict.
- Compare the result with your own trading plan and risk process.
- Record what you still do not understand before taking further action.
Question 7: What should you test during a familiarization period?
The first review should be about familiarity, not about proving that an indicator will produce a particular result. Use charts you understand well and focus on how the display behaves across different conditions. You can examine periods with clear movement, periods with changing structure and periods where the readings are less obvious. The purpose is to learn the language of the tool.
Keep notes about repeated questions. Does a trend assessment remain consistent across the timeframes you review? How does the momentum feature appear when movement changes? Which market structure markings do you understand immediately, and which require further explanation? These observations help you decide whether the interface supports your analytical process.
VP ALGO TRADING states that its website offers a request-based 7-day free trial for its indicator and Telegram channel. If you are considering that option, confirm the current process and eligibility details directly before relying on it. A trial or familiarization period should be used to understand the tool, not as evidence of guaranteed future performance.
Question 8: Do you understand the limits of the tool?
No trading indicator can remove market uncertainty. A chart can change, signals can conflict and an interpretation that appears reasonable in one situation may not apply in another. Understanding these limits is part of responsible setup, not a criticism of the tool.
Be cautious with claims that an indicator eliminates losses, guarantees profitable trades or identifies every market move. Those expectations are not appropriate for a tool designed to assist analysis. A more realistic goal is to use the indicator to organize observations and support a repeatable review process while retaining independent judgment and risk awareness.
Limits worth confirming
- The indicator is not a broker, investment manager or financial adviser.
- Its readings do not guarantee profitable results or remove trading losses.
- Past chart behaviour does not guarantee future results.
- A signal should not be treated as personalized financial guidance.
- The indicator should be interpreted within a broader trading and risk process.
How to prepare for your first complete review
Once access and feature meanings are clear, create a repeatable review sequence. Begin with the broader timeframe, identify the general trend and examine the market structure. Move to the working timeframe, then review momentum, institutional activity and smart money-related information. Finish by writing down areas of agreement and disagreement.
Keep the process simple enough to repeat. A short checklist is often more useful than adding more indicators or changing settings constantly. If the chart feels crowded, return to your primary analytical goal and hide any feature you do not yet understand. You can study additional functions later after the core readings are familiar.
| Before reviewing | During reviewing | After reviewing |
|---|---|---|
| Confirm access, chart and timeframe | Separate trend, momentum and structure observations | Record agreement, conflict and unanswered questions |
| Define your analytical goal | Read labels according to their documented meaning | Review whether the tool supported your process |
| Choose the features to learn first | Avoid treating signals as guaranteed instructions | Ask for support where installation or usage remains unclear |
When a TradingView trading indicator may be worth further consideration
A TradingView trading indicator may be useful for traders who want a structured way to examine several aspects of market conditions in one charting environment. The relevant question is not whether a tool can replace analysis, but whether its features are understandable and relevant to the way you review charts.
The AKMelytics – Market Intelligence Indicator is intended for traders interested in areas such as trend analysis, momentum, market structure, institutional flow monitoring, multi-timeframe assessment and smart money analysis. Before using it, review its access process, learn the feature language and decide how its readings will fit into your own method. That preparation gives you a more realistic basis for evaluating the tool.
FAQ
What should I check before adding a trading indicator to a chart?
Confirm that you are using the correct TradingView account, have the required access and know the main purpose of the indicator. Also check that the chart, symbol, timeframe and visible settings match your intended review.
What is the difference between a trading indicator and financial advice?
A trading indicator organizes or displays market information for analysis. It is not a financial adviser and does not provide personalized financial guidance or guarantee a particular outcome.
How should I read a smart money indicator?
First learn what its smart money-related labels and conditions represent. Then compare those readings with trend, momentum and market structure instead of treating one label as an automatic trade instruction.
Why should I compare multiple timeframes?
Different timeframes can show different parts of market behaviour. Comparing them helps you distinguish broader context from shorter-term movement and identify when the readings agree or conflict.
What should I do if I do not understand an indicator feature?
Do not assign your own meaning to the feature and rely on it immediately. Review the available guidance or contact support for installation, activation or usage assistance.
Does an indicator guarantee profitable trading results?
No. An indicator can support chart analysis, but it cannot guarantee profits, eliminate losses or predict future market results. Its readings should be considered within your own trading and risk process.
How can I learn the AKMelytics indicator before using it seriously?
Use a familiarization period to study its trend, momentum, market structure, institutional activity and smart money-related features. VP ALGO TRADING states that its website offers a request-based 7-day free trial, so confirm the current process and conditions directly before proceeding.


Recent Comments