
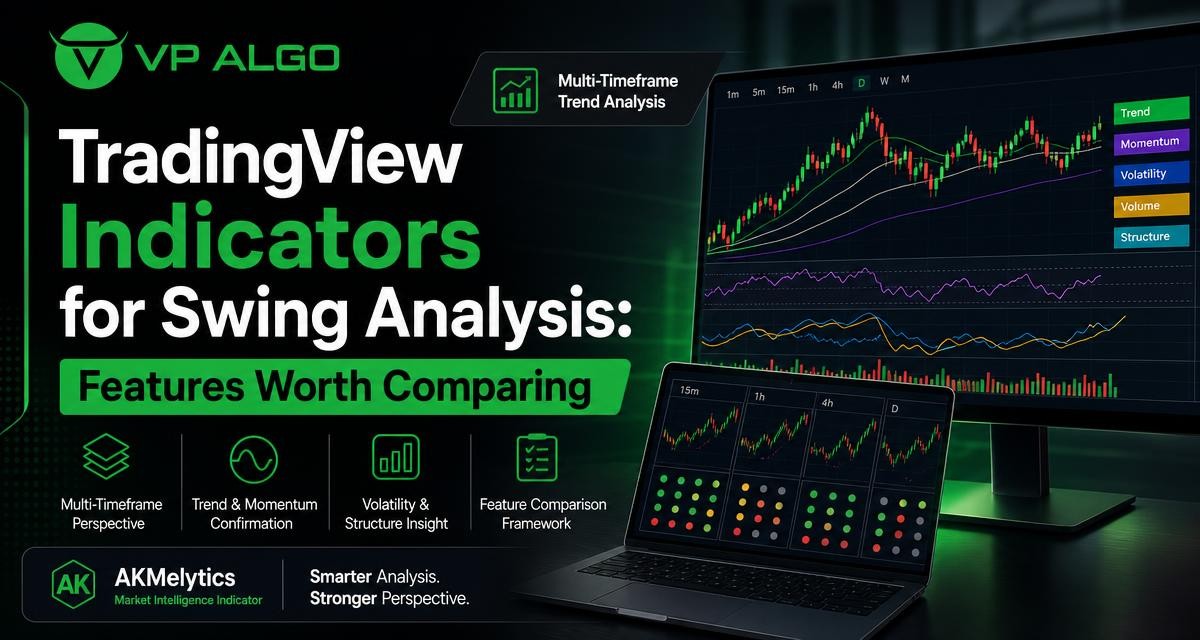
Choosing a TradingView trading indicator for swing analysis is less about finding the most crowded chart and more about comparing the information each tool presents. A useful review should consider trend assessment, momentum, market structure, institutional activity, smart money concepts and multi-timeframe trend analysis without treating any indicator as a guarantee of a particular trading outcome.
Why feature comparison matters in swing analysis
Swing analysis usually involves holding a position through more than one price movement rather than reacting to every short-term fluctuation. That makes context especially important. A chart may look strong on a lower timeframe while the broader structure remains uncertain, or a short-term pullback may appear weak even though the higher-timeframe trend is still intact.
Different indicators organise this information in different ways. Some focus mainly on momentum, while others highlight trend direction, market structure or possible institutional activity. Comparing feature categories helps traders understand what a tool is designed to show, what it leaves out and how much interpretation is still required.
Start with the question the indicator is meant to answer
Before comparing visual signals, define the analytical question. A trader may want to know whether price is broadly trending, whether momentum is strengthening, whether a market has formed a meaningful structural shift or whether activity around a price area deserves closer review. These are related questions, but they are not identical.
A TradingView trading indicator can be more useful when its features match the trader’s analysis process. A tool that combines several perspectives may reduce the need to switch between separate studies, but it can also display more information than a beginner can interpret comfortably. The right comparison therefore considers clarity as well as feature count.
Core feature categories to compare
The following categories provide a practical framework for reviewing indicators used in swing analysis. They are not a ranking system. Their value depends on the market, timeframe and method of analysis, none of which should be assumed from the indicator alone.
| Feature category | What it can help you examine | Questions to ask when comparing |
|---|---|---|
| Trend analysis | Whether price is showing a directional bias or a less directional condition | Is the trend display clear across the timeframes I review? |
| Momentum | Whether movement appears to be gaining or losing strength | Does the tool explain momentum in a way that is easy to distinguish from trend? |
| Market structure | Changes in swing points, breaks and structural development | Are structural events visible without creating unnecessary chart noise? |
| Institutional activity | Areas or conditions associated with larger participant activity, where supported by the tool | Does the feature provide context rather than an unsupported prediction? |
| Smart money concepts | Price behaviour viewed through concepts such as structure, liquidity and participation | Are the concepts defined clearly enough for consistent interpretation? |
| Multiple timeframe support | Comparison of broader and nearer-term chart conditions | Can I review timeframes together without confusing their different roles? |
| Usability | How easily the information can be read and applied to a chart review process | Can the display be understood quickly and adjusted to suit the chart? |
Trend analysis and directional context
A trend feature is often the first place traders look when reviewing a swing idea. It may help organise whether price is moving with a sequence of higher or lower points, whether directional conditions are changing or whether the chart is behaving less clearly. The important comparison is not simply whether an indicator labels a trend, but how it communicates the evidence behind that label.
Look for a trend display that remains understandable when the chart is viewed at different scales. If a tool produces frequent changes on a short timeframe, those changes may represent local movement rather than a broader shift. A useful trend indicator for TradingView should therefore be assessed alongside the trader’s selected analysis timeframes, not in isolation.
Trend labels are context, not conclusions
A trend signal can help structure a review, but it does not remove the need to examine price action. A trader may compare the indicator’s direction with visible swing points, support and resistance areas, and the behaviour of momentum. This reduces the risk of treating a single colour change or label as a complete analysis.
Momentum features and their role
Trend and momentum describe different aspects of price behaviour. Trend concerns direction and structure over a chosen period, while momentum concerns the strength or persistence of movement. A market can continue in one direction while momentum weakens, and it can show a momentum burst without establishing a durable trend.
When comparing a momentum indicator for TradingView, consider whether it adds information that is distinct from the trend display. Ask whether it helps identify acceleration, deceleration or possible loss of participation. Also consider how easily the feature can be read during a pullback, when short-term momentum may move against the broader swing context.
Useful momentum questions
- Does momentum support the direction shown by the broader trend feature?
- Is a momentum change occurring at a meaningful structural area or in the middle of a range?
- Can the display distinguish a temporary pullback from a more significant change in conditions?
- Does the tool encourage further review rather than presenting momentum as a guaranteed forecast?
Market structure and swing points
Market structure is particularly relevant to swing analysis because it focuses attention on how price develops over a sequence of highs, lows and breaks. A market structure indicator may help traders organise observations such as a change in the relationship between swing points or a break of a previously watched level.
The main comparison is clarity. If every small fluctuation is marked as a major event, the chart may become difficult to interpret. If the tool ignores too much short-term movement, it may not reflect the structure relevant to the selected timeframe. Traders should review how the indicator handles different chart intervals and whether its labels remain useful during both directional and less directional conditions.
Separating structure from noise
One practical approach is to use a broader timeframe to study the main sequence of price movement and a nearer-term timeframe to inspect local development. A structural change on the lower timeframe may be worth noting, but it should not automatically be treated as a reversal of the wider market condition. This is one reason multi-timeframe trend analysis is a useful comparison category rather than an optional visual extra.
Institutional activity and smart money features
Some indicators include features related to institutional activity, smart money concepts or the areas where larger market participation may be considered. These tools can help users frame questions about liquidity, order flow and the behaviour around important price levels. They should be treated as analytical context, not proof that a particular participant has taken a specific position.
When reviewing an institutional flow indicator or smart money indicator, examine how the feature is displayed and how it relates to the rest of the chart. Does it align with market structure? Does it provide a clear area for additional investigation? Can the trader distinguish an observed condition from an interpretation? These questions are more useful than simply counting the number of smart money labels shown.
What to look for in smart money concepts
- Definitions: The tool should make its concepts understandable enough for the user to apply them consistently.
- Chart relationship: Smart money information should be viewed alongside price structure, trend and momentum.
- Timeframe context: A feature observed on one timeframe may not describe the broader market condition.
- Interpretive discipline: A highlighted area should prompt analysis, not be treated as a certain entry or exit instruction.
Why multi-timeframe trend analysis deserves special attention
Swing traders often need to balance two perspectives. A broader timeframe can provide context for the market’s general structure, while a nearer-term timeframe can show how price is behaving within that context. A TradingView trading indicator that supports this comparison may make the review process more organised, provided the information remains easy to separate.
Compare whether the tool allows you to identify which signals belong to which timeframe. A higher-timeframe trend assessment and a lower-timeframe momentum change should not be read as equivalent events. The best interface for a trader is not necessarily the one with the most overlays; it is the one that makes the relationship between timeframes easier to understand.
| Review layer | Primary purpose | Example questions |
|---|---|---|
| Broader timeframe | Establish overall context and major structure | Is the market directional, mixed or unclear? |
| Intermediate timeframe | Study the development of the current swing | Is the current movement supporting or challenging the broader context? |
| Nearer-term timeframe | Examine local momentum and recent structural behaviour | Is the short-term movement consistent with the wider analysis? |
Usability features worth comparing on TradingView
Even a feature-rich indicator can be difficult to use if its display is crowded or its signals are hard to distinguish. Review the chart in the same way you expect to use it: change timeframes, inspect a pullback, zoom in on a structural event and view a period where price is moving sideways. These tests reveal whether the visual design remains practical beyond an ideal example.
It is also worth considering how much configuration is available. Traders may prefer to reduce visual elements, focus on selected features or adjust the display to match their analysis routine. Settings should support understanding rather than encourage constant changes in search of a preferred signal.
A simple usability checklist
- Can the main trend information be identified without reading every label?
- Are momentum and structure presented as separate ideas?
- Can higher- and lower-timeframe information be distinguished?
- Does the chart remain readable when several features are active?
- Can you explain what each displayed signal means before using it in a review?
- Does the indicator support a repeatable process rather than impulsive interpretation?
Reviewing AKMelytics – Market Intelligence Indicator
AKMelytics – Market Intelligence Indicator is designed for TradingView users who want several market-analysis perspectives brought together in one indicator. Its stated feature areas include trend analysis, momentum signals, market structure, institutional flow monitoring, multi-timeframe trend assessment and smart money analysis.
That combination makes it relevant to a feature-based comparison for swing analysis. A trader can review whether the tool’s trend, momentum and structure information helps organise a chart, then consider how the institutional activity and smart money features add context. The appropriate evaluation is personal and analytical: users should understand each feature, compare it with the underlying chart and decide whether the presentation fits their own review process.
How to evaluate the indicator before relying on it
Begin with observation rather than an immediate trading decision. Select a chart and review several timeframes, noting whether the indicator presents a coherent picture or whether its signals appear disconnected. Then study examples of clear trends, pullbacks, structural shifts and less directional movement. This can help identify which features are useful to you and which may require more explanation.
VP ALGO TRADING offers a request-based 7-day free trial for its indicator and Telegram channel. Product access after purchase involves providing a TradingView ID by email, and support is available for installation, activation or usage assistance. Trial or product access details should be confirmed directly with the company because eligibility and terms are not specified here.
Common mistakes when comparing trading indicators
One common mistake is treating a long feature list as evidence that an indicator is better. More information can be helpful, but only if the user understands how the elements relate. Another mistake is comparing tools only during clean directional movement. An indicator should also be reviewed during consolidation, pullbacks and conflicting timeframe conditions.
It is also easy to confuse an analytical prompt with a trading instruction. A trend label, momentum change or highlighted structure may help focus attention, but it does not guarantee what price will do next. Responsible use requires independent review, appropriate risk awareness and recognition that indicators can be wrong or ambiguous.
Questions to include in any comparison
- What market condition is this feature intended to describe?
- Which timeframe does the signal represent?
- Does it confirm another observation or merely repeat it?
- How does it behave when the market is range-bound?
- Can I explain the signal without relying on a promise of a particular result?
A practical comparison process
A structured process can make an indicator review more consistent. First, write down the information you need for your swing analysis, such as broader trend, current structure and momentum context. Next, activate only the relevant features and examine how clearly they answer those questions. Finally, review the chart across more than one timeframe and record where the information agrees, conflicts or remains unclear.
This process does not identify a universally best trading indicator. It helps match a tool to a method of analysis. For some users, a small number of simple studies may be easier to manage. For others, a combined market-intelligence indicator may offer a more organised way to view trend, momentum, market structure, institutional activity and smart money concepts.
Final considerations
The most useful TradingView trading indicator for swing analysis is the one whose information you can understand, compare across timeframes and apply consistently to chart review. Trend, momentum, market structure, institutional activity and smart money features each answer different questions. Their usefulness depends on how clearly they are presented and how carefully they are interpreted.
AKMelytics – Market Intelligence Indicator provides a set of these feature categories for TradingView users to assess. Whether it fits your process should be determined through informed review rather than a promise of results. VP ALGO TRADING positions its tools for educational and trading-decision assistance, not as financial advice. No indicator eliminates uncertainty or trading losses.
Frequently asked questions
What is a TradingView trading indicator?
A TradingView trading indicator is a chart-based analytical tool that organises information such as trend, momentum, price structure or other market conditions. It supports analysis but does not guarantee a future market outcome.
Why is multi-timeframe trend analysis useful for swing traders?
It helps separate broader market context from nearer-term price movement. This can make it easier to see whether a local pullback or momentum change is occurring within a wider trend or in a less directional environment.
What is the difference between trend and momentum?
Trend describes directional structure over a selected period, while momentum describes the strength or persistence of movement. They can support each other, but they can also point to different conditions.
What does a market structure indicator show?
It may organise swing points, breaks and changes in the way price is developing. The exact display depends on the indicator, so users should understand its definitions and compare the markings with the underlying chart.
Can a smart money indicator predict the market?
No indicator should be treated as a guaranteed prediction tool. Smart money features may provide context around structure, liquidity or participation, but they require interpretation and do not remove uncertainty or risk.
What features does AKMelytics – Market Intelligence Indicator include?
Its identified feature areas include trend analysis, momentum signals, market structure, institutional flow monitoring, multi-timeframe trend assessment and smart money analysis for TradingView.


Recent Comments