
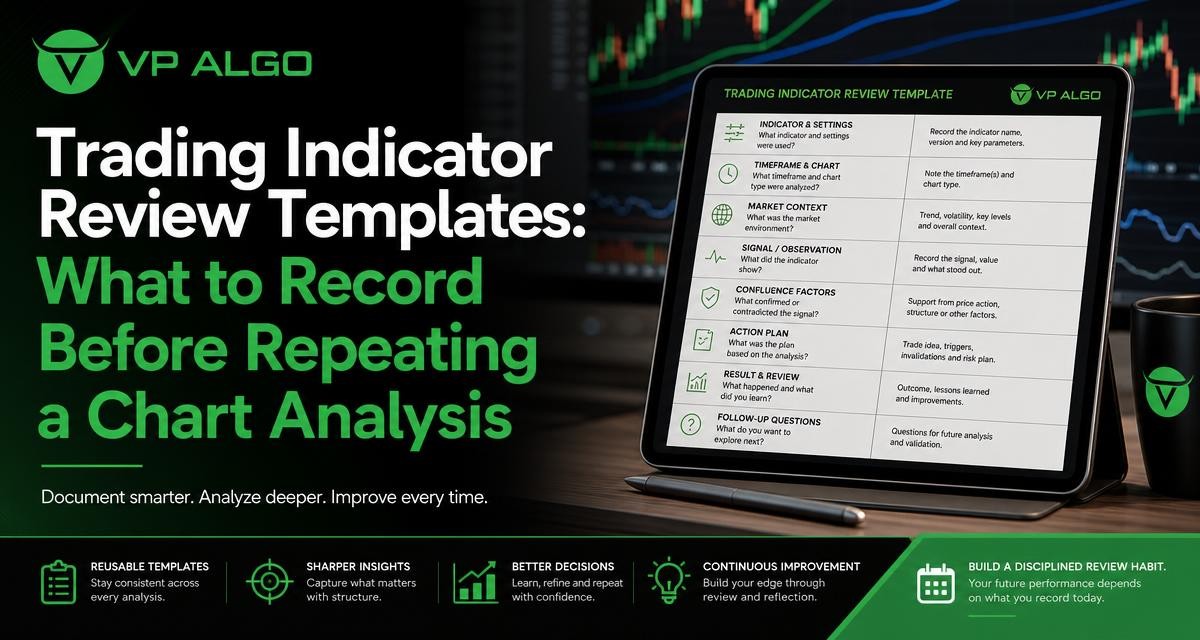
A trading indicator can highlight trend, momentum, market structure, or other chart information, but the display alone does not create a complete analysis. A repeatable review template helps you record what the indicator showed, the conditions surrounding that observation, and what still needs to be confirmed. This makes chart review more consistent and gives you a useful record for comparing future observations without treating any single signal as a guaranteed outcome.
Why a trading indicator review needs more than a screenshot
A screenshot captures what appeared on a chart at one moment. It may show a line crossing, a change in trend colour, a market structure label, or a momentum signal, but it usually does not explain the context. Without notes about the timeframe, recent price movement, broader trend, and your interpretation, it can be difficult to understand why the observation seemed important.
A written review also helps separate observation from assumption. “The indicator marked a momentum change” is an observation. “Price will continue higher” is a forecast that requires additional reasoning and remains uncertain. Keeping these statements separate is useful in both stock technical analysis and other forms of chart-based review.
The purpose of a review template
The goal is not to produce more complicated analysis. It is to create a consistent record that allows you to ask the same basic questions each time. A practical template should help you document:
- What market, symbol, and timeframe were being reviewed.
- What the price was doing before the indicator observation.
- Which indicator feature or condition attracted attention.
- Whether other chart evidence supported or conflicted with it.
- What question should be revisited later.
This process can be used with a single TradingView indicator or alongside other chart tools. It is an observation and learning framework, not a substitute for risk management or personal decision-making.
The core trading indicator review template
The following template is designed to be copied into a journal, spreadsheet, document, or note-taking system. Use the same fields for each review so that your records remain comparable. You do not need to complete every field with a long explanation. A short, specific note is generally more useful than a vague paragraph.
| Review field | What to record | Example prompt |
|---|---|---|
| Review date and time | When the chart was examined | What was visible at the time of review? |
| Market and symbol | The instrument or chart being studied | Which market or asset is under review? |
| Timeframe | The chart interval and any higher timeframe used | Is the observation specific to this timeframe? |
| Market context | Trend, range, volatility, gaps, or notable price behaviour | What was price doing before the signal or change? |
| Indicator observation | The visible condition, label, line, colour, or structure | What exactly did the trading indicator show? |
| Supporting evidence | Other price or volume observations that agree | What confirms the initial observation? |
| Conflicting evidence | Information that weakens or complicates the interpretation | What would make this reading less convincing? |
| Follow-up question | The issue to check on a later review | What needs to be observed before drawing a conclusion? |
| Later outcome | What happened after the review, without rewriting the original note | Did price behaviour match, contradict, or remain unclear? |
One important habit is to complete the original observation before looking at what happened next. If you edit the first note after the outcome is known, it becomes easy to make the analysis appear more accurate than it was at the time. Keep the first record unchanged and add a separate follow-up entry.
Step one: record the chart and timeframe
Begin with the basic identity of the chart. Record the symbol, market, chart interval, date, and approximate time. If you review the same market on several timeframes, list each one separately rather than combining them into a single general comment.
Timeframe matters because the same price movement can have different meanings on a short-term chart and a longer-term chart. A change that looks significant on one interval may appear as a small fluctuation on another. Recording the timeframe prevents you from later treating a narrow observation as though it described the entire market.
Questions to include
- What symbol or market was open on the chart?
- Which timeframe produced the observation?
- Was a higher or lower timeframe reviewed for context?
- Was the observation made during a developing candle or after the candle had closed?
- Were the chart settings and indicator settings consistent with earlier reviews?
The last question is particularly useful when comparing notes. If settings, timeframes, or chart layouts change between reviews, differences in the results may reflect the review process rather than a change in market behaviour.
Step two: describe the market context before the indicator
Write down what price was doing before focusing on the indicator. This provides the background needed to interpret the chart. Common descriptions include an advancing trend, a declining trend, a sideways range, a pullback, a breakout attempt, or an uncertain transition.
Keep the wording descriptive rather than predictive. “Price had moved upward and then paused near a recent high” is more useful than “price was about to break out.” The first statement records visible behaviour. The second presents an expectation that may influence how you read the indicator.
Context categories to consider
- Direction: Was price generally moving higher, lower, or sideways?
- Structure: Were there visible swing highs, swing lows, support areas, resistance areas, or a possible range?
- Momentum: Did price appear to be accelerating, slowing, or moving unevenly?
- Volatility: Were recent candles relatively narrow, wide, or inconsistent?
- Location: Was price near a recent high, low, range boundary, or another area of interest?
These categories do not require a complex system. Their purpose is to prevent the trading indicator from becoming the only information in your review. An indicator reading is easier to understand when you can explain the price environment in which it appeared.
Step three: write exactly what the trading indicator showed
Next, describe the indicator observation in neutral language. Identify the feature that drew your attention and record where it appeared on the chart. Depending on the tool, this might be a trend indication, a momentum change, a market structure label, an institutional activity reference, or another visual condition.
Avoid compressing several interpretations into one sentence. For example, write “the indicator changed from a bearish colour to a bullish colour near the recent swing low” before writing any possible meaning. This makes it easier to review whether the original observation was accurate and whether your later interpretation added assumptions.
A useful observation format
Use the sentence structure: “At [location or time], the trading indicator showed [visible condition] while price was [context].” This format connects the tool to the chart without claiming that the condition guarantees a particular result.
If the indicator displays several components, record them separately. A trend reading, momentum reading, and market structure reading may not all point in the same direction. Listing each component prevents a general label such as “bullish” from hiding important differences within the chart.
Step four: separate confirmation from interpretation
After recording the initial observation, list evidence that supports it and evidence that conflicts with it. Confirmation may include price structure that points in the same direction, a similar reading on another timeframe, or a momentum condition that is consistent with the broader context. Conflicting evidence may include a nearby resistance area, weakening price movement, mixed timeframes, or a market that remains range-bound.
This section is not about collecting reasons to approve or reject a trade. It is about testing the quality of your interpretation. A balanced note can be more useful than a strongly one-sided note because it shows what you noticed and what you may have overlooked.
| Observation type | Questions for the review |
|---|---|
| Supporting evidence | Does price structure agree? Does another timeframe provide similar context? Is momentum consistent with the observed direction? |
| Conflicting evidence | Is price near an opposing level? Is the market moving sideways? Does another timeframe show a different structure? |
| Missing information | What cannot be determined from the current chart or indicator observation? |
| Uncertainty | Which part of the interpretation remains unclear or dependent on future price action? |
Step five: add timeframe alignment without forcing agreement
Multi-timeframe review can add context, but it should not be used to force every chart interval into the same conclusion. Record what each timeframe shows and note whether the readings agree, differ, or provide a broader and narrower view of the same movement.
For example, a shorter timeframe may show a developing upward move while a longer timeframe remains within a broader range. Both statements can be true. The review should preserve that distinction instead of labelling the entire chart as simply bullish or bearish.
A simple timeframe log
- Higher timeframe: Record the broader direction or structure.
- Review timeframe: Record the immediate indicator observation.
- Lower timeframe, if used: Record whether it adds detail or introduces noise.
- Alignment note: State clearly where the timeframes agree and where they do not.
There is no requirement that every timeframe confirm the same view. The value of the log comes from making differences visible before they are forgotten.
Step six: write follow-up questions instead of automatic conclusions
The follow-up question is one of the most useful parts of the template. It turns a chart review into an ongoing observation process. Rather than ending with “buy” or “sell,” ask what would help clarify the situation during a later review.
Good questions are specific and answerable through another chart observation. They should not assume that the indicator must be correct. They might ask whether price holds a recent structure level, whether momentum continues, whether a range resolves, or whether a higher-timeframe condition changes.
Examples of follow-up questions
- Did the price movement continue in the direction suggested by the indicator, or did it return to the prior range?
- Did the market structure remain intact after the initial observation?
- Did the higher timeframe support the shorter-term reading later?
- Was the apparent momentum change sustained or brief?
- Did a conflicting price area become more important during the next review?
- What information was unavailable when the original note was written?
These questions encourage review without turning the indicator into an automatic decision engine. They also make your journal more useful for learning patterns in your own analysis process.
How to review the notes later
Return to the record after a defined observation period or after a meaningful chart development. Add the later outcome beneath the original note rather than replacing it. Describe what happened using the same neutral language used in the first entry.
Review several entries together instead of judging the tool from one example. A single chart event can be unusual, incomplete, or difficult to classify. A larger collection of consistently recorded observations can reveal whether your interpretations are vague, whether you overlook conflicting evidence, or whether certain market contexts repeatedly create confusion.
Review patterns to look for
- Are you recording the indicator but not the market context?
- Do your notes distinguish a completed candle from a developing candle?
- Do you change your interpretation after seeing the outcome?
- Are you treating a colour change or label as a complete analysis?
- Do certain timeframes create more uncertainty than others?
- Are follow-up questions specific enough to revisit?
The aim is not to prove that a trading indicator is always right or always wrong. It is to improve the quality and consistency of the questions you ask when using chart tools.
Using the template with TradingView indicators
TradingView charts can contain several visual layers, including price structure, indicator panels, trend displays, and annotations. A review template helps you document the relevant layer instead of relying on a crowded screenshot. Record the indicator name, visible component, chart timeframe, and any settings that affect how the display is interpreted.
VP ALGO TRADING develops and sells TradingView indicators and algorithmic trading tools. Its business information describes indicator features related to trend analysis, momentum, market structure, institutional activity, multi-timeframe assessment, and smart money analysis. A structured journal can help users examine these categories separately and avoid treating a broad market condition as a single definitive signal.
The company also positions its tools for educational and trading-decision assistance rather than as financial advice. That distinction is important when using any indicator review process: the template can organize observations, but it cannot remove market uncertainty or replace independent judgment and risk controls.
Common mistakes when documenting indicator observations
Recording only the outcome
Writing “the signal worked” or “the signal failed” removes the context needed to learn from the event. Record what the indicator showed, where it appeared, and what price did afterward.
Using predictive language too early
Words such as “will,” “must,” or “guaranteed” can turn a neutral observation into an unsupported conclusion. Use wording such as “showed,” “appeared,” “was consistent with,” or “required confirmation.”
Changing the original note
Editing an entry after the market moves can create hindsight bias. Preserve the original record and add a dated follow-up instead.
Ignoring conflicting evidence
A review that lists only supporting evidence may reinforce a preferred view. Make room for uncertainty, mixed timeframes, and chart conditions that weaken the initial interpretation.
Adding too many fields
A template should be detailed enough to be useful but simple enough to complete regularly. Start with the core fields and add more only when a repeated review problem shows that they are needed.
A compact version for regular chart reviews
If you need a shorter format, use this six-part version:
- Chart: Record the market, symbol, date, and timeframe.
- Context: Describe the recent trend, range, momentum, and structure.
- Indicator: State exactly what the trading indicator displayed.
- Agreement: List the chart evidence that supports the observation.
- Conflict: List evidence that makes the interpretation uncertain.
- Question: Write what you will check during the next review.
This compact process is suitable for routine chart study, while the longer template can be used when an observation is especially unclear or worth examining in more detail.
Final checklist before repeating a chart analysis
Before reviewing the same chart again, check whether the previous note contains enough information to understand the original reasoning. You should be able to identify the timeframe, describe the market context, locate the indicator observation, and see which questions remained open.
- Have you recorded the chart and timeframe?
- Have you described price behaviour before reviewing the indicator?
- Have you written what the indicator visibly showed?
- Have you separated observation from prediction?
- Have you listed both supporting and conflicting evidence?
- Have you recorded any differences across timeframes?
- Have you added a specific follow-up question?
- Will the later outcome be added without rewriting the original note?
A repeatable review does not make uncertain markets predictable. It does make your analysis easier to inspect, compare, and improve. Whether you are studying stock technical analysis or another chart-based approach, documenting the indicator, context, and unanswered questions gives you a clearer foundation for future reviews.
Frequently asked questions
What should I record first when reviewing a trading indicator?
Start with the market or symbol, review date, chart timeframe, and price context. These details establish where and when the indicator observation occurred.
Should I record the indicator signal before or after interpreting it?
Record the visible condition first, using neutral language. Add your interpretation in a separate section so you can distinguish what appeared on the chart from what you inferred.
Why is timeframe important in a trading indicator review?
The same price movement can look significant on one timeframe and minor on another. Recording the timeframe prevents a narrow observation from being treated as a broad market conclusion.
Should every timeframe confirm the same direction?
No. Different timeframes can show different parts of the market structure. Record where they agree and where they differ rather than forcing them into one conclusion.
How can I avoid hindsight bias in my chart journal?
Complete and preserve the original note before reviewing what happened next. Add the later outcome as a separate dated entry instead of editing the first interpretation.
Can a review template guarantee better trading results?
No. A template organizes observations and supports more consistent analysis, but it cannot guarantee outcomes, remove losses, or replace independent judgment and risk management.
Can this template be used with a TradingView indicator?
Yes. Record the indicator name, visible component, chart timeframe, settings that matter, market context, supporting evidence, conflicting evidence, and the question to revisit later.


Recent Comments