
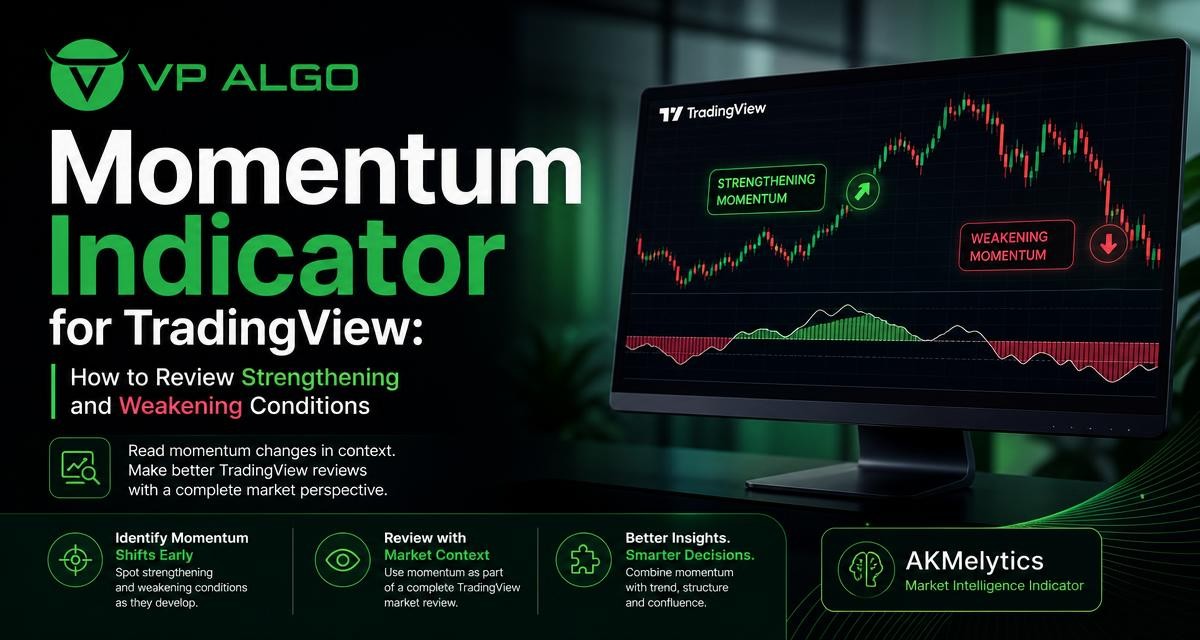
A momentum indicator for TradingView can help traders review whether buying or selling pressure is strengthening, weakening, or becoming less decisive. The most useful approach is not to treat momentum as an automatic buy or sell instruction. Instead, read its changes alongside price structure, trend direction, timeframe context, and the behaviour of the market around important levels.
What a momentum indicator is designed to show
Momentum analysis focuses on the pace and persistence of price movement. A rising market may still have weakening momentum if each new advance is smaller than the previous one. Likewise, a market that is moving sideways may begin to show strengthening momentum before a clear directional move becomes visible on the price chart.
On TradingView, momentum can be reviewed through a dedicated oscillator, a broader trading indicator, or a combination of price and indicator behaviour. The exact calculation depends on the tool being used, so the practical task is to understand what the indicator is measuring and how its readings relate to recent price action.
Strength is about change, not only direction
A positive reading does not automatically mean that conditions are improving. The reading may remain positive while declining, which can suggest that upward pressure is losing force. Similarly, a negative reading can begin rising while price is still below a recent high, indicating that selling pressure may be easing rather than that a confirmed reversal has already occurred.
This is why traders often review the slope, sequence, and location of momentum rather than relying on one isolated value. The question is not simply whether momentum is above or below a reference line. It is whether the latest change supports or conflicts with what price is doing.
How to identify strengthening momentum
Strengthening momentum generally means that directional pressure is becoming more pronounced. In an upward move, this may appear as a sequence of higher price swings accompanied by rising momentum readings. In a downward move, it may appear as lower price swings and increasingly negative readings.
Several observations can support the idea that momentum is strengthening:
- The indicator is moving in the same direction as the current price trend.
- Successive readings show increasing directional pressure rather than a flat or declining sequence.
- Price is breaking from a consolidation area with follow-through instead of immediately returning to the range.
- The momentum change is visible on more than one relevant timeframe.
- Market structure does not contradict the direction suggested by the indicator.
These observations are context, not confirmation of a profitable trade. A strong momentum reading can appear late in a move, after much of the price movement has already occurred. It can also fade quickly when price reaches a significant area or when market conditions become less active.
Strengthening momentum during a continuation move
Suppose an asset forms a series of higher highs and higher lows. If the momentum indicator also turns upward after a pullback and begins to improve as price resumes its advance, the two forms of information are aligned. This can help a trader describe the market as having improving bullish pressure.
The same principle applies in a declining market. Lower highs and lower lows accompanied by a renewed move lower in the momentum reading may indicate that bearish pressure is continuing. The indicator is useful here because it adds information about the pace of the move, while price structure shows how that pressure is being expressed on the chart.
How to identify weakening momentum
Weakening momentum means that the existing directional move is losing force. It does not necessarily mean that price will reverse immediately. A market can continue rising with weaker momentum, or continue falling after selling pressure starts to fade. Weakness should therefore be treated as a reason to review the setup more carefully, not as a standalone reversal signal.
Common signs of weakening momentum include:
- Price reaches a new extreme while the momentum reading fails to make a comparable extreme.
- The indicator turns against the prevailing move while price continues in the original direction.
- Successive price pushes become shorter or less decisive.
- Momentum begins to flatten near a key price area.
- A breakout is followed by limited follow-through and a return toward the breakout zone.
Divergence needs context
Divergence is one way traders compare price behaviour with momentum behaviour. For example, price may form a higher high while the indicator forms a lower high. This can suggest that the latest upward push has less internal strength than the earlier push. A bearish divergence is not proof that price must fall, however. It may lead to a pullback, a period of consolidation, or no immediate change at all.
Use divergence as a prompt for further review. Check whether price is near a prior high, support or resistance area, a clear structural level, or a larger-timeframe zone. Also consider whether the market has enough follow-through to validate the apparent weakness. A single divergence in isolation is less informative than divergence supported by changing structure and failed continuation.
Combining momentum with a trend indicator for TradingView
A momentum indicator answers questions about pressure and pace. A trend indicator for TradingView is generally used to frame the broader direction or to distinguish directional movement from a less organised market. Combining the two can reduce the temptation to interpret every short-term momentum change as a major market shift.
| Observation | Momentum reading | Trend context | Review implication |
|---|---|---|---|
| Price makes higher highs and higher lows | Momentum rises with the advance | Upward trend structure remains intact | Conditions are aligned, but entry timing and risk still require separate review |
| Price rises while momentum declines | Directional pressure is weakening | Trend may still be upward | Review continuation strength, nearby levels, and possible consolidation |
| Price remains in a range | Momentum moves back and forth | No clear directional trend | Avoid assigning trend meaning to every short-term indicator movement |
| Price breaks from a range | Momentum expands in the breakout direction | New direction is developing | Check whether follow-through holds and whether the breakout is accepted |
| Price falls below a structural low | Momentum becomes more negative | Downward pressure is supported | Review the move across suitable timeframes and identify invalidation conditions |
Alignment does not remove uncertainty. It simply gives the trader a clearer way to describe the current condition. When momentum and trend disagree, the disagreement itself is useful information. It may point to a pullback within a larger trend, a possible transition, or a market that lacks a clean directional bias.
Use market structure to confirm the story
Market structure provides a price-based framework for interpreting momentum. Higher highs and higher lows usually describe a different environment from lower highs and lower lows, even when an indicator produces a similar short-term reading. Structure can help prevent a trader from giving too much weight to a temporary oscillator movement.
Questions to ask about structure
- Has price created a meaningful swing high or swing low?
- Is the latest move breaking a previous structural point or remaining inside an established range?
- Did momentum improve before, during, or after the structural change?
- Has price held the new area after the break, or quickly returned to the prior range?
- Does the higher timeframe support the direction seen on the current chart?
For example, improving bullish momentum inside a broad range may simply reflect movement from the lower part of that range toward its midpoint or upper boundary. The reading may be useful, but it has a different meaning from improving momentum that accompanies a sustained break above a well-defined structural high.
A market structure indicator can make this review more systematic by highlighting relevant structural changes, but the displayed information still needs to be interpreted in relation to price. No indicator can replace the need to define what would support or invalidate a market view.

Review momentum across multiple timeframes
Momentum is timeframe-dependent. A chart may show weakening momentum on a short timeframe while the larger trend remains constructive. Conversely, a short-term rise in momentum may occur inside a broader decline. Multi-timeframe review helps separate a local fluctuation from a wider change in market conditions.
A practical review can begin with the higher timeframe to establish broad direction, continue with an intermediate timeframe to examine structure, and then use a lower timeframe to study the immediate movement. The exact timeframes depend on the trader’s method and the market being reviewed. There is no single timeframe combination that is appropriate for every participant.
When the readings disagree, record the disagreement instead of forcing a conclusion. For instance, higher-timeframe momentum may be declining while lower-timeframe momentum is rising. That may describe a countertrend bounce, but it does not by itself establish how far the bounce can travel or whether a larger reversal is developing.
A structured TradingView momentum review
A repeatable checklist can make indicator analysis less reactive. The purpose is to describe the chart before considering a possible setup, rather than allowing a single colour change or cross to determine the entire interpretation.
- Start with price. Identify the current trend, range, recent swing points, and important areas where price has reacted.
- Read the momentum direction. Note whether the indicator is rising, falling, flattening, or changing direction.
- Compare momentum with price. Ask whether the latest price movement is supported by a similar change in pressure.
- Check for divergence. If price and momentum disagree, record the disagreement and look for structural evidence.
- Review the higher timeframe. Decide whether the current movement is consistent with or opposite to the broader context.
- Define uncertainty. Identify what future price behaviour would support the current reading and what would weaken it.
- Apply risk controls separately. Momentum analysis does not determine position size, acceptable loss, or whether a trade is suitable for an individual.
This process can be used with a standalone momentum tool or with a broader market intelligence indicator. The advantage of a broader review is that trend, momentum, structure, and other chart observations can be considered together instead of being read as unrelated signals.
How a market intelligence indicator can support the review
VP ALGO TRADING develops and sells TradingView indicators and algorithmic trading tools, including the AKMelytics – Market Intelligence Indicator. A tool of this type can provide a structured workspace for reviewing market conditions rather than requiring the trader to inspect every element independently.
The relevant features for a momentum-focused review may include trend analysis, momentum evaluation, market structure, institutional activity, multi-timeframe trend assessment, and smart money analysis, depending on the product configuration and displayed information. These elements should be treated as analytical inputs. They do not turn an indicator into a financial adviser, and they do not guarantee a particular market outcome.
Before using any TradingView trading indicator, learn what each visual element represents, which timeframe it reflects, and whether it is intended for confirmation, context, or alerting. A clear understanding of the tool is more useful than adding a large number of indicators that produce overlapping or conflicting information.
Common mistakes when reading momentum
Treating an extreme reading as an automatic reversal
An extreme reading can remain extreme while a strong trend continues. Rather than assuming an immediate reversal, examine whether price has actually changed structure or only moved quickly in the existing direction.
Buying or selling because of one cross
A cross above or below a reference line can be informative, but it is only one observation. Consider the location of price, the broader trend, and whether the move has follow-through before assigning greater importance to it.
Ignoring range conditions
Momentum tends to change direction frequently inside a range. A trader who interprets every short-term rise as a new uptrend and every short-term fall as a new downtrend may overstate the significance of normal back-and-forth movement.
Using too many similar indicators
Several indicators based on similar price information may appear to provide independent confirmation when they are actually describing the same movement. A simpler chart with clearly defined roles can make analysis easier to review.
Confusing analysis with a decision
A momentum reading describes a market condition; it does not decide whether a trade is appropriate. Trading plans, risk limits, execution rules, and personal circumstances remain separate considerations.
Key takeaways
- A momentum indicator for TradingView is most useful when it is read as a change in pressure, not as an automatic signal.
- Strengthening momentum can support an existing move, while weakening momentum calls for closer review rather than an assumed reversal.
- Trend, market structure, price location, and timeframe context help explain what a momentum change may mean.
- Divergence is a warning for further analysis, not a guarantee of a reversal.
- A broader indicator can organise several forms of market information, but it does not remove uncertainty or trading risk.
Frequently asked questions
What is a momentum indicator for TradingView?
It is a chart-based tool used to review the pace and direction of price movement. Traders use it to assess whether buying or selling pressure appears to be strengthening, weakening, or becoming less decisive.
Does weakening momentum mean that price will reverse?
No. Weakening momentum may precede a pullback, consolidation, or reversal, but price can also continue in the same direction. Confirming the interpretation with market structure and price behaviour is important.
How is a momentum indicator different from a trend indicator for TradingView?
Momentum focuses mainly on the strength or pace of recent movement, while a trend indicator is generally used to frame directional bias. The two can complement each other, particularly when their readings agree or when their disagreement highlights uncertainty.
Why should momentum be reviewed across multiple timeframes?
A reading can be bullish on a short timeframe and bearish on a higher timeframe. Comparing timeframes helps show whether a move is part of a broader trend, a countertrend movement, or a range-bound fluctuation.
Can divergence be used as a standalone trading signal?
Divergence is better treated as a prompt for further investigation. It shows that price and momentum are behaving differently, but it does not establish when a reversal will occur or whether one will occur at all.
Can the AKMelytics – Market Intelligence Indicator replace trading judgement?
No. The indicator is intended to assist with market review and trading-decision analysis, not to provide official financial advice or guarantee results. Traders should understand its information and apply their own process and risk controls.
What should be checked before relying on a TradingView indicator?
Review what the indicator measures, how its readings relate to price and timeframe, and whether its information is being used for context or confirmation. Avoid treating a single display element as a complete trading plan.


Recent Comments