
Learn How to Read AKMelytics on Practical Market Setups
Understanding each AKMelytics component individually is important.
However, the real value comes from understanding how the components work together.
This guide brings together:
- Adaptive Kernel Momentum — AKM
- Market Flow Ribbon
- Bullish and Bearish Alignment
- Bull Transition
- Bear Transition
- Bullish Continuation
- Market structure
- BOS
- CHoCH
- Target Lvl
- Risk Lvl
- Multi-timeframe context
The examples below are designed to help you recognise common market situations and understand how AKMelytics can be used as a structured analytical framework.
The objective is not to memorise signals.
The objective is to learn how to ask:
What is the market telling me through momentum, flow, structure and confirmation?
How to Read Each Example
For every chart example, analyse the market in the same order:
1. Market Flow
Is the ribbon:
- Bullish
- Transitional
- Bearish
2. AKM
Is momentum:
- Positive
- Negative
- Strengthening
- Weakening
3. Trend Structure
Where is price relative to:
- AKM Regression Line
- MA1
- MA2
- Market Flow Ribbon
4. Market Structure
Is price forming:
- Higher Highs
- Higher Lows
- Lower Highs
- Lower Lows
Has BOS or CHoCH occurred?
5. Alignment
Are the key analytical layers supporting the same direction?
6. Transition
Has AKMelytics generated:
- Bull Transition
- Bear Transition
7. Trade Planning
Where are:
- Target Lvl
- Risk Lvl
- Nearby support
- Nearby resistance
Use this sequence throughout the examples below.
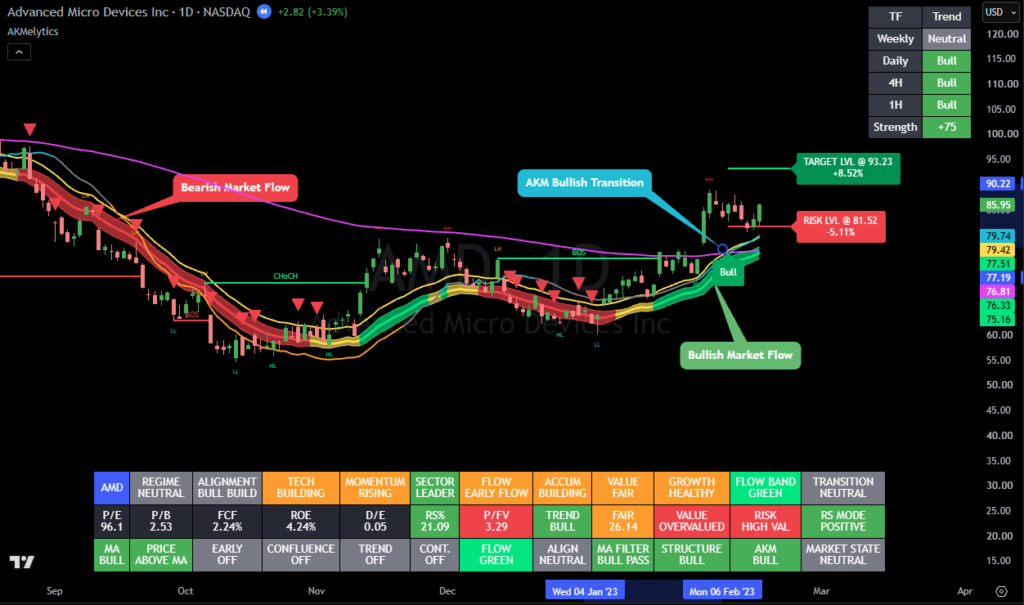
Bearish Market Improving Into a Bull Transition
Example 1 — Bearish Market Improving Into a Bull Transition
Market Condition
The stock begins in a weak market environment.
Typical conditions may include:
- Bearish Market Flow Ribbon
- Negative AKM
- Price below major trend references
- Distribution
- Lower High / Lower Low structure
At this stage, the broader evidence remains bearish.
There is no need to assume that every green candle represents a reversal.
First Sign of Improvement
AKM begins to improve.
The negative momentum reading becomes less severe.
Momentum acceleration may turn positive.
This tells us:
Bearish momentum is weakening.
However, the broader market is not necessarily bullish yet.
Market Flow Moves to Transitional
The Market Flow Ribbon changes from bearish toward transitional.
This is an important development.
It suggests:
- Selling pressure may be weakening
- Participation may be improving
- The previous bearish regime may be losing strength
But this is still not full Bull confirmation.
Structure Begins to Improve
Price may then break above a previous Lower High.
This creates:
Bullish CHoCH
The structural message is:
The previous bearish sequence has been challenged.
At this stage, several conditions are beginning to improve:
- AKM
- Market Flow
- Structure
But the new bullish trend is not yet fully established.
Bull Transition
If the AKMelytics bullish architecture subsequently qualifies, the indicator may print:
Bull
This represents the Bull Transition event.
The Bull Transition means that AKMelytics has identified a sufficiently important change from the previous market cycle.
It should not be interpreted as a guarantee that price will continue higher.
What to Look for After the Bull Transition
After the transition, look for:
- Positive AKM
- Bullish Market Flow
- Price holding above the trend framework
- Higher Low formation
- Bullish BOS
- Improving accumulation
- Relative-strength improvement
The strongest confirmation occurs when the new bullish structure begins to sustain itself.
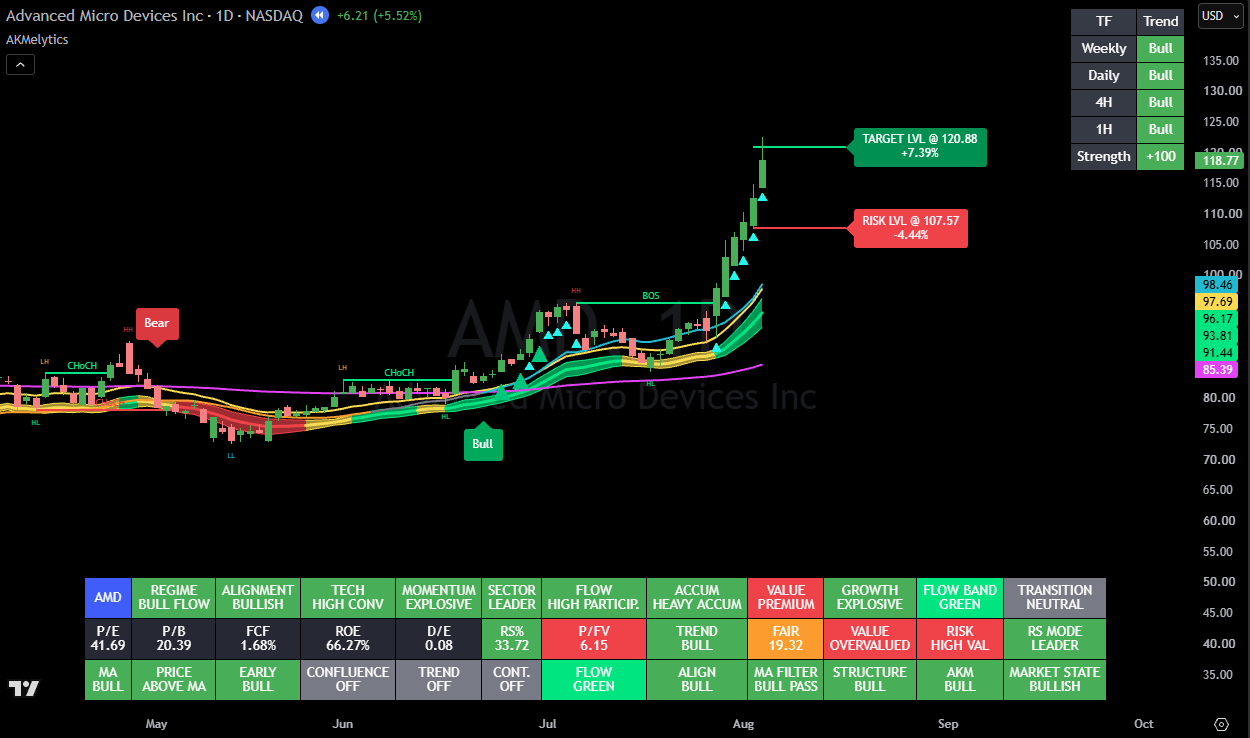
Bullish Continuation
Example 2 — Bullish Trend Continuation
Market Condition
In this example, the market is already bullish.
Typical conditions may include:
- Positive AKM
- Bullish Market Flow Ribbon
- Price above MA1 and MA2
- Higher High / Higher Low structure
- Accumulation
- Positive relative strength
The Bull Transition may already have occurred earlier.
Therefore, the objective is no longer to identify the initial transition.
The objective is to determine whether the bullish structure remains healthy.
Higher Low Formation
Price retraces after an advance.
The pullback remains controlled.
Instead of breaking the previous major structural low, price forms a:
Higher Low
AKM may weaken slightly during the pullback without becoming strongly bearish.
The Market Flow Ribbon may remain bullish or transition temporarily.
This can be normal behaviour inside an established trend.
Bullish Continuation
If price retraces toward the Market Flow Ribbon and subsequently recovers while the required conditions remain supportive, AKMelytics may display:
Bullish Continuation
This is different from a Bull Transition.
Bull Transition
Represents a higher-level change in market cycle.
Bullish Continuation
Represents a potential continuation opportunity after a previous bullish condition.
Bullish BOS
Price later breaks above the previous structural high.
This produces:
Bullish BOS
The BOS provides structural evidence that the bullish sequence is continuing.
The combination:
Positive AKM + Bullish Market Flow + Higher Low + Bullish Continuation + Bullish BOS
provides stronger analytical confluence.
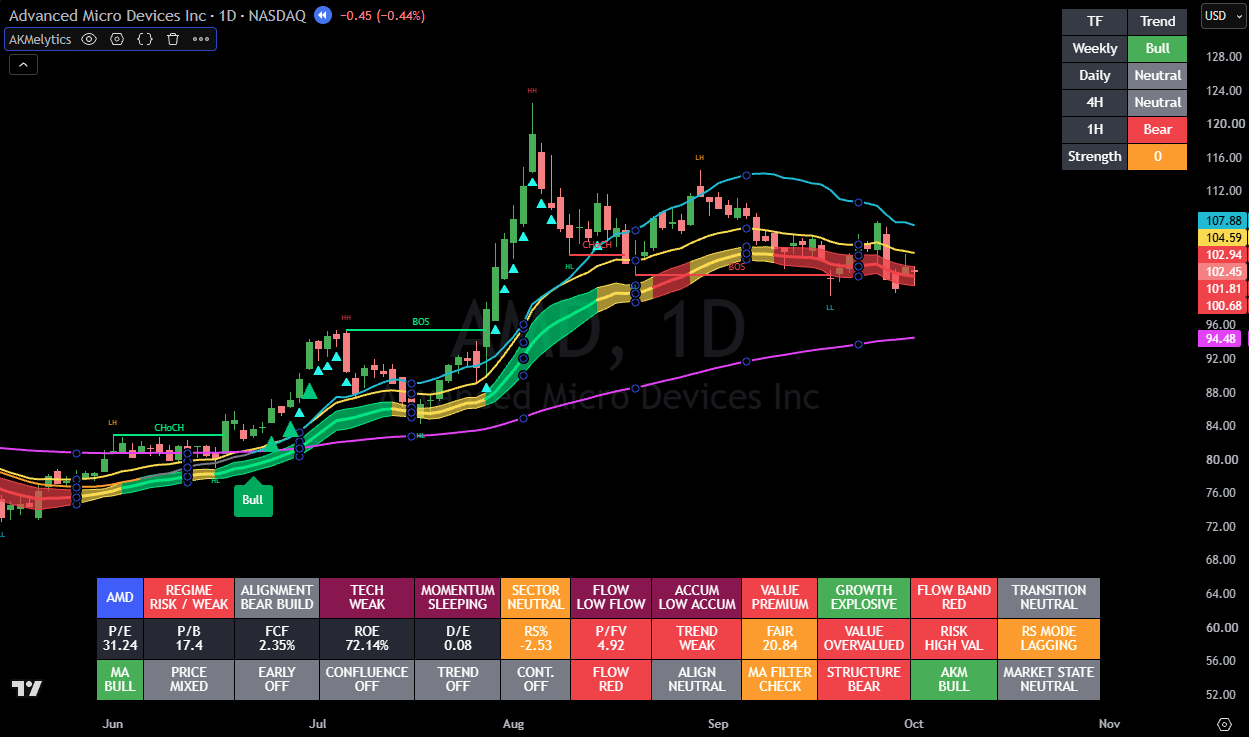
Bullish Price but AKM Is Weakening
Example 3 — Bullish Price but AKM Is Weakening
This example demonstrates why AKMelytics does not rely on price direction alone.
Market Condition
Price continues moving higher.
At first glance, the trend still looks bullish.
However:
- AKM remains positive but begins falling
- Momentum acceleration becomes negative
- Price makes smaller advances
- Volume participation begins weakening
This creates a situation where:
Price remains bullish, but the quality of momentum is deteriorating.
Why This Matters
A conventional trend indicator may continue showing bullish conditions because price remains above its moving average.
AKM provides additional information:
The bullish trend remains active, but the momentum supporting it is weakening.
This does not automatically mean price will reverse.
Possible outcomes include:
- Consolidation
- Pullback
- Momentum reset
- Trend continuation
- Bearish transition
What to Watch Next
Monitor:
- AKM crossing its signal
- Market Flow changing to transitional
- Lower High formation
- Bearish CHoCH
- Increasing distribution
The more of these conditions that appear together, the stronger the evidence that the existing trend is deteriorating.
Example 4 — Bullish CHoCH That Fails
Not every structural transition succeeds.
This is one of the most important examples for new users.
Initial Condition
The market is bearish.
Price forms:
- Lower High
- Lower Low
- Lower High
Then price rallies.
A previous Lower High is broken.
This creates:
Bullish CHoCH
Why CHoCH Is Not Enough
The structural break suggests that the previous bearish sequence has been challenged.
However:
- Market Flow may remain bearish
- AKM may remain weak
- Volume may remain low
- Accumulation may not improve
The CHoCH alone does not prove that a sustainable Bull trend has begun.
Failed Transition
Price subsequently fails to form a meaningful Higher Low.
AKM weakens.
The Market Flow Ribbon returns bearish.
Price breaks below the previous low.
The bullish transition attempt has failed.
Key Lesson
CHoCH identifies potential change.
It does not guarantee reversal.
A stronger transition normally requires additional confirmation from:
- AKM
- Market Flow
- Volume
- Higher Low
- Bullish BOS
- Bull Transition
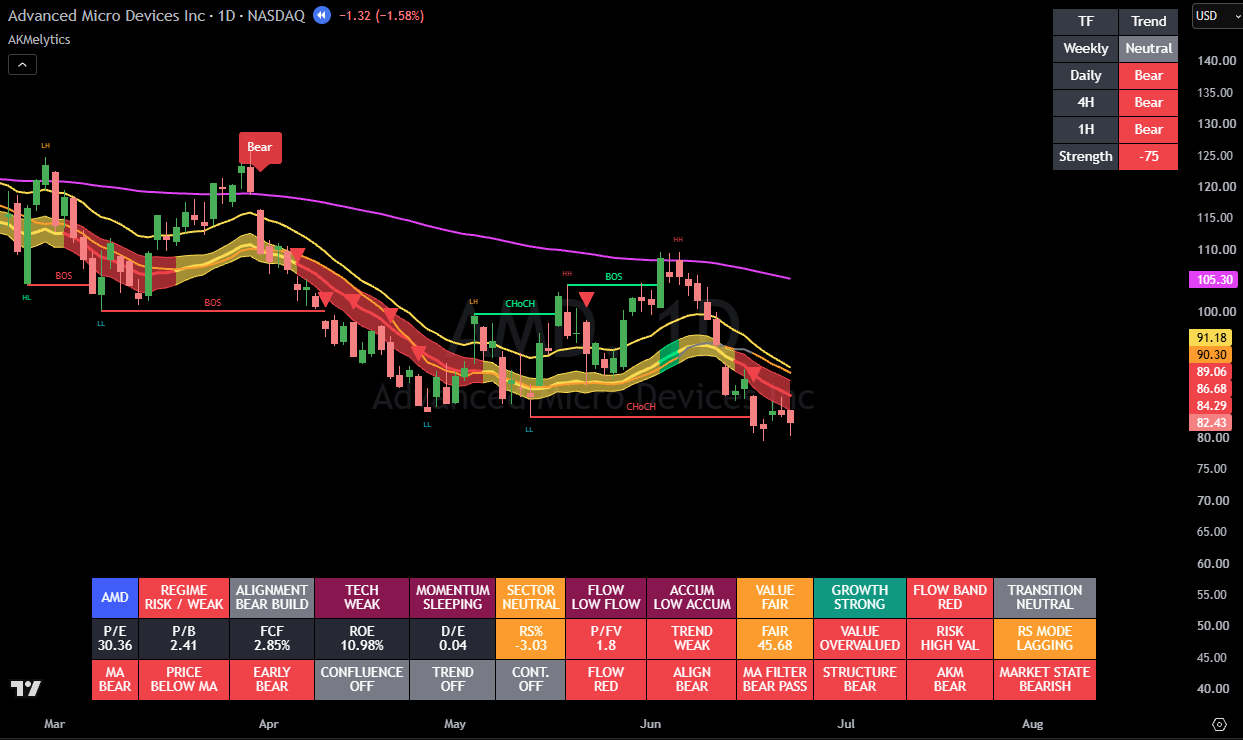
False Bullish Breakout
Example 5 — False Bullish Breakout
This example demonstrates why price breakouts should be analysed together with market participation.
Setup
Price breaks above a visible resistance level.
The breakout candle appears bullish.
However:
- Market Flow remains bearish or transitional
- AKM is weak
- Relative volume is low
- Accumulation remains weak
The breakout therefore lacks broader confirmation.
What Happens Next
Price fails to hold above resistance.
The breakout reverses.
Price returns below the previous level.
This is an example of a breakout that looked strong from price alone but lacked sufficient confluence.
Stronger Breakout Comparison
A stronger breakout would normally have more evidence such as:
- Positive AKM
- Bullish Market Flow
- Higher relative volume
- Strong accumulation
- Bullish BOS
- Price holding above the broken level
The difference is not simply:
Breakout vs no breakout
The difference is:
Breakout with confirmation vs breakout without confirmation
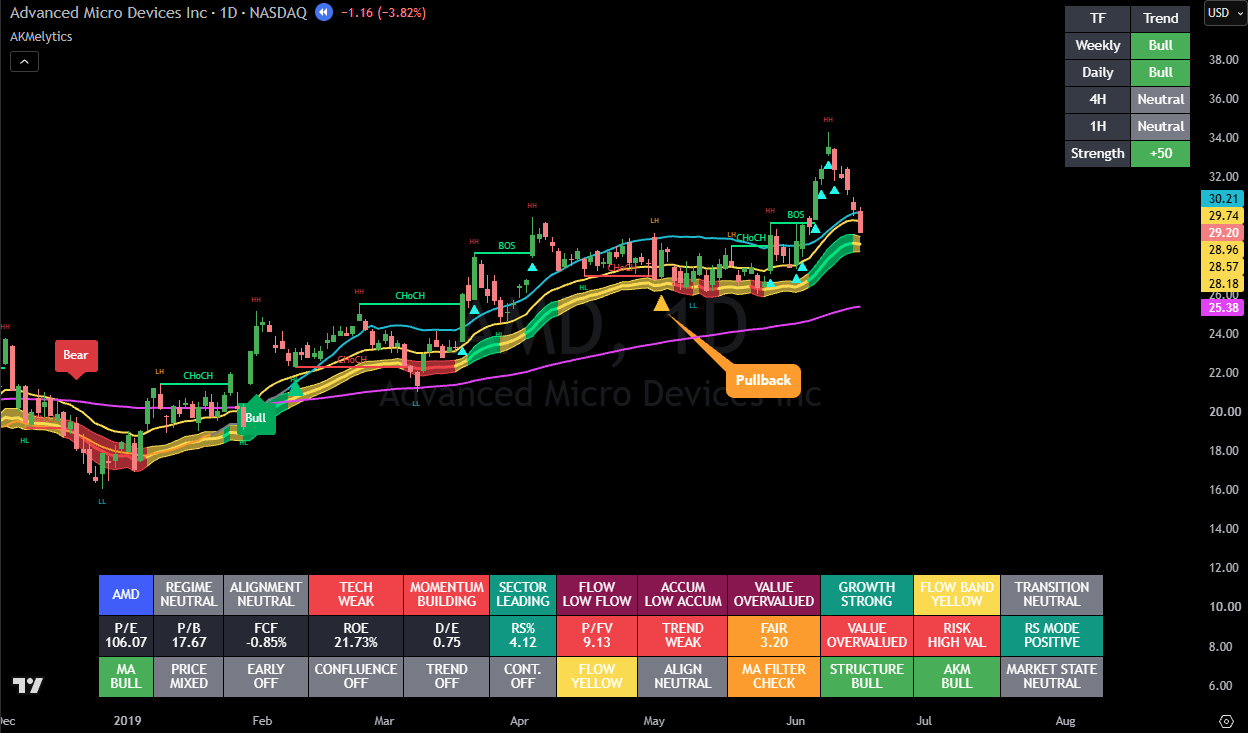 Example 6 — Bull Transition Followed by Pullback
This is one of the most useful AKMelytics patterns for traders who do not want to chase the first directional move.
Step 1 — Bull Transition
AKMelytics identifies a Bull Transition.
The new bullish cycle has begun according to the transition engine.
Price then moves higher.
Step 2 — Price Becomes Extended
After the initial move, entering immediately may provide less attractive risk/reward.
Price may now be significantly above:
- Market Flow Ribbon
- AKM Regression Line
- MA1
Instead of chasing, the trader watches for a controlled pullback.
Step 3 — Pullback Into the Ribbon
Price retraces toward the Market Flow Ribbon.
Important conditions remain constructive:
- AKM remains positive or stabilises
- Market Flow remains bullish or transitional
- Broader trend structure remains intact
- Price does not break important support
Step 4 — Bullish Recovery
A bullish recovery candle forms.
Price reclaims the ribbon.
AKMelytics may then display:
Bullish Continuation
This can provide a more structured continuation reference than entering after the initial extended move.
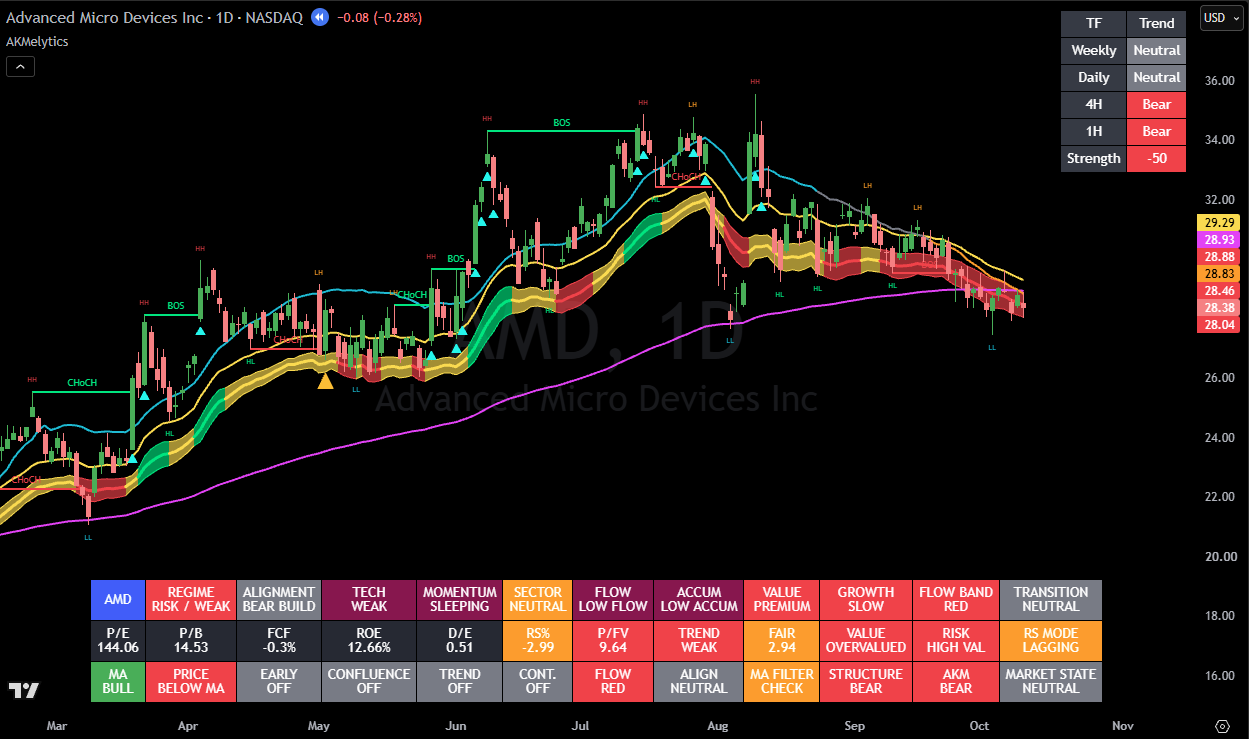
Mature Bull Trend Into Bear Transition
Example 7 — Mature Bull Trend Into Bear Transition
Now examine the opposite transition.
Initial Market Condition
The stock has been in a healthy bullish trend.
Conditions may include:
- Positive AKM
- Bullish Market Flow
- Higher Highs
- Higher Lows
- Accumulation
- Price above trend references
Momentum Begins Weakening
AKM begins declining.
Momentum acceleration turns negative.
Price may still continue higher briefly.
This is the first warning that the bullish trend is losing momentum.
Market Flow Becomes Transitional
The Market Flow Ribbon changes from bullish toward transitional.
This indicates that broader participation is no longer as strongly supportive.
Bearish CHoCH
Price then breaks below an important Higher Low.
This creates:
Bearish CHoCH
The existing bullish structure has been challenged.
Lower High Formation
Price rebounds but fails to regain the previous high.
A:
Lower High
begins forming.
This is additional evidence that market structure may be transitioning.
Bear Transition
If AKMelytics subsequently qualifies the bearish architecture, a:
Bear Transition
can appear.
This identifies a higher-level transition into the bearish cycle.
Bearish BOS
Price later breaks below another important structural low.
This creates:
Bearish BOS
The sequence now becomes:
Bull Trend → AKM Weakening → Transitional Flow → Bearish CHoCH → Lower High → Bear Transition → Bearish BOS
This is a much stronger bearish narrative than simply reacting to the first red candle.
Example 8 — Sideways Market
AKMelytics can also help identify when the market does not provide a strong directional environment.
Sideways Characteristics
Typical conditions may include:
- AKM near neutral
- Weak regression quality
- Market Flow frequently transitional
- Price crossing the ribbon repeatedly
- MA1 and MA2 flattening
- Frequent minor BOS / CHoCH events
- Low participation
This environment can generate many small technical changes without establishing a sustainable trend.
Why Sideways Markets Are Difficult
A bullish crossover may quickly reverse.
A breakout may fail.
A structural break may occur without follow-through.
The market lacks enough directional commitment.
AKMelytics Interpretation
Instead of forcing a Bull or Bear conclusion, the appropriate interpretation may simply be:
Neutral / Wait
This is an important result.
The absence of a strong setup is useful information.
Suggested Screenshot Labels
1 — Flat AKM
2 — Transitional Ribbon
3 — Price Crossing Ribbon Repeatedly
4 — Mixed Structure
5 — Neutral / Wait
Example 9 —
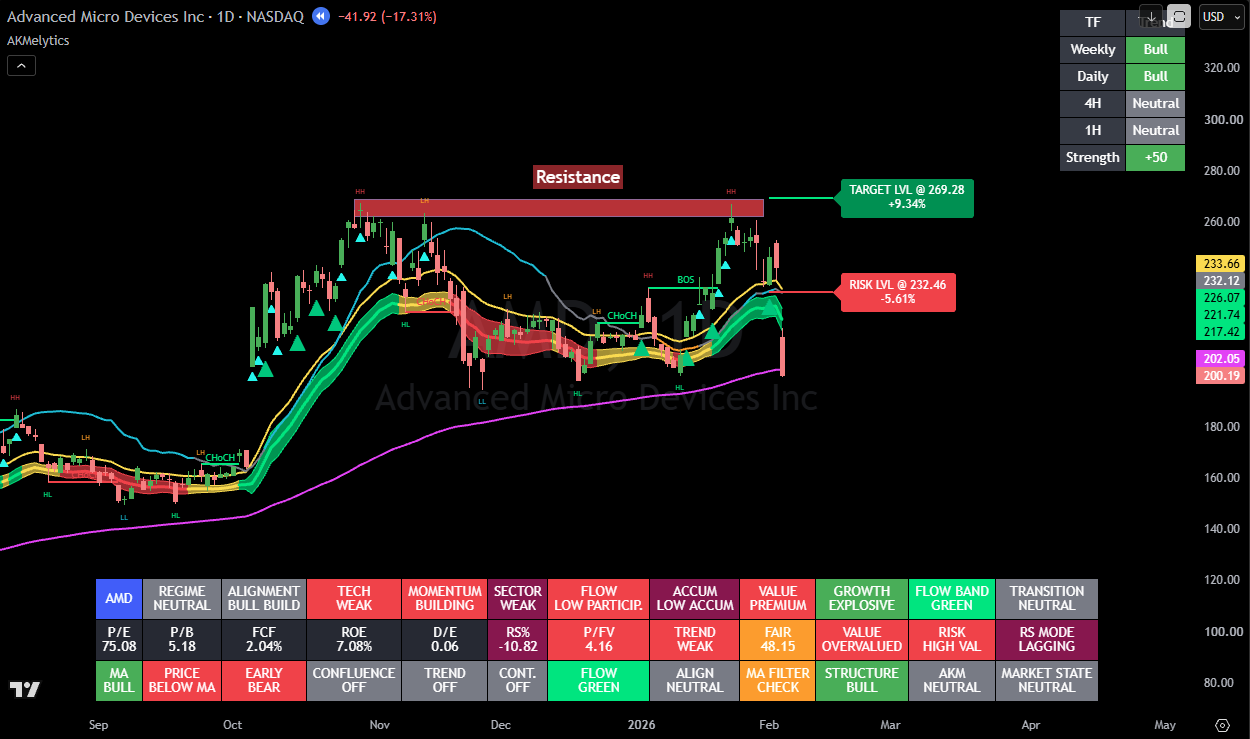
Bullish Setup With Poor Risk-to-Reward
A technically valid signal is not automatically an attractive trade.
Setup
Suppose AKMelytics shows:
- Positive AKM
- Bullish Market Flow
- Bullish structure
- Bull Transition or alignment
- Target Lvl
- Risk Lvl
At first glance, the setup looks constructive.
Structural Problem
However, major resistance is located just above the entry.
For example:
Entry reference: 100
Target Lvl: 106
Major resistance: 101.50
Risk Lvl: 97
The technical signal may be valid.
But the immediate structural reward is relatively limited.
Key Lesson
AKMelytics separates:
Signal quality
from
Trade attractiveness
A valid signal still needs:
- Acceptable reward-to-risk
- Reasonable support/resistance structure
- Appropriate position size
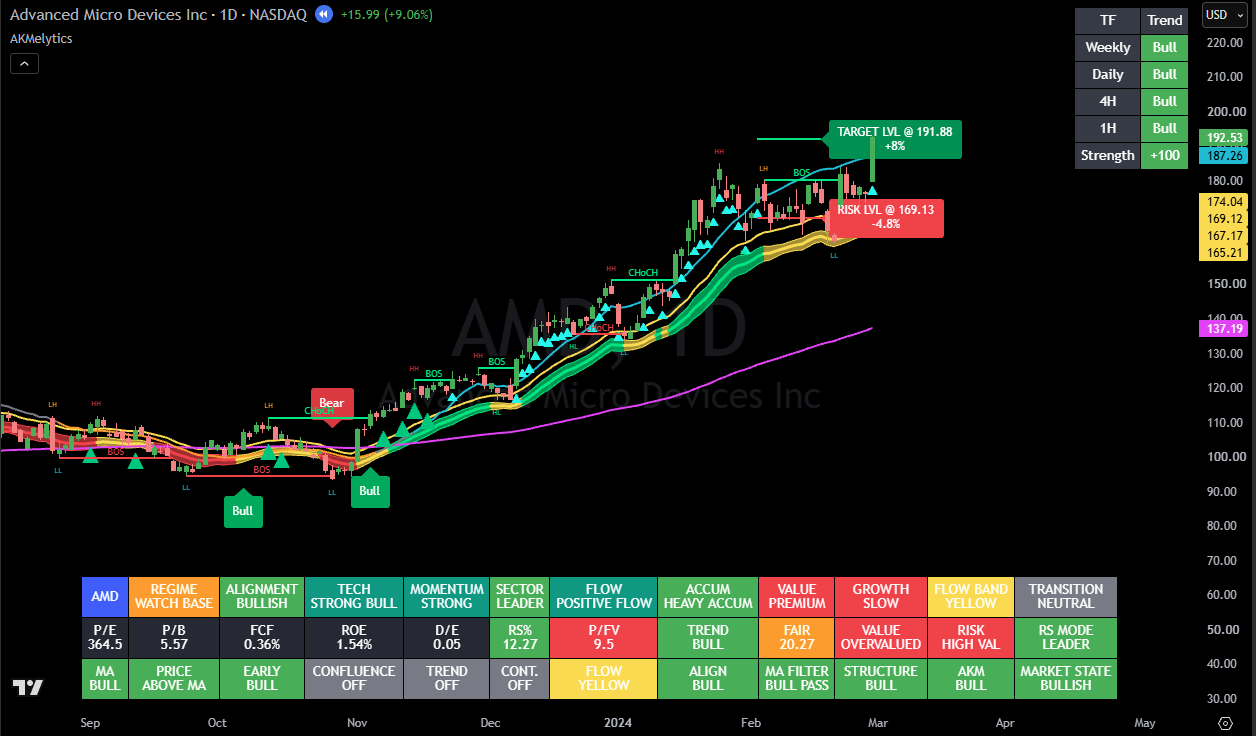
Target Lvl Reached but Trend Continues
Example 10 — Target Lvl Reached but Trend Continues
Target Lvl is a planning reference.
It is not designed to predict the maximum distance of a trend.
Setup
A Bull Transition occurs.
Price advances.
Target Lvl is reached.
However:
- AKM remains positive
- Market Flow remains bullish
- Price continues making Higher Highs and Higher Lows
- No Bearish CHoCH appears
The trend continues beyond Target Lvl.
What This Demonstrates
Target Lvl means:
A volatility-based projection reference
not:
The market must reverse here.
Possible management approaches can include:
- Full exit
- Partial exit
- Trailing remaining exposure
- Following market structure
- Monitoring AKM weakening
The appropriate approach depends on the user’s trading plan.
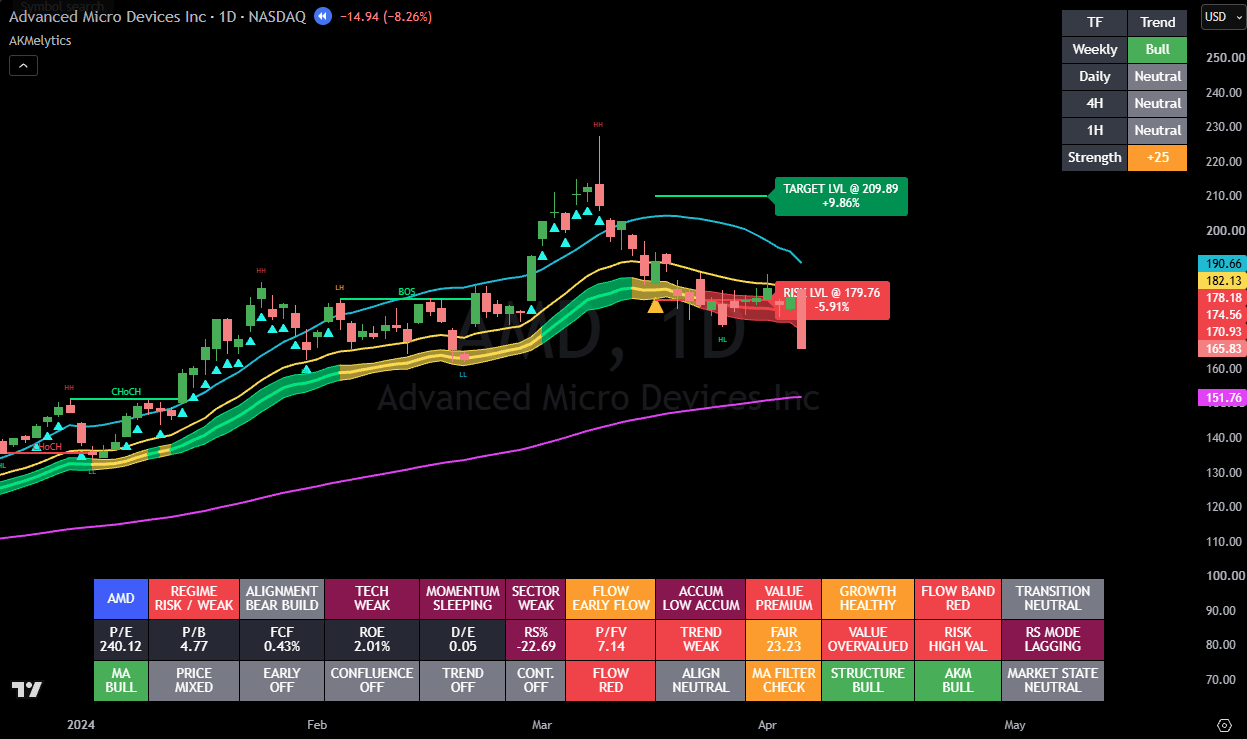
Risk Lvl Crossed and Setup Invalidated
Example 11 — Risk Lvl Crossed and Setup Invalidated
Consider a Bull setup where price subsequently deteriorates.
After the Bull event:
- AKM weakens
- Market Flow turns bearish
- Higher Low fails
- Price crosses Risk Lvl
- Bearish structure develops
The original bullish thesis has materially weakened.
This example demonstrates why Risk Lvl should be considered together with:
- Market structure
- AKM
- Market Flow
- Position sizing
The Risk Lvl is a reference—not a guarantee of exact execution.
Example 12 — Multi-Timeframe Alignment
AKMelytics also provides multi-timeframe trend context.
A stronger bullish environment may look like:
Weekly: Bull
Daily: Bull
4H: Bull
1H: Bull
This represents broad trend alignment.
However, complete multi-timeframe agreement is not required for every opportunity.
Example: Daily Bull With 4H Pullback
Suppose:
Weekly: Bull
Daily: Bull
4H: Bear
1H: Bear
This does not automatically mean the Daily Bull trend has reversed.
The lower timeframes may simply be experiencing a pullback.
If the 4H later produces:
- Bullish CHoCH
- Improving AKM
- Bullish Market Flow
- Bullish BOS
the lower timeframe may be realigning with the higher-timeframe trend.
Multi-Timeframe Workflow
A practical process can be:
Weekly
Understand the major trend.
↓
Daily
Identify the primary AKMelytics condition.
↓
4H
Analyse the active pullback or continuation structure.
↓
1H
Refine timing where appropriate.
Multi-timeframe analysis should provide context rather than forcing every timeframe to show the same condition.
How to Analyse a New AKMelytics Chart
Use this checklist whenever you open a new chart.
Step 1 — Market Flow
Is the ribbon:
- Bullish
- Transitional
- Bearish
Step 2 — AKM
Is momentum:
- Positive
- Negative
- Strengthening
- Weakening
Step 3 — Trend
Where is price relative to:
- AKM Regression Line
- MA1
- MA2
Step 4 — Participation
Is the market showing:
- Accumulation
- Distribution
- Strong Flow
- Weak Flow
Step 5 — Structure
Identify:
- HH
- HL
- LH
- LL
- BOS
- CHoCH
Step 6 — Alignment
Do momentum, flow and structure broadly agree?
Step 7 — Transition
Has AKMelytics recently produced:
- Bull Transition
- Bear Transition
Step 8 — Continuation
Is there a valid Bullish Continuation opportunity?
Step 9 — Multi-Timeframe Context
Does the higher timeframe support or conflict with the setup?
Step 10 — Target & Risk
Does the potential structure justify the risk?
AKMelytics Example Analysis Template
You can use the following format every time you analyse a chart.
Market Regime
Bullish / Transitional / Bearish
AKM
Positive / Negative / Strengthening / Weakening
Market Flow
Bullish / Transitional / Bearish
Trend Structure
Bullish / Bearish / Mixed
Market Structure
HH / HL / LH / LL
BOS / CHoCH / No confirmed break
Participation
Accumulation / Distribution / Neutral
Relative Strength
Leader / Outperforming / Neutral / Lagging
Transition
Bull Transition / Bear Transition / None
Alignment
Bullish / Bearish / Mixed
Continuation
Active / Not Active
Target Lvl
Current target reference
Risk Lvl
Current risk reference
Overall Interpretation
Describe whether the evidence is aligned, developing or conflicting.
Strong Bull Example Checklist
A stronger bullish example may show:
✓ Positive AKM
✓ AKM strengthening
✓ Bullish Market Flow
✓ Price above trend references
✓ Higher Low
✓ Bullish BOS
✓ Accumulation
✓ Positive relative strength
✓ Bull Transition
✓ Acceptable Target/Risk structure
No single condition guarantees success.
The value comes from the confluence.
Strong Bear Example Checklist
A stronger bearish example may show:
✓ Negative AKM
✓ Negative momentum acceleration
✓ Bearish Market Flow
✓ Price below trend references
✓ Lower High
✓ Bearish BOS
✓ Distribution
✓ Weak relative strength
✓ Bear Transition
✓ Acceptable Target/Risk structure
Again, this represents analytical alignment—not certainty.
Mixed Setup Checklist
A mixed setup may look like:
AKM: Bullish
Market Flow: Bearish
Structure: Bearish
Relative Strength: Improving
Transition: None
This should not be interpreted as a fully confirmed Bull setup.
Instead:
Momentum is improving within a broader bearish environment.
That is a developing condition.
The Most Important Lesson From These Examples
AKMelytics should not be read as:
Triangle appears → Trade
or
Bull appears → Buy
or
Bear appears → Sell
The correct analytical process is:
Momentum
↓
Market Flow
↓
Trend
↓
Participation
↓
Structure
↓
Alignment
↓
Transition
↓
Target / Risk
The final chart signal is only one part of the process.
Building Your Own Chart Library
One of the best ways to become familiar with AKMelytics is to save examples.
Create your own library of charts showing:
- Successful Bull Transition
- Failed Bull Transition
- Successful Bear Transition
- Failed Bear Transition
- Bullish Continuation
- Bullish BOS
- Bearish BOS
- Bullish CHoCH
- Bearish CHoCH
- False breakout
- Sideways market
- AKM weakening
- Target reached
- Risk invalidation
Over time, this can help you recognise how AKMelytics behaves across different market environments.
Do Not Judge AKMelytics From One Signal
Every technical system will produce successful and unsuccessful setups.
A useful evaluation requires a meaningful sample across:
- Different stocks
- Different timeframes
- Bull markets
- Bear markets
- Sideways markets
- High-volatility periods
- Low-volatility periods
The objective is not to find a system that never produces a losing setup.
The objective is to understand how the analytical framework behaves under different conditions.
Key Takeaway
The strongest AKMelytics analysis comes from understanding the relationship between the components.
Do not focus only on:
Bull.
Bear.
AKM.
Ribbon.
BOS.
CHoCH.
Target.
Risk.
Instead, ask:
How are these components interacting?
A stronger directional setup generally develops when:
AKM Momentum
Market Flow
Trend
Participation
Market Structure
Alignment
support the same directional thesis.
The Bull or Bear Transition then helps identify when AKMelytics has recognised a significant change in the market cycle.
Next Guide
AKMelytics Settings Reference
The next guide explains every major AKMelytics setting and when you may want to change it.
You will learn:
- Alignment Engine
- MA Filter
- Bullish Continuation
- Dashboard settings
- Visual settings
- AKM Regression Line
- Alignment markers
- Target Lvl and Risk Lvl
- Market Structure
- Structure Fibonacci
- Gann references
- Relative-strength benchmark
- Which settings beginners should leave unchanged
→ Continue to: AKMelytics Settings Reference
Previous Guide
← AKMelytics TradingView Alerts Guide
Educational Use & Risk Disclaimer
The chart examples in this guide are provided for technical-analysis, research and educational purposes.
They are intended to explain how AKMelytics components can be interpreted together and should not be regarded as recommendations to buy, sell or hold any financial instrument.
Historical chart examples are selected with the benefit of known historical outcomes and do not guarantee similar future results.
Bull Transition, Bear Transition, Alignment, BOS, CHoCH, Target Lvl and Risk Lvl are technical analytical references.
Trading and investing involve risk, including possible loss of capital. Users remain responsible for their own research, trade decisions, position sizing and risk management.

