
Using Market Structure to Create Dynamic Price Projection Levels
The AKMelytics Structure Fibonacci engine is designed to create price-projection references from confirmed market structure.
Unlike a traditional Fibonacci tool that requires the trader to manually select two chart points, AKMelytics automatically identifies the relevant structural anchors and activates a new projection when a qualifying Change of Character — CHoCH occurs.
The system connects three important concepts:
Market Structure
↓
CHoCH
↓
Structure-Based Price Projection
The purpose of the feature is to help traders visualize potential price-extension areas after an important structural transition.
Structure Fibonacci should not be interpreted as a prediction that price must reach a particular level.
It provides a mathematical projection framework based on the size of the previous market structure.
What Makes Structure Fibonacci Different?
Traditional Fibonacci analysis often uses common ratios such as:
- 0.382
- 0.500
- 0.618
- 1.272
- 1.618
AKMelytics Structure Fibonacci works differently.
It uses the previous confirmed structural range as the foundation and then projects customizable multiples of that range in the direction of the new structural transition.
The current default values are custom structural projection levels rather than conventional retracement ratios.
This makes Structure Fibonacci primarily a:
Market-structure projection system
rather than a conventional Fibonacci retracement tool.
How the Engine Works
The complete process can be understood as:
Confirmed Swing Structure
↓
HH + HL or LH + LL
↓
CHoCH
↓
Previous Structure Captured
↓
Structure Fibonacci Activated
↓
Projection Levels Extended
↓
Projection Remains Active Until Invalidated or Replaced
The engine therefore requires meaningful market structure before it can create a projection.
Step 1 — AKMelytics Identifies Market Structure
AKMelytics tracks confirmed structural highs and lows.
These are classified as:
HH — Higher High
HL — Higher Low
LH — Lower High
LL — Lower Low
The system stores bullish structure when it has a valid:
HH + HL
and bearish structure when it has a valid:
LH + LL.
These stored structural points later become the anchors for the Structure Fibonacci calculation.
Step 2 — AKMelytics Waits for CHoCH
Structure Fibonacci is not activated by every BOS.
The current engine activates a new projection when AKMelytics detects a confirmed:
Bullish CHoCH
or
Bearish CHoCH.
This is important because CHoCH represents a potential change from the previous market structure.
The projection therefore attempts to answer:
If this structural transition continues, where are the next mathematical extension references relative to the previous structure?
Bearish Structure Fibonacci
A bearish projection is created after a confirmed Bearish CHoCH.
This means the market had previously established bullish structure and then broke below an important Higher Low.
The stored bullish structure contains:
Higher High — HH
and
Higher Low — HL
AKMelytics uses:
Level 0 = HH
Level 1 = HL
Higher positive projection values then extend downward.
Bearish Projection Sequence
Conceptually:
Higher High
↓
Higher Low
↓
Higher Low Broken
↓
Bearish CHoCH
↓
Bearish Structure Fibonacci Activated
↓
Downside Projection Levels
This helps visualize potential downside extension references after the bullish structure has been challenged.
Bearish Anchor Points
For a bearish projection:
Level 0
The previous confirmed:
Higher High
Level 1
The previous confirmed:
Higher Low
The distance between these two levels becomes the structural measurement used for the remaining projections.
Bearish Projection Formula
Conceptually, AKMelytics calculates:
Structure Range = HH − HL
Then each level is derived from:
Projected Price = HH − (Structure Range × Level)
For example:
Previous HH:
110
Previous HL:
100
Structure Range:
10
Then:
Level 0 = 110
Level 1 = 100
Level 2 = 90
Level 3 = 80
Level 4 = 70
The projection extends downward because the structural transition was bearish.
The engine’s calculation uses the stored zero and one anchors with the selected projection multiple.
Default Bearish Levels
The current AKMelytics defaults are:
| Level | Interpretation |
|---|---|
| 0 | Previous HH anchor |
| 1 | Previous HL anchor |
| 2 | Downside extension |
| 3 | Downside extension |
| 4 | Downside extension |
| 5 | Downside extension |
| 6 | Downside extension |
| 9 | Extended downside reference |
These levels are user configurable.
Bullish Structure Fibonacci
A bullish projection is created after a confirmed Bullish CHoCH.
This occurs when the previous market structure was bearish and price closes above an important Lower High.
The stored bearish structure contains:
Lower High — LH
and
Lower Low — LL
AKMelytics uses:
Level 0 = LH
Level 1 = LL
Negative projection values then extend upward.
Bullish Projection Sequence
Conceptually:
Lower High
↓
Lower Low
↓
Lower High Broken
↓
Bullish CHoCH
↓
Bullish Structure Fibonacci Activated
↓
Upside Projection Levels
This creates a mathematical framework for evaluating possible upside extensions following the structural transition.
Bullish Anchor Points
For a bullish projection:
Level 0
The previous confirmed:
Lower High
Level 1
The previous confirmed:
Lower Low
The distance between these points becomes the structural range.
Why Bullish Projection Levels Are Negative
This can initially look unusual.
AKMelytics uses the same structural calculation in both directions.
Because:
Level 0 = LH
and
Level 1 = LL
positive values naturally extend downward.
To project above the Lower High, AKMelytics uses negative multiples.
For example:
Lower High:
100
Lower Low:
90
Structure Range:
10
Then:
Level 0 = 100
Level 1 = 90
Level -2 = 120
Level -3 = 130
Level -4 = 140
The negative number is therefore part of the mathematical projection system.
It does not represent a negative price or bearish interpretation.
Default Bullish Levels
The current defaults are:
| Level | Interpretation |
|---|---|
| 0 | Previous LH anchor |
| 1 | Previous LL anchor |
| -2 | Upside extension |
| -3 | Upside extension |
| -4 | Upside extension |
| -5 | Upside extension |
| -6 | Upside extension |
| -8 | Extended upside reference |
| -9 | Extended upside reference |
These values can be customized from the AKMelytics settings.
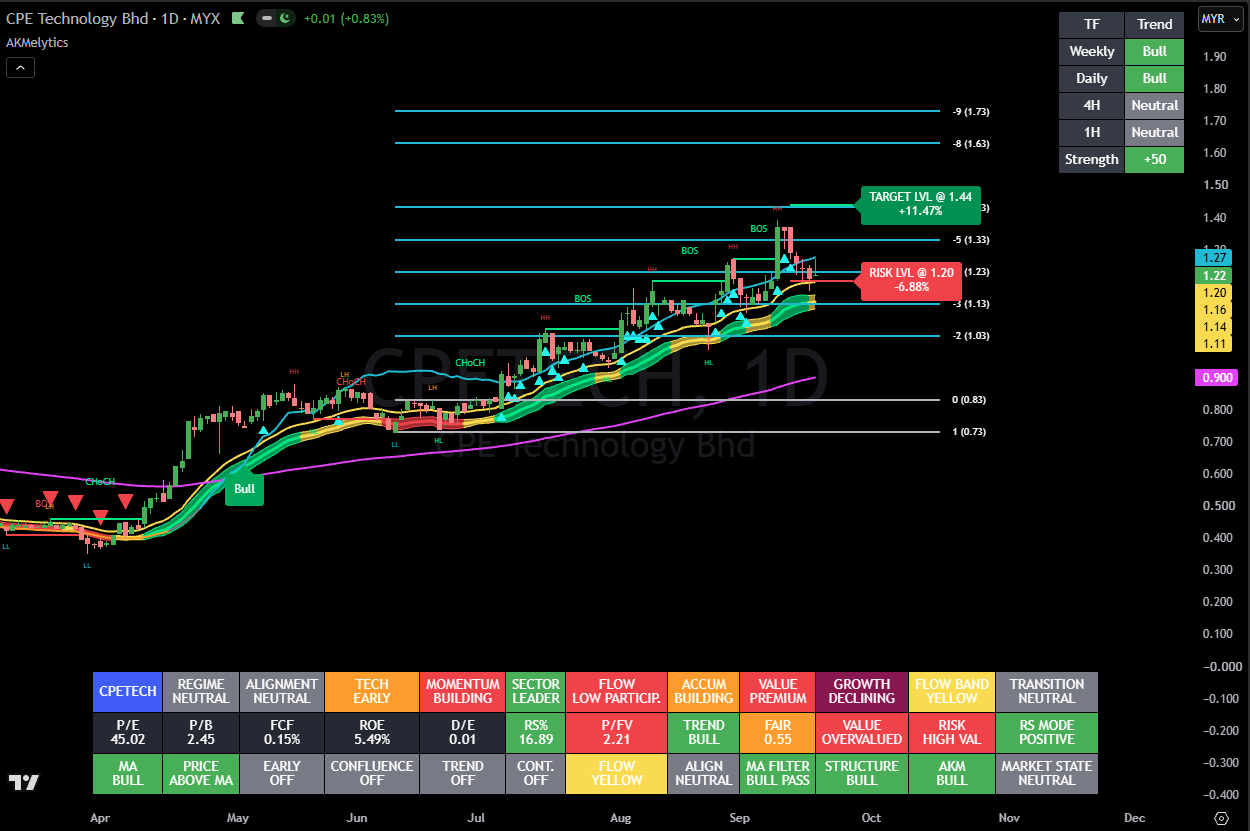
Bullish Structure Fibonacci
Example — Bullish Structure Fibonacci
Imagine a bearish market structure:
Lower High = 50
Lower Low = 45
Price subsequently rallies and closes above 50.
This produces:
Bullish CHoCH
The structure range is:
50 − 45 = 5
Using the default levels:
Level 0 = 50
Level 1 = 45
Level -2 = 60
Level -3 = 65
Level -4 = 70
and so on.
These levels become potential structural projection references.
They do not mean price is expected to reach every level.
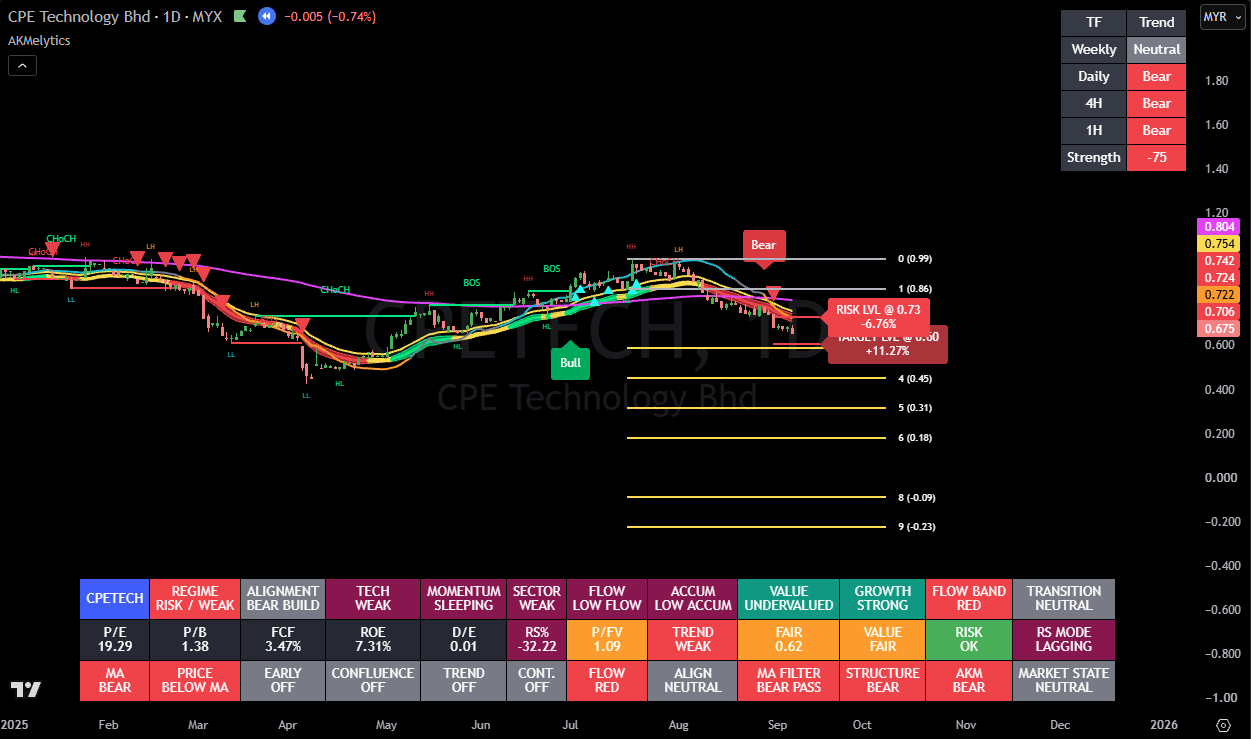
bearish Structure Fibonacci
Example — Bearish Structure Fibonacci
Suppose the market previously formed:
Higher High = 80
Higher Low = 72
Price later closes below the Higher Low.
This produces:
Bearish CHoCH
Structure Range:
80 − 72 = 8
Projection:
Level 0 = 80
Level 1 = 72
Level 2 = 64
Level 3 = 56
Level 4 = 48
and so on.
Again, these are projection references rather than forecasts.
Why CHoCH Activates the Projection
CHoCH represents an important structural event because price has broken against the direction of the previous structure.
For example:
Previous Bull Structure
HH → HL → HH
Then price breaks below the Higher Low.
This creates:
Bearish CHoCH
AKMelytics then uses the previous HH/HL structure to create the bearish projection.
The bearish CHoCH therefore becomes the event that activates the new downside map.
Bullish CHoCH Activation
For a bullish projection, AKMelytics requires:
- Previous bearish LH/LL structure
- Confirmed bullish structural break
- Stored bearish structural anchors
- Structure Fibonacci enabled
When those requirements are present, the existing projection is removed and a fresh bullish projection is created.
Bearish CHoCH Activation
For a bearish projection, AKMelytics requires:
- Previous bullish HH/HL structure
- Confirmed bearish structural break
- Stored bullish structural anchors
- Structure Fibonacci enabled
The previous Fibonacci projection is removed and a fresh bearish projection is created.
Only the Current Projection Is Displayed
AKMelytics is designed to focus on the active structure projection.
When a new qualifying Structure Fibonacci setup is activated, the previous projection lines and labels are deleted before the new ones are drawn.
This helps avoid filling the chart with numerous overlapping historical projection sets.
Projection Levels Extend With the Chart
Once Structure Fibonacci is active, AKMelytics continually moves the right-hand endpoint of the current projection forward as new candles develop.
This keeps the active levels visible while the market progresses.
The number of bars shown ahead of the current candle is controlled by:
Extend Lines Bars
Projection Invalidation
A Structure Fibonacci projection does not necessarily remain valid forever.
AKMelytics contains separate invalidation logic for bullish and bearish projections.
Bearish Projection Invalidation
After a Bearish CHoCH, the bearish projection uses:
HH = Level 0
HL = Level 1
The projection becomes invalid if price subsequently closes back above the stored Level 1 / Higher Low reference.
In the current engine:
Bearish projection invalidation occurs when the close moves above the active Level 1 anchor.
This suggests that the bearish structural transition has failed to maintain its break below the previous Higher Low.
Bullish Projection Invalidation
After a Bullish CHoCH, the bullish projection uses:
LH = Level 0
LL = Level 1
The bullish projection is invalidated when price closes back below the active Level 0 / Lower High anchor.
This indicates that price has failed to maintain the breakout above the previous Lower High.
Delete When Invalidated
The setting:
Delete When Invalidated
controls whether the projection disappears after invalidation.
Default:
ON
When enabled:
- The projection lines are removed
- Labels are removed
- The active structure projection is reset
The engine then waits for another valid structural transition.
Why Invalidation Matters
Projection levels only have meaningful context while the structural thesis remains valid.
For example:
A Bullish CHoCH occurs.
AKMelytics creates an upside projection.
Price immediately collapses back below the broken Lower High.
The original bullish structural change has failed.
Keeping the old bullish projection active could become misleading.
The invalidation system helps prevent that.
Structure Fibonacci vs BOS
One of the most important distinctions is:
CHoCH
Activates Structure Fibonacci.
BOS
Provides subsequent evidence that the developing structure may be continuing.
For example:
Bear Trend
↓
Bullish CHoCH
↓
Bullish Structure Fibonacci Activated
↓
Higher Low
↓
Bullish BOS
The CHoCH starts the structural projection.
The later BOS may strengthen the case that the new bullish structure is becoming established.
Structure Fibonacci Does Not Require Price to Reach Every Level
Price may:
- Reach only the first extension
- Reverse before any extension
- Consolidate between levels
- Move through several levels quickly
- Continue beyond the final displayed level
The projection is a mathematical reference map.
It is not a sequence that price is required to follow.
Structure Fibonacci and AKM
AKM provides momentum context around the structural transition.
Consider a Bullish CHoCH.
Stronger Context
Bullish CHoCH
AKM improving
Positive acceleration
Good regression quality
This provides stronger momentum confirmation around the structural transition.
Weaker Context
Bullish CHoCH
AKM remains negative
Momentum weakening
The structure has improved, but momentum has not yet confirmed.
The projection still represents the structural event, but the broader analytical context is weaker.
Structure Fibonacci and Market Flow
Market Flow provides another layer of confirmation.
For example:
Bullish CHoCH + Bullish Market Flow
Structure and participation are increasingly aligned.
Bullish CHoCH + Transitional Flow
The structural reversal may be developing before full market-flow confirmation.
Bullish CHoCH + Bearish Flow
Structure has changed, but broader participation remains negative.
This may require more caution.
Structure Fibonacci and Bull Transition
A useful sequence may look like:
Bearish Structure
↓
Bullish CHoCH
↓
Bullish Structure Fibonacci Activated
↓
AKM Improves
↓
Market Flow Improves
↓
Bull Transition
↓
Bullish BOS
The Structure Fibonacci projection can therefore begin before the higher-level Bull Transition.
This makes it useful for mapping the structural change while AKMelytics continues evaluating broader confirmation.
Structure Fibonacci and Bear Transition
The bearish equivalent is:
Bullish Structure
↓
Bearish CHoCH
↓
Bearish Structure Fibonacci Activated
↓
AKM Weakens
↓
Market Flow Deteriorates
↓
Bear Transition
↓
Bearish BOS
The projection provides a structural price map while the market cycle continues developing.
Structure Fibonacci vs Target Lvl
These two AKMelytics tools should not be confused.
| Feature | Structure Fibonacci | Target Lvl |
|---|---|---|
| Basis | Market structure range | ATR volatility |
| Trigger | CHoCH | Qualifying directional event |
| Anchors | HH/HL or LH/LL | Signal closing price |
| Purpose | Structural projections | Volatility-based objective |
| Direction | Based on structural transition | Based on Bull/Bear event |
| Invalidation | Structural anchor failure | Replaced by newer qualifying event |
Target Lvl uses an ATR multiplier from the latest directional event.
Structure Fibonacci instead uses the previous structural range.
When Structure Fibonacci and Target Lvl Align
Suppose:
Bull Transition occurs at 100.
ATR Target Lvl appears at:
112
Structure Fibonacci Level -2 appears at:
111.50
This creates two independent technical references in a similar area:
Volatility projection
and
Structure projection
That area may deserve additional attention.
However, agreement does not guarantee that price will reach or reverse there.
When the Levels Disagree
Suppose:
Target Lvl = 110
Structure Fibonacci extension = 125
This is not necessarily a problem.
They measure different things.
Target Lvl asks:
What is a volatility-adjusted objective from the current directional event?
Structure Fibonacci asks:
What are mathematical extensions based on the previous structural range?
Both can be useful for different purposes.
Structure Fibonacci and Support / Resistance
Always compare projection levels with existing market structure.
A bullish projection level may coincide with:
- Previous swing high
- Historical resistance
- Gap area
- Gann reference
- Target Lvl
A bearish projection may coincide with:
- Previous swing low
- Major support
- Historical demand zone
- Target Lvl
When several independent technical references cluster together, the area may deserve closer analysis.
Structure Fibonacci Settings
The current Structure Fibonacci group includes several user controls.
Show Structure Fibonacci
Default:
ON
Enables or disables the entire projection engine.
Extend Lines Bars
Default:
20
Controls how far beyond the current bar the active projection is displayed.
A higher value produces longer projection lines.
Show Fibonacci Labels
Default:
ON
Displays the ratio / level beside each projection line.
Show Prices
Default:
ON
When enabled, each label includes both:
Projection level
and
Calculated price
For example:
-3 (125.50)
Line Width
Default:
2
Visual setting only.
Line Style
Choices:
- Solid
- Dashed
- Dotted
Default:
Solid
Visual only.
Delete When Invalidated
Default:
ON
Removes the active structure projection when its structural invalidation condition occurs.
For most users, leaving this ON provides the clearest chart.
Bearish Projection Color
Default:
Yellow
Controls the extension lines used for bearish structural projections.
Bullish Projection Color
Default:
Aqua
Controls the bullish projection lines.
Levels 0 and 1 Color
Default:
Silver
The 0 and 1 levels are the structural anchor points rather than extension objectives.
A separate colour helps distinguish the original structure from the projected levels.
Label Text Color
Default:
White
Visual only.
Label Background Transparency
Default:
100
Controls how visible the label background is.
A higher transparency creates a cleaner chart appearance.
Should Beginners Change the Projection Levels?
Generally:
No.
Start with the defaults.
First understand:
- What the anchors represent
- How CHoCH activates the projection
- How the levels behave
- How invalidation works
Changing many projection multiples immediately makes it difficult to compare charts consistently.
Customizing Projection Levels
Advanced users can modify the individual Bullish and Bearish projection values.
This may be useful if you want to test a different structural-extension framework.
For example, you could theoretically use levels such as:
- 1.618
- 2.618
- 3.618
However, that would represent your own modified projection configuration rather than the standard AKMelytics default.
Avoid changing values simply to fit historical price movements.
Why a Structure Fibonacci May Not Appear
If CHoCH appears but no Structure Fibonacci is shown, check the following.
Structure Fibonacci Is Disabled
Check:
Show Structure Fibonacci
Previous Structure Was Not Fully Established
The engine requires a stored structural pair.
For a Bearish projection:
HH + HL
must have been available.
For a Bullish projection:
LH + LL
must have been available.
Without the required previous structure, there are no valid anchors from which to calculate the projection.
Insufficient Historical Data
A newly loaded or recently listed instrument may not have enough confirmed pivots to establish the required structure.
Projection Was Immediately Invalidated
A CHoCH may occur and then fail.
If the structural invalidation condition is met, AKMelytics can remove the projection.
Show Setting Was Turned Off
When Structure Fibonacci is disabled, the existing structure projection is also cleared by the current engine.
Structure Fibonacci Alerts
AKMelytics provides dedicated TradingView alerts for the feature.
These include:
Bullish Structure Fibonacci Activated
Triggered when Bullish CHoCH activates the bullish projection.
Bearish Structure Fibonacci Activated
Triggered when Bearish CHoCH activates the bearish projection.
Bullish Structure Fibonacci Invalidated
Triggered when the bullish structural projection fails.
Bearish Structure Fibonacci Invalidated
Triggered when the bearish structural projection fails.
These are useful for users who want to monitor structural projections without continuously watching the chart.
Example Alert Workflow
You could use:
AKMelytics Bull / Bear Transition
as the primary Master alert
together with:
Bullish Structure Fibonacci Activated
and
Bearish Structure Fibonacci Activated
This creates two different forms of information.
Structure Alert
Tells you:
An important structural transition has occurred.
Master Transition Alert
Tells you:
The wider AKMelytics directional architecture has qualified a Bull or Bear cycle transition.
The two do not have to occur on the same bar.
Suggested Bullish Workflow
When a bullish Structure Fibonacci appears:
1. Identify the Bullish CHoCH
Confirm which Lower High was broken.
2. Check the Anchors
Level 0 should represent the previous LH.
Level 1 should represent the previous LL.
3. Check AKM
Is momentum improving?
4. Check Market Flow
Is the market moving from bearish toward transitional or bullish?
5. Check Volume
Is participation supporting the change?
6. Watch for Bull Transition
Has the higher-level AKMelytics transition qualified?
7. Watch for Bullish BOS
Does the new structure continue?
8. Compare Projection Levels
Look for overlap with:
- Target Lvl
- Resistance
- Previous highs
Suggested Bearish Workflow
For a bearish Structure Fibonacci:
1. Identify Bearish CHoCH
Which Higher Low was broken?
2. Confirm the Anchors
Level 0:
Previous HH.
Level 1:
Previous HL.
3. Check AKM
Is momentum deteriorating?
4. Check Market Flow
Is participation becoming bearish?
5. Check Distribution
Is selling pressure increasing?
6. Watch for Bear Transition
Has AKMelytics qualified the bearish cycle?
7. Watch for Bearish BOS
Is the new bearish structure extending?
8. Compare Projection Levels
Look for overlap with:
- Target Lvl
- Support
- Previous lows
Common Structure Fibonacci Mistakes
Treating Every Level as a Target
Projection levels are references.
Price is not required to visit them sequentially.
Assuming CHoCH Guarantees Reversal
CHoCH identifies a structural transition.
The transition can fail.
Ignoring Invalidation
Once the structural thesis fails, the old projection may no longer provide useful context.
Confusing Structure Fibonacci With ATR Target Lvl
They are calculated from completely different information.
Changing Levels to Fit Past Charts
This can lead to over-optimization.
Ignoring AKM and Market Flow
Structure alone does not describe momentum quality or market participation.
Quick Reference
Bullish Projection
Triggered by:
Bullish CHoCH
Previous structure:
LH + LL
Anchors:
0 = LH
1 = LL
Extensions:
Negative levels project upward
Invalidation:
Close back below Level 0 / LH
Bearish Projection
Triggered by:
Bearish CHoCH
Previous structure:
HH + HL
Anchors:
0 = HH
1 = HL
Extensions:
Positive levels project downward
Invalidation:
Close back above Level 1 / HL
AKMelytics Structure Projection Framework
The complete process is:
Existing Market Structure
↓
HH / HL or LH / LL
↓
CHoCH
↓
Structure Fibonacci Activated
↓
AKM + Market Flow Confirmation
↓
Bull / Bear Transition
↓
BOS
↓
Projection Levels
↓
Target / Risk Analysis
This is the intended role of Structure Fibonacci within the wider AKMelytics framework.
Key Takeaway
AKMelytics Structure Fibonacci should answer:
“If this structural transition continues, where are the mathematical extension references based on the previous market structure?”
It is not designed to answer:
“Exactly where will price go?”
The feature becomes most useful when combined with:
CHoCH + AKM + Market Flow + Bull/Bear Transition + BOS + Target Lvl + Risk Lvl
Rather than using Structure Fibonacci in isolation, use it as another layer of market context within the full AKMelytics analytical process.
Next Guide
AKMelytics Multi-Timeframe Trend Guide
The next guide will explain how to use the Weekly, Daily, 4H and 1H Trend Table together.
You will learn:
- How the MTF Trend Table works
- Weekly trend
- Daily trend
- 4H trend
- 1H trend
- Structure Strength
- Full timeframe alignment
- Higher-timeframe Bull with lower-timeframe pullback
- Higher-timeframe Bear with lower-timeframe recovery
- How to combine MTF trend with AKM, transitions and market structure
→ Continue to: AKMelytics Multi-Timeframe Trend Guide
Previous Guide
← AKMelytics Settings Reference
Educational Use & Risk Disclaimer
AKMelytics Structure Fibonacci is a technical market-structure projection tool intended for research and educational use.
Structure Fibonacci levels are mathematical references derived from historical market structure. They are not guaranteed price targets, forecasts or recommendations to enter or exit a position.
CHoCH, BOS, Bull Transition, Bear Transition, Target Lvl, Risk Lvl and Structure Fibonacci can all fail to anticipate future market movement.
Trading and investing involve risk, including possible loss of capital. Users remain responsible for their own research, trade selection, position sizing and risk management.

