
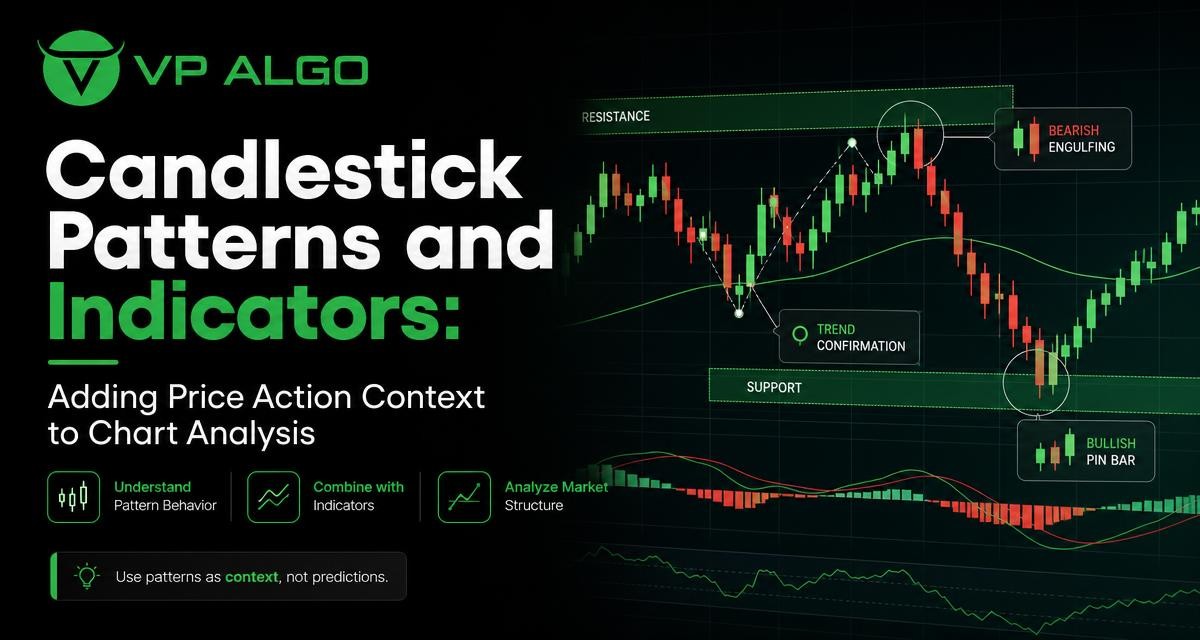
Candlestick patterns can help traders read the relationship between price, buyers, and sellers at a specific moment. However, a candle formation is only one piece of chart analysis. When combined with trend direction, momentum, market structure, and the location of price, candlestick observations can provide useful context without being treated as guaranteed predictions.
What candlestick patterns actually show
Each candlestick records a period’s open, high, low, and close. The body shows the distance between the open and close, while the wicks show where price traded but did not remain by the end of the period. This makes a candle more than a visual shape: it is a compact record of buying and selling pressure during a defined interval.
A long bullish body may show that buyers controlled much of the period, while a long upper wick can indicate that higher prices attracted selling. A small body with wicks on both sides may reflect hesitation or a temporary balance between buyers and sellers. These observations are useful, but they do not explain what happens next on their own.
Why the same candle can mean different things
Context changes the meaning of a candlestick. A rejection wick near a well-established support area may deserve more attention than the same wick in the middle of a sideways range. Similarly, a large bearish candle after a prolonged advance may signal a change in short-term pressure, but it could also be a temporary pullback if the broader structure remains intact.
This is why candlestick patterns should be treated as observations rather than automatic trade commands. The important question is not simply, “What pattern is this?” It is, “What does this candle suggest about participation at this price, and does that interpretation agree with the wider chart?”
Common candlestick patterns and their limitations
Many traders watch a familiar group of formations. Learning their typical appearance can improve chart reading, but memorising names is less useful than understanding the underlying price behaviour.
| Pattern or observation | What it may suggest | What still needs checking |
|---|---|---|
| Long bullish body | Strong buying pressure during the period | Whether the move is aligned with the trend and supported by nearby structure |
| Long bearish body | Strong selling pressure during the period | Whether price is breaking structure or simply moving within an existing range |
| Long lower wick | Lower prices were rejected before the close | Whether the rejection occurred at a meaningful level or after an extended move |
| Long upper wick | Higher prices were rejected before the close | Whether sellers are gaining control or the candle is normal noise in the timeframe |
| Small body with opposing wicks | Indecision or temporary balance | Whether the following candle confirms continuation or a possible change in direction |
| Engulfing formation | A noticeable shift in the current candle’s pressure | Location, trend, timeframe, and whether the close changes market structure |
Terms such as doji, hammer, shooting star, and engulfing pattern can make chart discussions easier, but the label does not create an edge by itself. A pattern that appears repeatedly in an unstructured market may have little practical value. Traders should also consider whether the candle has closed, because an unfinished candle can change shape before the period ends.
How price action fits with trend analysis
Trend analysis provides the broader direction in which a chart is moving. An uptrend is often described through higher highs and higher lows, while a downtrend is associated with lower highs and lower lows. A sideways market may show repeated reactions between relatively defined boundaries instead of a clear directional sequence.
Within an established trend, candlestick patterns can help describe the behaviour of a pullback or continuation attempt. For example, a bullish rejection candle during a pullback may show that buyers responded at a particular area. It does not prove that the uptrend will continue, but it gives the trader an event to evaluate against the existing structure.
Use the higher timeframe for context
A candle on a lower timeframe can look significant while being only a minor fluctuation on a higher timeframe. Reviewing more than one timeframe can help separate local price action from the broader market condition. A short-term bullish pattern may represent a brief rebound inside a higher-timeframe downtrend, while a bearish candle may be a normal retracement within a larger advance.
Multi-timeframe analysis does not remove uncertainty. Its purpose is to ask whether the chart is telling a reasonably consistent story across intervals. When timeframes disagree, reducing confidence or waiting for additional information may be more sensible than forcing a directional conclusion.
Using market structure to test a candlestick observation
Market structure focuses on the sequence of highs, lows, breaks, and reactions that define how price is moving. It helps answer whether a candle has changed the chart’s organisation or merely created a short-term reaction.
A bullish candle near a recent low may be interesting, but its importance increases only if subsequent price action protects that low, forms a higher high, or otherwise demonstrates a meaningful change. Likewise, a bearish candle near a recent high is not automatically a reversal. Traders can ask whether price has broken a relevant swing level or remains inside the same range.
Questions to ask after a notable candle
- Where did the candle form in relation to recent highs, lows, support, and resistance?
- Did the close occur beyond a meaningful structural level, or did price remain inside the prior range?
- Was the candle part of a trend, a pullback, or a period of consolidation?
- Did the next candle confirm, reject, or neutralise the initial observation?
- Does the same interpretation make sense on a higher timeframe?
A market structure indicator can help organise these questions by highlighting trends, swing points, or structural changes on the chart. The indicator should support the trader’s reasoning rather than replace it. Any highlighted event still needs to be interpreted in relation to price location and the trader’s defined process.
Adding momentum to the analysis
Momentum analysis considers how strongly and consistently price is moving. A sequence of wide candles in one direction may suggest stronger participation than a sequence of small alternating candles. Momentum tools can add another perspective by helping traders evaluate whether a move is accelerating, weakening, or moving without clear commitment.
Candlestick behaviour and momentum can sometimes provide different messages. Price may continue rising while bullish candle bodies become smaller, suggesting that the advance is losing force. Conversely, a sharp bearish candle may occur during a broader uptrend without changing the overall direction. These are situations where momentum should be treated as context, not as a standalone verdict.
Do not stack indicators that measure the same thing
Using several indicators does not necessarily create better analysis. Multiple tools may be expressing the same trend or momentum information in slightly different ways. A simpler chart can be easier to interpret if each component has a distinct purpose, such as trend direction, market structure, momentum, or price action.
A practical framework might use candlesticks to observe the immediate reaction, a trend tool to identify directional conditions, a market structure indicator to monitor swing relationships, and a momentum measure to assess the strength of the move. The exact tools are less important than knowing what question each one is intended to answer.
A step-by-step process for reading candlestick patterns
1. Start with the broader chart
Before naming a pattern, identify the market’s general condition. Is price trending upward, trending downward, or moving sideways? Mark recent swing highs and lows, then note whether price is near a range boundary or in the middle of a broad move.
2. Identify the candle’s location
Location often matters more than shape. A rejection candle at a previously observed reaction area may deserve closer review. The same candle away from any visible reference point may provide limited information.
3. Read the body and wicks
Consider who appeared to control the period and where that control weakened. A long wick can show rejection, but it does not reveal whether the rejection will persist. A strong close can show commitment during that period, but it does not guarantee continuation.
4. Check structure and momentum
Ask whether the candle confirms the current sequence of highs and lows or challenges it. Then assess whether momentum supports the interpretation. A candle that appears bullish but fails to make progress may tell a different story from one that breaks a recent level with follow-through.
5. Wait for confirmation when appropriate
Confirmation can take different forms, including a subsequent close, a successful retest, or continued movement in the same direction. Waiting may mean entering later or deciding not to act, but it can also prevent an unfinished or isolated candle from receiving too much importance.
6. Define risk before considering an entry
Technical analysis can help structure a market view, but it cannot remove the possibility of an adverse move. Before acting on any setup, traders should know where their interpretation would be considered invalid and how much exposure they are prepared to accept. Position sizing, stop placement, and trade frequency should be part of a broader risk process rather than improvised after a pattern appears.
How TradingView indicators can complement price action
TradingView indicators can make a chart easier to organise by displaying information about trend, momentum, structure, or other market observations. For traders who find it difficult to track several dimensions manually, an indicator that brings these elements together may provide a more consistent visual framework.
VP ALGO TRADING develops TradingView indicators and algorithmic trading tools intended to assist with evaluating conditions such as trend, momentum, market structure, institutional activity, and smart money concepts. Used appropriately, these tools can help traders compare an indicator’s reading with the actual candles and the surrounding chart. They should be viewed as decision-support and educational tools, not as guarantees of a particular market outcome or substitutes for personal risk management.
Keep the indicator subordinate to the chart
An indicator may mark a potential trend change or structural event before the trader has fully interpreted the price action. That can be useful for drawing attention to an area, but the chart still deserves a direct review. Check the candle close, the surrounding highs and lows, the higher-timeframe condition, and the amount of room available before a nearby opposing level.
It is also worth recording how the indicator behaves in different conditions. A method that appears clear during a strong trend may produce more conflicting observations in a range. Keeping a journal of the chart context, the candle observation, the indicator reading, and the eventual follow-through can help traders understand their process without relying on selective memory.
Common mistakes when reading candlestick patterns
- Trading the name instead of the context: A hammer or engulfing candle is not meaningful simply because it has a recognised label.
- Ignoring the closing price: An intraperiod formation may disappear or change before the candle is complete.
- Confusing reaction with reversal: A bounce from a level does not necessarily mark a new trend.
- Using too many indicators: A crowded chart can create contradictory signals and reduce clarity.
- Overlooking timeframe differences: A lower-timeframe pattern can conflict with the larger market structure.
- Expecting certainty: No single pattern or indicator can guarantee a future result.
- Skipping risk planning: A well-described setup can still move against the trader.
Building a repeatable chart-analysis routine
A repeatable routine can reduce impulsive interpretation. Begin with the broader trend and structure, then move to the candle and its location. Next, review momentum and any indicator readings that are relevant to the specific question being asked. Finally, write down what would confirm the idea and what would invalidate it.
The routine should be simple enough to follow consistently. Traders can create a checklist such as: market condition, key structure, candle behaviour, indicator agreement, confirmation, and risk. This does not make the outcome predictable. It does make the reasoning easier to review and improve.
A candlestick pattern is evidence about what happened during a period, not a promise about what must happen next.
Final perspective
Candlestick patterns are most useful when they are read as part of a larger framework. Their bodies and wicks can reveal short-term pressure, but trend analysis explains direction, market structure provides reference points, and momentum helps describe the strength of a move. Indicators can organise these observations, provided traders understand what each tool measures and continue to evaluate the underlying price action.
The goal is not to find one perfect pattern or the best trading indicator. It is to develop a clear method for combining observations, recognising uncertainty, and managing risk. That approach gives candlestick analysis a practical role without asking it to predict outcomes that no individual candle can guarantee.
Frequently asked questions
Are candlestick patterns reliable on their own?
No. Candlestick patterns describe price behaviour during a specific period, but their significance depends on trend, market structure, location, timeframe, and follow-through. They should be evaluated as part of a broader process.
What is the most important context for a candlestick pattern?
Location is often a useful starting point. Consider whether the candle formed near a meaningful swing high, swing low, support, resistance, or range boundary, then compare it with the broader trend and structure.
Can a market structure indicator confirm a candle pattern?
It can help organise information about highs, lows, breaks, and trends, but it does not guarantee confirmation. The trader should still review the actual chart and determine whether price has genuinely changed its structure.
Should traders wait for a candle to close?
Waiting for the close can reduce the risk of interpreting an unfinished formation that later changes shape. It may also mean acting later, so traders should decide in advance how candle completion fits their method and timeframe.
How many indicators should be used with candlestick analysis?
There is no universal number. Each indicator should have a clear purpose, such as measuring trend, momentum, or structure. If several tools repeat the same information or create confusion, simplifying the chart may be helpful.
Do candlestick patterns predict market direction?
They do not provide certainty about future direction. They can offer clues about current buying and selling pressure, but every interpretation remains subject to confirmation, changing conditions, and risk.


Recent Comments