
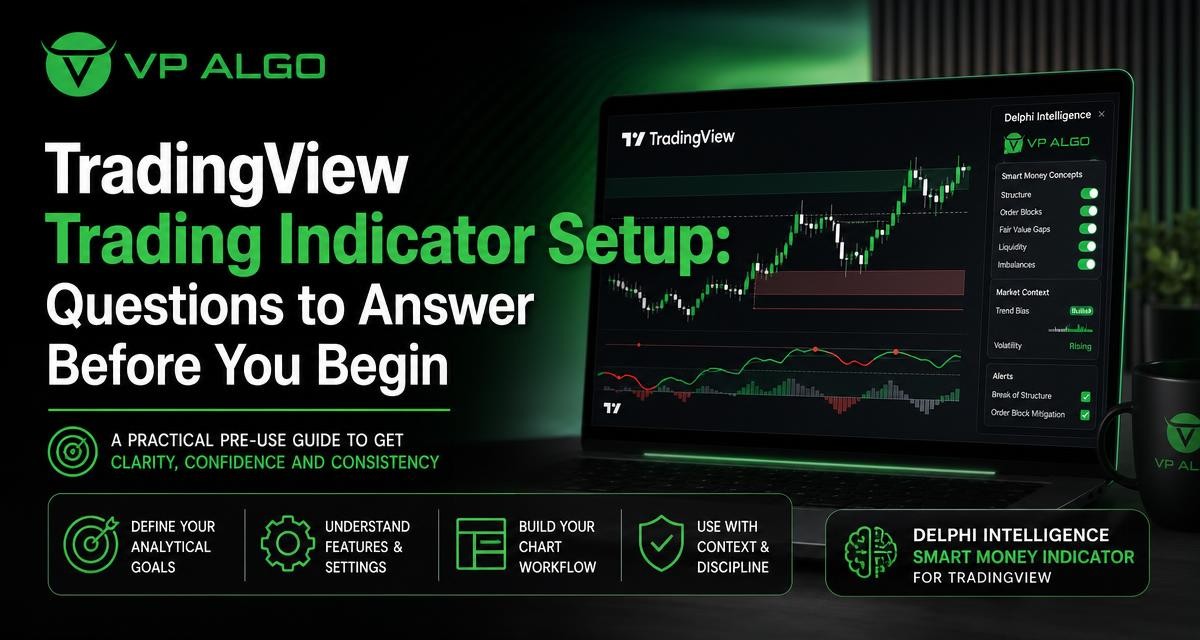
Choosing a TradingView trading indicator is only the first step. Before placing it on a chart, you should understand what it measures, how its readings fit into your analysis and which decisions it can support. A clear setup process can make an indicator easier to study and reduce the temptation to treat every visual signal as an automatic trade instruction.
Why your questions matter before setup
Trading indicators can display a large amount of information in a small space. Trend direction, momentum, market structure, institutional activity and smart money concepts may all be useful areas of analysis, but they do not answer the same question. A trend reading may help you assess directional context, while a momentum reading may show whether current movement has strength. A structure feature may help you examine changes in highs, lows or other market behaviour.
That distinction matters because an indicator is an analytical tool, not a replacement for a trading process. The Delphi Intelligence Smart Money Indicator from VP ALGO TRADING is designed to bring several areas of analysis into a TradingView workflow. Before relying on its readings, take time to decide what you want to learn from the chart and how you will evaluate the information.
Question 1: What do you want the indicator to help you analyse?
Start with the analytical problem you are trying to solve. Some traders want a clearer view of trend conditions. Others are more interested in momentum, market structure, institutional flow or smart money analysis. If you do not define the purpose first, it is easy to add features simply because they look interesting rather than because they support a specific part of your process.
Write down the main questions you want your chart to help you explore. For example, you might ask whether the broader trend appears aligned with the current movement, whether momentum supports that movement or whether a change in market structure deserves closer attention. These are questions for analysis, not promises of a particular market outcome.
| Analytical goal | What to examine | Useful setup question |
|---|---|---|
| Trend analysis | Directional context across the chart | Am I assessing the broader trend or only a short-term move? |
| Momentum evaluation | Strength and persistence of current movement | What would make momentum appear supportive or weaker? |
| Market structure | Changes in swing behaviour and price organisation | Which structural developments matter to my analysis? |
| Institutional activity | Flow-related information presented by the indicator | How will I interpret this information alongside other evidence? |
| Smart money analysis | Conditions associated with smart money concepts | Do I understand the terminology and limitations before using it? |
Question 2: Which chart workflow fits your analysis?
A TradingView trading indicator is most useful when it fits naturally into the way you already review charts. Decide whether you will begin with a broad view and then move to more detailed observations, or whether your process starts with a specific setup and checks the wider context afterward. The answer will affect how you use trend, momentum and market structure features.
Multi-timeframe trend assessment can be helpful when you want to compare broader context with a more detailed chart view. However, it should not encourage you to collect more readings than you can interpret. Before setup, decide which timeframes are relevant to your own study and what role each one plays. A higher timeframe may provide context, while a lower timeframe may show more immediate movement, but the indicator does not remove the need for your own judgement.
Build a repeatable chart review
A simple workflow is often easier to evaluate than a chart filled with unrelated signals. You could organise your review in the following order:
- Context: Observe the broader chart and identify the market conditions you are studying.
- Trend: Review the trend assessment and consider whether it agrees with the wider chart picture.
- Structure: Examine relevant structural changes rather than reacting to every marked event.
- Momentum: Ask whether the current movement has supporting momentum or signs that require caution.
- Smart money and flow information: Interpret these readings as part of the wider analysis, not in isolation.
- Review: Record what you saw, what you expected and what you still did not understand.
This process is intended to create consistency. It does not turn the readings into guaranteed signals or remove the risks associated with trading decisions.
Question 3: Do you understand what the features are showing?
Before depending on a smart money indicator for TradingView, learn the meaning of its displayed features. Terms such as market structure, institutional activity, momentum and smart money concepts can be used in different ways across trading education and software. You should know what a particular reading is intended to represent before incorporating it into your analysis.
Spend time observing the indicator across different chart conditions. Look at periods with clear movement, periods with less directional behaviour and situations where signals may appear mixed. The purpose is not to prove that the indicator will produce a desired result. It is to understand how the display behaves and where your interpretation may be uncertain.
Questions to ask about each reading
- What market information is this feature intended to organise?
- Is it describing trend, momentum, structure, flow or another analytical area?
- Does the reading require confirmation from the chart or another part of the indicator?
- Could the same feature look different across timeframes?
- What would make the reading less useful in the current market condition?
- Am I treating a visual marker as a conclusion when it is only one piece of evidence?
These questions encourage a more careful relationship with the tool. A feature can make chart information easier to review without making the underlying market easier to predict.
Question 4: Is the chart readable enough to support decisions?
More information is not always better information. If trend labels, structure markings, momentum information and other chart elements compete for attention, the result may be harder to interpret. Start with the features connected to your main analytical goal. You can study additional elements later once the basic workflow is familiar.
Chart readability also includes the surrounding information. Consider the selected timeframe, the price action visible on screen and the way you record observations. If you frequently change settings without documenting why, it may become difficult to tell whether your interpretation changed because market conditions changed or because the display changed.
A practical setup checklist
- Choose the chart and timeframe you intend to study.
- Add the indicator and identify the purpose of each visible feature.
- Remove or minimise information that you cannot yet interpret.
- Compare the readings with the underlying price action.
- Note any settings or display choices that affect your review.
- Use the same basic review sequence while learning the tool.
Question 5: How will you evaluate an indicator before relying on it?
Evaluation should focus on understanding and consistency rather than searching for a perfect signal. Review historical chart sections to see how the readings appeared in different conditions, but remember that historical observations do not guarantee future results. Past performance or past chart behaviour cannot establish what will happen next.
You may also keep a journal containing the date of your review, the chart context, the readings you noticed and the reasons for your interpretation. Include situations where the information was unclear. Recording uncertainty is useful because it reveals which parts of the indicator require more study and helps prevent hindsight from making every past chart look obvious.
Separate observation from conclusion
When reviewing a chart, write down what the indicator displayed before writing what you think it meant. For instance, you might record that a trend assessment pointed in a particular direction, that momentum information was mixed or that a structural change was visible. Only afterward should you consider how those observations fit into your broader analysis. This separation can make your process less reactive.
It is also useful to define what the indicator cannot tell you. It cannot remove market uncertainty, guarantee profitable results or eliminate losses. It is not a substitute for risk awareness, independent research or a plan for handling situations that do not match your expectations.
Question 6: Do you know how access and support work?
Product access is part of a practical setup. VP ALGO TRADING offers the Delphi Intelligence Smart Money Indicator for TradingView. After purchase, customers are instructed to provide their TradingView ID by email for product access. If you need help with installation, activation or usage, the company states that you can contact support.
The website also offers a request-based 7-day free trial for its indicator and Telegram channel. Because trial details and eligibility can depend on the current process, check the relevant instructions before assuming access. A trial should be used to learn the tool’s workflow and features, not as evidence of guaranteed trading performance.
Prepare before requesting access
- Have the correct TradingView ID available.
- Know which chart workflow you want to test.
- List any installation or activation questions.
- Decide which features you need to understand first.
- Keep notes during the trial or initial setup period.
Clear preparation can make support conversations more efficient and help you focus on using the indicator rather than troubleshooting basic access details.
Question 7: What role should the indicator play in your process?
Decide whether the indicator will be used for education, chart organisation, market-condition analysis or a combination of these purposes. The Delphi Intelligence Smart Money Indicator is positioned to help traders evaluate trend, momentum, market structure, institutional activity and smart money conditions. That makes it relevant to traders who want a structured view of several analytical areas within TradingView.
Even so, the final interpretation remains your responsibility. An indicator should support a clearly defined process rather than replace one. Avoid changing your entire approach because of a single reading, and do not assume that a collection of aligned features removes the need to consider uncertainty and risk.
Common setup mistakes to avoid
Many problems occur before a trader has properly learned the tool. The most common mistake is treating a new indicator as a buy-and-sell answer instead of studying what it displays. Another is adding every available feature immediately, which can make it difficult to identify the information that actually matters to the intended workflow.
Other mistakes include switching timeframes without a clear reason, ignoring mixed readings and judging the tool only by the trades someone hoped it would identify. A more useful approach is to ask whether the indicator helps you organise your analysis and whether you can explain its readings in plain language.
- Do not assume a visual marker is a guaranteed trade instruction.
- Do not use unfamiliar terms without learning what they mean in context.
- Do not confuse historical chart review with a promise about future results.
- Do not let a crowded chart replace a repeatable process.
- Do not rely on the indicator as financial advice or personalised guidance.
How to begin with greater clarity
A sensible starting point is to define one analytical goal, add the indicator to a familiar TradingView chart and study the most relevant feature first. Then compare the reading with trend, momentum, market structure and price behaviour as appropriate. As your understanding improves, you can incorporate additional elements without losing track of the original purpose.
The Delphi Intelligence Smart Money Indicator may be worth considering if you want a TradingView tool that brings together trend analysis, momentum evaluation, market structure, institutional flow monitoring, multi-timeframe trend assessment and smart money analysis. The important step is to understand those capabilities before relying on them. Used as an educational and decision-support tool, an indicator can help structure your review while leaving the responsibility for interpretation and trading decisions with you.
Frequently asked questions
What is a TradingView trading indicator?
A TradingView trading indicator is a chart-based tool that organises or displays information used in technical analysis. Depending on the tool, it may relate to trend, momentum, market structure, flow or other market observations.
What does a smart money indicator for TradingView help analyse?
A smart money indicator can organise information related to smart money concepts and may be used alongside analysis of trend, momentum, market structure or institutional activity. You should understand the specific readings before relying on them.
Is the Delphi Intelligence Smart Money Indicator financial advice?
No. VP ALGO TRADING positions its indicators for educational and trading-decision assistance purposes rather than as financial advice. The indicator does not provide personalised financial guidance or guarantee an outcome.
How do I access the Delphi Intelligence Smart Money Indicator?
After purchase, customers are instructed to provide their TradingView ID by email for product access. Support can also be contacted for installation, activation or usage assistance.
Can I try the indicator before using it regularly?
The website offers a request-based 7-day free trial for the indicator and Telegram channel. Review the current request instructions and eligibility details rather than assuming trial access.
Does the indicator guarantee profitable trading?
No. No indicator can guarantee profits or eliminate trading losses. Historical observations and past performance do not guarantee future results, so the readings should be interpreted carefully.
Should I use every feature when I first set up the indicator?
Not necessarily. Begin with the features connected to your main analytical goal, learn what they display and add other elements only when they improve your understanding rather than crowding the chart.


Recent Comments