
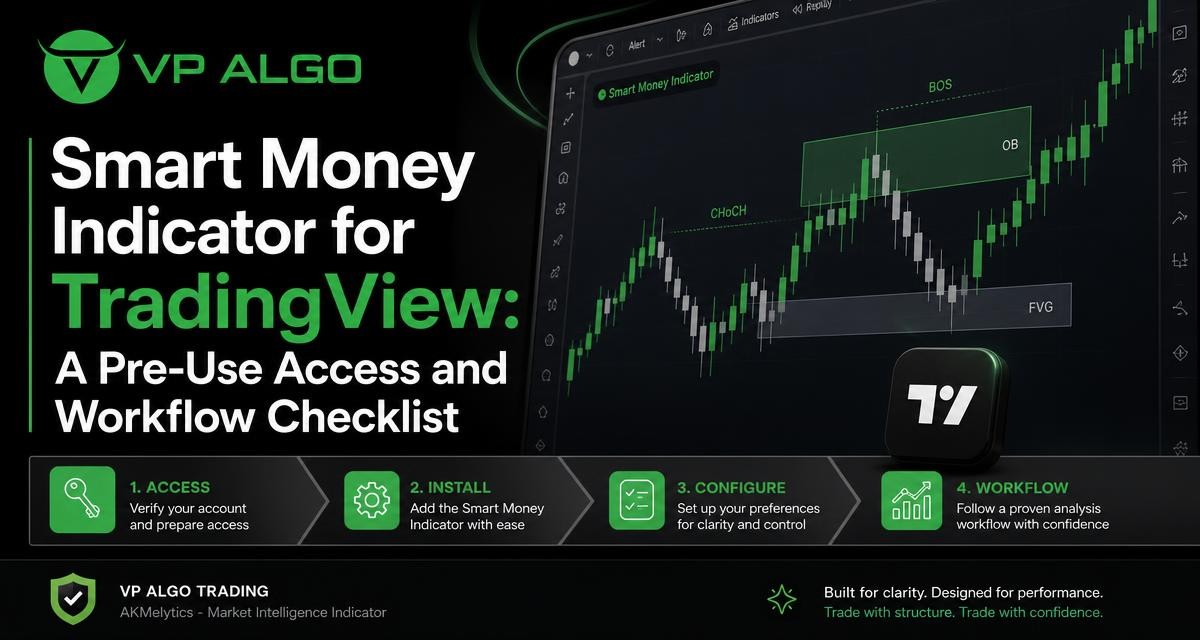
Before using a smart money indicator for TradingView, it helps to prepare more than a chart and a subscription. Access details, TradingView account information, installation support and a repeatable analysis process all affect how effectively you can use the tool. This checklist explains what to prepare before using the AKMelytics – Market Intelligence Indicator from VP ALGO TRADING and how to build a structured workflow around its available analysis features.
What to prepare before using a TradingView indicator
A TradingView trading indicator is most useful when it fits into an existing chart-review process. It should help you examine market conditions, not replace your judgement or encourage decisions based on a single visual signal. Before requesting access or adding an indicator to a chart, clarify what you want to evaluate: trend direction, momentum, market structure, institutional activity or a combination of these factors.
It is also worth checking that you can access the TradingView account on which you intend to use the indicator. VP ALGO TRADING instructs customers to provide their TradingView ID by email after purchase. Having the correct account information ready can make the activation process clearer and reduce avoidable delays caused by sending an incorrect username or account identifier.
Pre-use checklist
- Confirm that you have an active TradingView account.
- Identify the TradingView ID associated with the account you plan to use.
- Decide which charts and timeframes you normally review.
- Write down the market questions you want the indicator to help you investigate.
- Keep your purchase or trial communication available for reference.
- Contact support if you need help with activation, installation or usage.
This preparation does not predict whether a trade will work. It simply creates the conditions for a more organised evaluation of the indicator and the information shown on your chart.
How access and activation typically fit into the process
For the indicator offered by VP ALGO TRADING, access is connected to the customer’s TradingView account. After purchase, customers are instructed to send their TradingView ID by email so the product can be made available to the intended account. The company also offers a request-based seven-day free trial for its indicator and Telegram channel. Trial or purchase questions should be confirmed directly with the company because eligibility and other conditions may depend on the current offer.
Once the account details have been provided, the next stage is to check whether the indicator appears correctly in TradingView and whether its settings are visible. If it does not appear as expected, avoid repeatedly changing unrelated chart settings. Instead, verify the account ID that was submitted and contact support for installation or activation assistance.
| Stage | What to check | Useful action |
|---|---|---|
| Account preparation | You can sign in to the intended TradingView account | Record the correct TradingView ID |
| Access request | The company has the required account information | Send the ID through the requested email process |
| Installation | The indicator is available on the correct account | Add it to a chart and review the displayed elements |
| First review | The chart is readable and the settings are understood | Use a familiar market and timeframe for initial testing |
| Support | Activation or usage is unclear | Contact VP ALGO TRADING for assistance |
Understanding the indicator’s analysis areas
The AKMelytics – Market Intelligence Indicator is presented as a market intelligence tool for TradingView. The supplied product information describes features related to trend analysis, momentum signals, market structure, institutional flow monitoring, multi-timeframe trend assessment and smart money analysis. These areas answer different questions, so it is helpful to understand the role each one may play in your review.
Trend analysis
A trend view helps you consider the broader direction of price action rather than focusing only on the latest candle. A trend indicator for TradingView can be used as part of a process that asks whether the market is moving persistently in one direction, losing momentum or shifting into less directional conditions.
Trend information is context, not a guarantee of continuation. A chart can show a broader trend while shorter-term price movement moves against it. For that reason, trend assessment is best treated as an initial filter that you compare with structure, momentum and the timeframe you are trading or studying.
Momentum signals
Momentum evaluation focuses on the strength or persistence of a price move. A momentum indicator for TradingView may help you identify whether movement is building, weakening or failing to support a developing setup. This can add context to a trend observation, particularly when price direction and momentum do not appear to agree.
Momentum should not be read as a standalone buy or sell instruction. A strong move can occur late in a trend, while a temporary loss of momentum does not automatically mean that a larger move has ended. Use the display as one part of a broader review.
Market structure
A market structure indicator can help organise observations about changes in highs, lows and directional behaviour. Structure analysis is useful because it encourages you to examine how price is behaving over a sequence of candles rather than reacting to one isolated movement.
When reviewing structure, ask whether the displayed information agrees with the timeframe you are analysing. A structure change on a shorter chart may not represent a change in the broader market view. Comparing multiple timeframes can help you separate a local movement from a wider shift.
Institutional activity and smart money concepts
The indicator also includes features associated with institutional flow monitoring and smart money analysis. These concepts are commonly used to study where significant market interest may be reflected in price behaviour and structure. They can give traders another framework for examining areas of interest, but they should not be treated as direct knowledge of every participant’s intentions.
A smart money trading indicator is most useful when its information is interpreted cautiously. Treat displayed conditions as analytical inputs. Review the underlying chart, consider the timeframe and look for agreement with other parts of your process before reaching a conclusion.
A practical TradingView workflow
Once access is active, use a consistent sequence each time you review a chart. A repeatable workflow makes it easier to distinguish what the indicator is showing from what you are assuming. It also helps prevent a crowded chart from turning into a collection of disconnected signals.
Step 1: Start with the broader chart context
Begin by identifying the market and timeframe you are reviewing. Note whether price appears directional, corrective or relatively unclear. Then examine the broader trend assessment before focusing on short-term details. This first pass gives you a reference point for interpreting the other features.
Step 2: Review market structure
Next, study the structure shown on the chart. Look for the sequence of price movements and ask whether the current behaviour supports continuation, a possible transition or an uncertain environment. Avoid forcing a clear conclusion when the chart does not provide one.
Step 3: Check momentum
Compare momentum information with the trend and structure views. If all three point in a similar direction, you may have greater analytical alignment. If they conflict, record the conflict instead of treating it as a signal to act immediately. Disagreement can be a reason to wait, gather more context or move to another timeframe.
Step 4: Consider institutional flow and smart money information
Use institutional flow and smart money-related features as an additional layer of context. Ask whether the information supports the structure you have already identified or whether it introduces a different interpretation. This prevents one feature from dominating the entire analysis.
Step 5: Compare multiple timeframes
The indicator includes multi-timeframe trend assessment, which can help you compare broader and more local conditions. The purpose is not to make every timeframe agree. Instead, use the comparison to understand whether a shorter-term setup is moving with or against the wider trend.
Step 6: Document the conclusion
Before making any trading decision, write down the evidence you considered and the conditions that would invalidate your view. Include the market, timeframe, trend assessment, structure, momentum and any smart money observations. A short record can expose when a decision is based on one appealing signal rather than a balanced review.
- Identify the market and timeframe.
- Assess the broader trend.
- Review market structure.
- Compare momentum with direction.
- Consider institutional flow and smart money context.
- Check other relevant timeframes.
- Record your reasoning and the risks you see.
How to avoid common first-use mistakes
Relying on one signal
An indicator can combine several analytical features, but that does not mean every displayed element should be interpreted as an independent instruction. Looking for agreement among trend, momentum, structure and broader context is generally more disciplined than reacting to a single colour, marker or change on the chart.
Changing settings without understanding them
New users sometimes adjust settings immediately in search of a clearer or more frequent signal. That can make it difficult to know what the default display was showing and why it changed. Begin by learning the original presentation, then make only one change at a time if you have a clear reason to do so.
Ignoring timeframe differences
A shorter timeframe can show movement that does not alter the broader trend. Conversely, a broad trend view may hide a meaningful short-term change. Always note the timeframe behind an observation and avoid transferring a conclusion from one chart directly to another without checking the context.
Confusing access problems with chart problems
If the indicator is missing, unavailable or not displaying as expected, first check whether you are using the TradingView account associated with your access. Confirm the submitted TradingView ID and contact VP ALGO TRADING for installation or activation support when necessary.
Expecting certainty
No TradingView trading indicator removes uncertainty from markets or guarantees a particular outcome. The purpose of a structured tool is to support analysis and decision-making, not to eliminate losses or replace risk awareness. VP ALGO TRADING positions its indicators for educational and trading-decision assistance rather than as financial advice.
Questions to ask before choosing a smart money indicator
Before committing to a tool, consider whether its analysis areas match the way you review charts. Ask whether you need trend context, momentum evaluation, market structure, institutional flow monitoring, multi-timeframe assessment or smart money concepts. Also consider how much support you may need during access, installation and first use.
It is equally important to understand what the indicator cannot do. It cannot guarantee profitable results, remove trading risk or provide personalised financial guidance. A useful tool should fit into a process that includes independent judgement, clear documentation and an understanding of possible losses.
| Question | Why it matters |
|---|---|
| What do I want to analyse? | It helps you match the tool’s features with your actual chart-review needs. |
| Which TradingView account will I use? | Access is linked to the account details provided for activation. |
| Do I understand the displayed concepts? | Trend, momentum, structure and smart money information require interpretation. |
| What support might I need? | Knowing how to request installation, activation or usage assistance improves preparation. |
| How will I record my analysis? | A written process can reduce impulsive decisions based on one chart feature. |
Final checklist before using the indicator
Before your first serious review, confirm that access is active on the correct TradingView account, the indicator is visible and the chart remains readable. Spend time learning the relationship between trend, momentum, market structure, institutional flow and multi-timeframe information. Then test your workflow through observation and documentation rather than assuming that every displayed condition is an instruction to trade.
If you need help with installation, activation or usage, VP ALGO TRADING provides support for those product-related questions. The company develops and sells TradingView indicators and algorithmic trading tools, while the final interpretation and decision-making remain the trader’s responsibility.
Frequently asked questions
What is a smart money indicator for TradingView?
It is a TradingView tool designed to help traders examine smart money concepts and related market information. The AKMelytics – Market Intelligence Indicator also includes features related to trend, momentum, market structure, institutional flow and multi-timeframe assessment.
How do I prepare for access?
Prepare an active TradingView account and identify the TradingView ID associated with it. After purchase, VP ALGO TRADING instructs customers to provide that ID by email for product access.
Can I get help installing the indicator?
Yes. Customers can contact VP ALGO TRADING for installation, activation or usage assistance if they need help getting started.
Does the indicator provide guaranteed trading results?
No. The indicator does not guarantee profits, eliminate losses or remove market uncertainty. It is intended to support education and trading-decision analysis, not to provide financial advice.
Which features should I review first?
Start with the broader trend, then examine market structure, momentum, institutional flow and smart money-related information. Compare the observations across relevant timeframes before forming a view.
Is a displayed signal an automatic buy or sell instruction?
No. A displayed condition should be treated as analytical context rather than an automatic instruction. Review the chart, timeframe, risk and other evidence before making any decision.


Recent Comments