
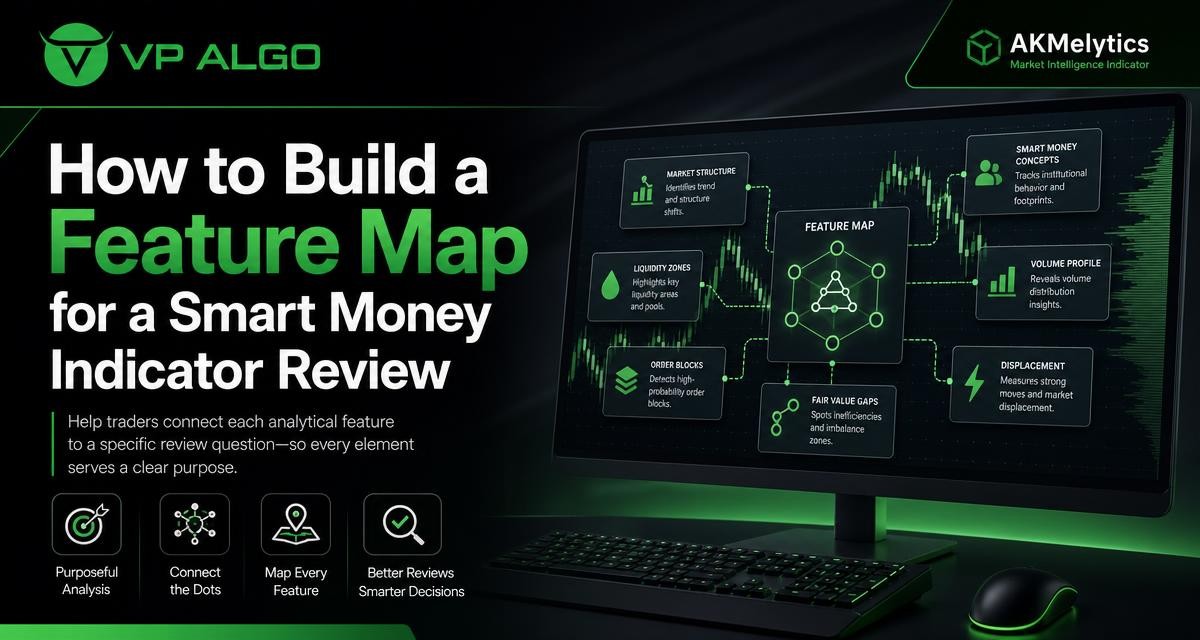
Reviewing a smart money indicator is easier when every chart feature has a defined purpose. Instead of treating trend labels, momentum signals, market structure markings and institutional activity readings as separate trade commands, build a feature map that connects each one to a specific review question. This approach helps traders understand what an indicator is showing, how different features relate to one another and where human judgment is still required.
What is a feature map?
A feature map is a simple framework that connects an indicator feature to the question it is meant to answer. For example, a trend feature may answer whether the broader market is moving upward, downward or sideways. A market structure feature may help examine whether price is creating higher highs, higher lows, lower highs or lower lows. A momentum feature may then be used to ask whether the current move has strength behind it.
The purpose is not to collect as many signals as possible. More information can create more confusion if each element is interpreted independently. A feature map gives the review a sequence and a purpose. It turns a crowded chart into a structured investigation of market conditions rather than a search for one perfect buy or sell label.
Start with the review questions
Before assessing any smart money indicator, write down the questions you want the tool to help you examine. These questions should be observable and specific. Avoid vague goals such as “find the best trade.” A better question is, “What is the current directional bias on the selected timeframe?” or “Has the recent move changed the visible market structure?”
The following table provides a starting point for mapping common features. The feature does not provide an automatic conclusion; it organizes the evidence that should be reviewed.
| Review question | Relevant feature | What to examine | Important caution |
|---|---|---|---|
| What is the broad directional condition? | Trend analysis | Direction, persistence and possible changes in the trend | A trend reading can change as new price data develops |
| Does the current move have participation or strength? | Momentum signals | Acceleration, weakening movement and alignment with price | Momentum can remain strong while a market becomes extended |
| Has price changed its swing behavior? | Market structure | Higher highs, lower lows, breaks and shifts in swing relationships | A structure mark depends on the swing rules and timeframe used |
| Is there evidence associated with larger market activity? | Institutional activity or flow monitoring | Displayed activity zones, flow-related readings and their location | Such readings should be treated as analytical context, not proof of a future move |
| Do different timeframes tell a similar story? | Multi-timeframe trend assessment | Higher-timeframe direction compared with the working timeframe | Timeframes can conflict, especially during transitions |
| How does the current setup relate to smart money concepts? | Smart money analysis | Structure, liquidity-related context and areas of interest shown by the tool | Conceptual labels still require independent price review |
Map the indicator from broad context to detail
A useful review normally moves from the broadest question to the most specific one. Start with the market environment, then examine direction, structure, momentum and activity. This order reduces the risk of allowing a small chart event to dominate the entire analysis.
1. Establish the market context
Begin by recording the instrument, chart timeframe and review date. These details matter because an indicator feature can look different when applied to a short-term chart than when viewed on a higher timeframe. The same price movement may represent a meaningful trend change on one chart and ordinary noise on another.
Next, describe the market in plain language. Is price trending, moving sideways, recovering from a decline or reacting sharply after a large move? This first description should come before interpreting individual labels. It creates a neutral baseline against which the indicator’s features can be assessed.
2. Use trend analysis to define directional bias
A trend feature is primarily a context tool. Its role in the map is to answer whether the market has a visible directional bias and whether that bias appears stable or uncertain. It should not automatically be treated as a complete trading decision.
When reviewing the trend component, ask whether its reading agrees with the visible price path. If the indicator identifies an upward trend while price is repeatedly failing to make progress, that difference deserves attention. It may reflect a lagging calculation, a timeframe mismatch or a market moving into a transition. The disagreement is useful information because it tells you to investigate rather than accept the label without question.
3. Examine momentum separately from direction
Direction and momentum are related, but they are not identical. A market can continue moving upward while its momentum weakens. It can also show a short burst of momentum inside a broader downward trend. Your feature map should therefore give momentum its own question: is the current price movement gaining strength, losing strength or producing a brief reaction?
Compare momentum readings with the location and shape of price movement. A strong reading near the start of a move may provide different context from a strong reading after an extended advance. Similarly, weakening momentum does not automatically mean that a reversal is underway. It indicates that the current move deserves closer review.
4. Study market structure before interpreting entry-style signals
A market structure indicator can help organize swing relationships and potential changes in the way price is behaving. The relevant review questions include whether the market is producing higher highs and higher lows, lower highs and lower lows, or a less orderly range. You can also ask whether a displayed break is consistent with the surrounding price action.
Do not review a structure label in isolation. Confirm which timeframe produced it, how significant the preceding swing was and whether the move has held after the break. A brief movement through a prior level may not carry the same meaning as a sustained change in swing behavior. The feature map should make these checks explicit.
5. Add institutional activity and flow context
If the smart money indicator includes institutional activity or flow monitoring, map those features to a question about context rather than certainty. You might ask whether the displayed activity is appearing near an important structural area, whether it agrees with the current trend and whether it is supported by price behavior.
Activity-related information can be easy to overinterpret. A visual zone or flow reading does not by itself identify the intentions of every market participant or guarantee that price will react in a particular way. Treat it as one part of the evidence set. Its value increases when it helps explain why a move deserves further investigation, not when it is used as a substitute for risk assessment.
6. Compare multiple timeframes
Multi-timeframe analysis gives each chart a defined job. A higher timeframe can provide broad context, while a lower timeframe can show shorter-term structure and momentum. The feature map should state which question belongs to each timeframe. For example, the higher timeframe may answer, “What is the dominant directional condition?” while the working timeframe asks, “Is the current movement aligned with that condition?”
Conflicting readings are not necessarily a technical failure. They may indicate a pullback, consolidation or transition between conditions. Record the conflict instead of forcing agreement. A trader who recognizes that the timeframes disagree has more useful information than one who hides the disagreement behind a single combined label.

Connect features without double-counting them
Several indicator features may describe the same underlying price behavior. A trend label, a bullish structure break and positive momentum may all be influenced by the same upward movement. Counting them as three independent confirmations can make the evidence appear stronger than it really is.
To avoid double-counting, classify each feature by its analytical role:
- Context: the broader environment in which the current price movement is occurring.
- Direction: the apparent upward, downward or sideways bias.
- Structure: the organization of swings and changes in price behavior.
- Participation: activity or flow-related information that may add context to the move.
- Timing: short-term momentum or a possible change in immediate conditions.
- Risk review: the conditions that would invalidate the current interpretation.
This classification helps reveal whether the indicator offers genuinely different perspectives or multiple versions of the same signal. A good review does not require every category to agree. It requires the reader to understand what each category contributes.
Turn the feature map into a review workflow
Step 1: Record the setup without making a conclusion
Write down the instrument, timeframe, visible trend and major structural features before deciding whether the chart looks attractive. This prevents the first signal you notice from controlling the rest of the review.
Step 2: Review higher-timeframe conditions
Use the higher timeframe to describe the broad directional context and notable structural areas. If the indicator provides multi-timeframe trend assessment, compare its output with the visible chart rather than copying the label into your notes without checking it.
Step 3: Review the working timeframe
On the timeframe used for the analysis, examine the latest structure, momentum behavior and any activity or smart money features. Ask how recent each observation is and whether it is still visible after subsequent price movement.
Step 4: Identify alignment and conflict
Create two short lists: features that support the same interpretation and features that challenge it. For example, trend and structure may point upward while short-term momentum is weakening. That is not a reason to force a bullish or bearish answer. It is a reason to describe the condition as mixed and determine what evidence would resolve the uncertainty.
Step 5: Define invalidation before acting
A review is incomplete if it only describes what would support a view. State what would make the interpretation less credible. This might involve a failure to hold a structural level, a change in the higher-timeframe trend or a continuation of conflicting momentum. The exact rule should come from the trader’s plan, not from an unsupported promise made by the indicator.
Build a practical feature-map worksheet
A worksheet can make repeated reviews more consistent. It does not need to be complicated. The following fields are enough to begin:
- Market and timeframe: identify the chart being reviewed.
- Broad context: describe trend, range or transition in plain language.
- Trend reading: record the indicator’s directional information and compare it with price.
- Structure reading: note the relevant swing relationships, breaks or shifts.
- Momentum reading: describe whether movement is strengthening, weakening or unclear.
- Activity context: record any institutional flow or smart money-related information shown by the tool.
- Timeframe alignment: note agreement or conflict between the selected charts.
- Unanswered question: identify what the indicator cannot establish from the current chart.
- Invalidation condition: state what would change the review.
The unanswered-question field is particularly valuable. It stops traders from assuming that a chart tool can answer questions it was not designed to answer. For example, an indicator may help organize market structure and momentum, but it cannot remove uncertainty or decide how much risk is appropriate for an individual trader.
How to review a smart money indicator objectively
When assessing a smart money indicator such as AKMelytics – Market Intelligence Indicator, review the relationship between its features rather than focusing only on visual appeal. Consider whether trend analysis, momentum evaluation, market structure, institutional activity, multi-timeframe assessment and smart money concepts each have a clear place in your worksheet.
Also assess usability. Can you explain what a label means? Can you identify the timeframe behind it? Does the feature help answer a question that matters to your process, or does it simply add another mark to the chart? A useful TradingView indicator should make analysis more organized, but the trader remains responsible for interpretation, planning and risk decisions.
Common mistakes when mapping indicator features
Treating every feature as a separate confirmation
Related features may be responding to the same price event. Group them by role and ask whether they add new information before calling them independent confirmations.
Ignoring timeframe changes
A structure break or momentum shift has meaning only in relation to its timeframe. Always record the chart interval and avoid mixing a higher-timeframe conclusion with a lower-timeframe observation without explaining the connection.
Using labels without checking price
Indicator labels are prompts for investigation. Compare them with swing behavior, failed moves, consolidation and the location of price on the chart. A label that does not fit the visible context deserves a question, not automatic acceptance.
Confusing explanation with prediction
A feature map explains how evidence is organized. It does not predict every future movement. Keeping that distinction clear helps prevent a smart money trading indicator from being treated as a guaranteed signal provider.
Final checklist
Before completing a review, ask:
- Have I defined the market, timeframe and review purpose?
- Does each feature answer a specific question?
- Have I separated trend, momentum, structure and activity?
- Have I checked whether multiple features are based on the same price movement?
- Have I compared higher-timeframe and working-timeframe conditions?
- Have I recorded conflicts instead of hiding them?
- Have I stated what would invalidate the current interpretation?
- Have I avoided treating the indicator as financial advice or a guarantee of results?
A feature map will not remove uncertainty from technical analysis. Its value is more practical: it makes the review repeatable, clarifies what each chart element contributes and exposes gaps in the reasoning. For traders evaluating a smart money indicator on TradingView, that structure can be more useful than adding another isolated signal to an already crowded chart.
Frequently asked questions
What is the purpose of a feature map for a smart money indicator?
It connects each indicator feature to a clear review question. This helps traders understand whether a feature relates to trend, momentum, structure, activity, timing or risk review.
Should every feature on an indicator agree before a trader continues?
No. Conflicting readings can show that the market is transitioning, consolidating or moving differently across timeframes. The important step is to record and investigate the conflict.
How does a market structure indicator fit into the feature map?
It helps examine swing relationships, structural breaks and possible changes in price behavior. These observations should be checked against the visible chart and the selected timeframe.
Can momentum confirm a trend?
Momentum can add context about the strength or weakness of a move, but it does not independently prove that a trend will continue. A strong move can weaken, and a brief momentum burst can occur inside a broader trend in the opposite direction.
Why should traders compare multiple timeframes?
Different timeframes answer different questions. A higher timeframe can describe broad context, while a working timeframe can show shorter-term structure and momentum. Agreement can add context, while disagreement identifies uncertainty.
Does a smart money indicator guarantee profitable trading decisions?
No. An indicator is an analytical tool, not a guarantee of profits or a replacement for a trader’s own plan and risk assessment. Past observations do not guarantee future results.


Recent Comments