
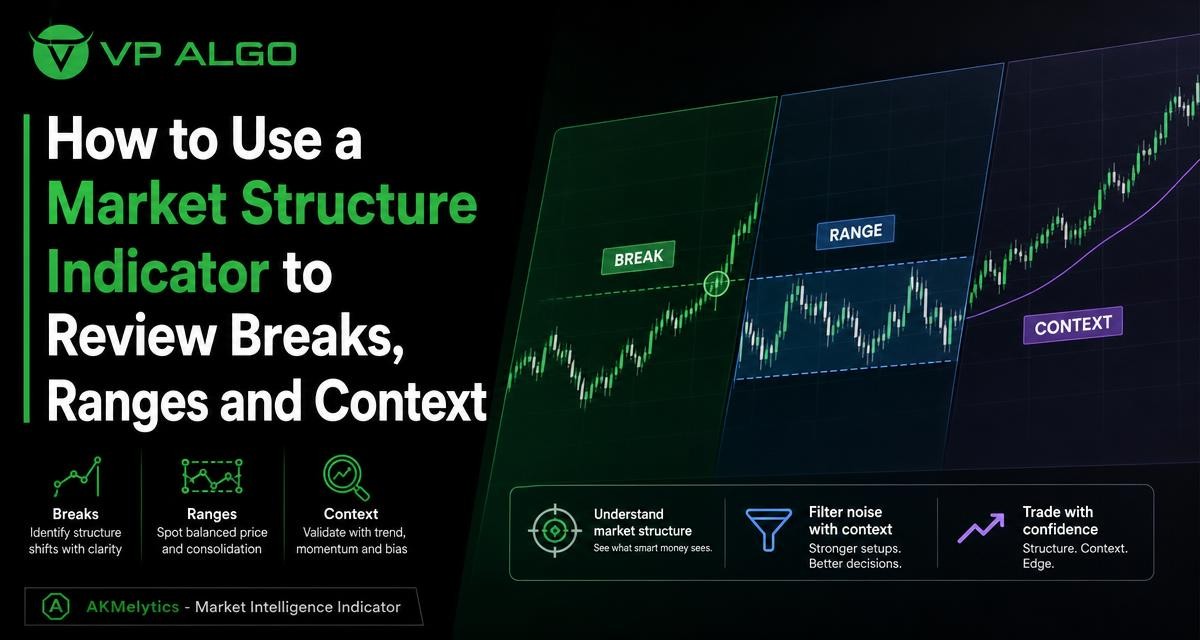
A market structure indicator can help traders organize what price is doing across trend, range and breakout conditions. Rather than treating every change in price as a standalone signal, it provides a framework for reviewing swing highs, swing lows, breaks, consolidations and broader market context. Used alongside momentum, trend analysis and disciplined risk assessment, this approach can make stock technical analysis more structured and easier to review.
What a market structure indicator is designed to show
Market structure describes the way price develops over time. In a rising market, traders may observe a sequence of higher highs and higher lows. In a falling market, lower highs and lower lows may dominate. When neither side controls price clearly, the chart may spend time moving inside a range.
A market structure indicator helps highlight or organize these observations on a chart. Depending on the tool, it may mark swing points, possible breaks of previous highs or lows, changes in directional behavior, or areas where price is consolidating. The purpose is not to predict every future move. It is to make the current chart condition easier to evaluate consistently.
| Chart condition | Structure observations | Questions to review |
|---|---|---|
| Uptrend | Higher highs and higher lows | Is the latest pullback holding above an important prior low? |
| Downtrend | Lower highs and lower lows | Is selling pressure continuing, or is price beginning to stabilize? |
| Range | Repeated reactions between visible boundaries | Is price near the middle of the range or testing an edge? |
| Potential transition | A break, failed break or change in swing behavior | Has the move been confirmed by follow-through and broader context? |
Start with the broader context
The first step is to avoid reading a single candle or structure label in isolation. Begin with a wider view of the chart and ask whether the market has been trending, ranging or moving through an uncertain transition. This context influences how a new break should be interpreted.
For example, a move above a recent swing high may have a different meaning when it occurs inside a well-established uptrend than when it occurs near the top of a sideways range. In the first situation, the move may fit the existing directional structure. In the second, it could be a temporary test that fails and returns into the range.
Use more than one timeframe when appropriate
A broader timeframe can provide context, while a shorter timeframe can show the detail of a recent move. A market structure indicator may be useful on both, but the observations should not be treated as identical. A short-term bullish break can occur within a broader bearish structure, just as a brief decline can occur during a larger uptrend.
When reviewing multiple timeframes, keep the questions separate:
- What is the dominant structure on the broader chart?
- Is the shorter-term move aligned with that structure or moving against it?
- Where are the important highs, lows and range boundaries on each timeframe?
- Does the shorter-term movement provide useful detail, or is it mostly market noise?
How to review breaks of structure
A break of structure occurs when price moves beyond a level that has been relevant to the recent sequence of highs and lows. Traders often use these breaks to investigate whether directional control may be changing or continuing. However, the location, strength and follow-through of the break matter as much as the break itself.
Distinguish a break from a confirmed shift
Price can briefly move beyond a previous high or low and then return. This may be described as a failed break, a rejection or a liquidity test, depending on the trader’s framework. A market structure indicator can draw attention to the event, but it does not remove the need to examine what happens afterward.
Useful review questions include:
- Did price close beyond the prior swing, or only trade beyond it temporarily?
- Was the move supported by clear momentum, or did it lose energy quickly?
- Did subsequent candles hold the new area or return to the previous range?
- Is the break aligned with the broader trend?
- Was the broken level located near a significant range boundary or another visible reaction area?
These questions help separate a structural observation from a complete trading conclusion. A displayed break is a prompt for further analysis, not an automatic instruction to buy or sell.
Review the quality of follow-through
Follow-through refers to what price does after the initial break. Continued movement in the same direction can make the break more meaningful, while immediate rejection may weaken the interpretation. Even then, follow-through should be considered alongside volatility, timeframe and the broader chart rather than judged by a fixed rule.
One practical method is to record the break, the direction of the move and the subsequent reaction. Over time, this creates a review process that focuses on observable chart behavior instead of relying on assumptions about what every signal must mean.
How to read ranges with a market structure indicator
Ranges can create confusion because price may repeatedly move in both directions without establishing a sustained trend. A market structure indicator can help identify the sequence of reactions, but range analysis still depends on recognizing the boundaries and the location of current price within them.
Identify the range boundaries
Look for areas where price has reacted more than once. The upper boundary represents a region where upward movement has previously encountered resistance, while the lower boundary represents an area where downward movement has previously met buying interest. These are zones of observation rather than perfectly precise lines.
The middle of a range often provides less clear context than either edge. A move near the upper boundary may require a different review from a move near the lower boundary, while price in the middle can offer limited information about which side has control.
Watch for false breaks
Range boundaries are common locations for failed breaks. Price may move beyond an edge, attract attention and then return inside the established range. If an indicator marks a structural break in this setting, check whether price can remain beyond the boundary and whether the broader trend supports continuation.
A range review can therefore include three possibilities:
- Price remains inside the range and continues to rotate between its boundaries.
- Price breaks out and shows evidence of holding beyond the previous edge.
- Price briefly breaks out, fails to continue and returns to the range.
None of these outcomes should be assumed in advance. The value of the structure review is that it gives traders a consistent way to classify what is happening as new candles develop.

Combine structure with trend and momentum
Structure explains the arrangement of highs and lows, but it is only one part of chart analysis. Trend analysis helps establish directional context, while momentum analysis helps assess the strength or weakness behind a move. Considering these elements together can reduce the temptation to overreact to a single chart event.
| Observation | What it may suggest | What still needs review |
|---|---|---|
| Bullish structural break | Price has moved beyond a prior reference high | Follow-through, trend alignment and the possibility of rejection |
| Bearish structural break | Price has moved below a prior reference low | Whether selling pressure persists or price re-enters the prior area |
| Strong directional momentum | The move has notable participation or speed on the chart | Whether the move is extended and where it sits within the larger structure |
| Weak momentum in a range | Price may lack clear directional commitment | Range boundaries and whether a genuine breakout develops |
This combination is especially useful in stock technical analysis. A structural break that agrees with the broader trend and is followed by sustained movement may deserve closer study than a similar break against the prevailing direction. That does not make the first situation certain or the second impossible; it simply gives the observations different context.
Use institutional and smart money concepts carefully
Some TradingView tools combine market structure with smart money concepts, institutional activity observations or flow-related analysis. These features can provide additional chart information, but their labels should not be treated as direct evidence of what a specific institution is doing. They are analytical aids that need to be interpreted within the price chart.
When reviewing these concepts, ask whether the information adds clarity or merely adds more visual elements. A useful indicator should support a repeatable review process. If several labels point to the same area, compare them with price behavior, trend direction and momentum instead of assuming that the combination guarantees a particular outcome.
Build a repeatable chart review process
The main benefit of a market structure indicator is often consistency. A repeatable process can help traders compare different charts and review decisions after the fact. The process should be simple enough to follow without allowing the chart to become overloaded with conflicting signals.
A practical review sequence
- Define the chart context. Decide whether the market appears to be trending, ranging or transitioning.
- Mark meaningful swing points. Review recent highs and lows rather than every minor fluctuation.
- Check for a structural break. Note whether price has moved beyond a relevant reference point.
- Assess follow-through. Observe whether price holds the new area or returns to the previous structure.
- Compare trend and momentum. Look for agreement or disagreement between the structural event and broader conditions.
- Record the observation. Write down the chart condition, the signal, the context and what happened next.
This process does not produce certainty. Its purpose is to make analysis more deliberate and to reduce decisions based only on urgency, recent price movement or a single indicator label.
Keep the chart readable
Too many indicators can make structure harder to see. If a tool includes trend, momentum, market structure and smart money features, consider which elements are relevant to the question being asked. A trader reviewing a range may not need every available overlay, while someone studying a potential trend transition may want to compare structure with momentum and higher-timeframe direction.
AKMelytics – Market Intelligence Indicator is an example of a TradingView tool intended to bring several market observations into one analytical environment. Traders considering it should evaluate whether its features fit their own review process and use the available support resources for installation, activation or usage questions. The indicator should be treated as an aid for education and trading-decision analysis, not as financial advice or a guarantee of results.
Common mistakes when using structure indicators
Treating every label as a trade signal
A label identifies an event or condition according to the indicator’s logic. It does not automatically account for personal objectives, risk tolerance, position size or the wider market environment. Reviewing the chart around the label remains essential.
Ignoring failed breaks
Failed breaks are part of market behavior, especially around visible range boundaries. Focusing only on successful-looking moves can create an incomplete view of how the indicator behaves across different conditions.
Changing the interpretation after the outcome
It is easy to call a move obvious after it has already happened. A trading journal can help by recording the structure, context and planned interpretation before the next outcome is known. This encourages a more honest assessment of the method.
Using a lower timeframe without broader context
Shorter charts can show many structural changes that have little significance on a broader timeframe. Checking the larger picture can help distinguish a meaningful transition from a temporary fluctuation.
Final checklist for reviewing market structure
- Identify whether the chart is trending, ranging or transitioning.
- Review the most relevant highs, lows and boundaries.
- Ask whether a break is sustained or quickly rejected.
- Compare the structure with broader trend direction.
- Review momentum without treating it as proof of future movement.
- Consider whether smart money or flow-related information adds useful context.
- Record the observation and its outcome for later review.
A market structure indicator is most useful when it supports clear questions and consistent observation. Breaks, ranges and trend changes become easier to discuss when they are placed within the wider context of price behavior, momentum and timeframe. Used this way, the tool can contribute to a more disciplined stock technical analysis process while leaving the final interpretation and risk decisions with the trader.
Frequently asked questions
What does a market structure indicator do?
It helps organize chart observations such as swing highs, swing lows, potential breaks and changes in directional behavior. It is an analysis aid, not a guarantee of future price movement.
Is a break of structure automatically a buy or sell signal?
No. A break should be reviewed with its location, follow-through, trend context, momentum and the possibility of a failed move before any trading decision is considered.
How can a market structure indicator help with range analysis?
It can help highlight repeated reactions, possible range boundaries and moves beyond those boundaries. Traders should still check whether price holds outside the range or returns inside it.
Why should multiple timeframes be reviewed?
Different timeframes can show different structural conditions. A shorter-term break may occur within an opposing broader trend, so the larger chart can provide important context.
Can market structure be used with momentum analysis?
Yes. Structure can describe where price has moved, while momentum can provide additional information about the strength or weakness of that movement. Neither should be treated as certainty by itself.
What is the role of a TradingView market structure tool?
A TradingView tool can make selected chart observations easier to monitor and review. Its usefulness depends on how well the displayed information fits the trader’s own process and how carefully the signals are interpreted.
Does a market structure indicator eliminate trading losses?
No. Indicators cannot eliminate market uncertainty or guarantee profitable results. They should be used for structured analysis and education alongside appropriate risk awareness.


Recent Comments