
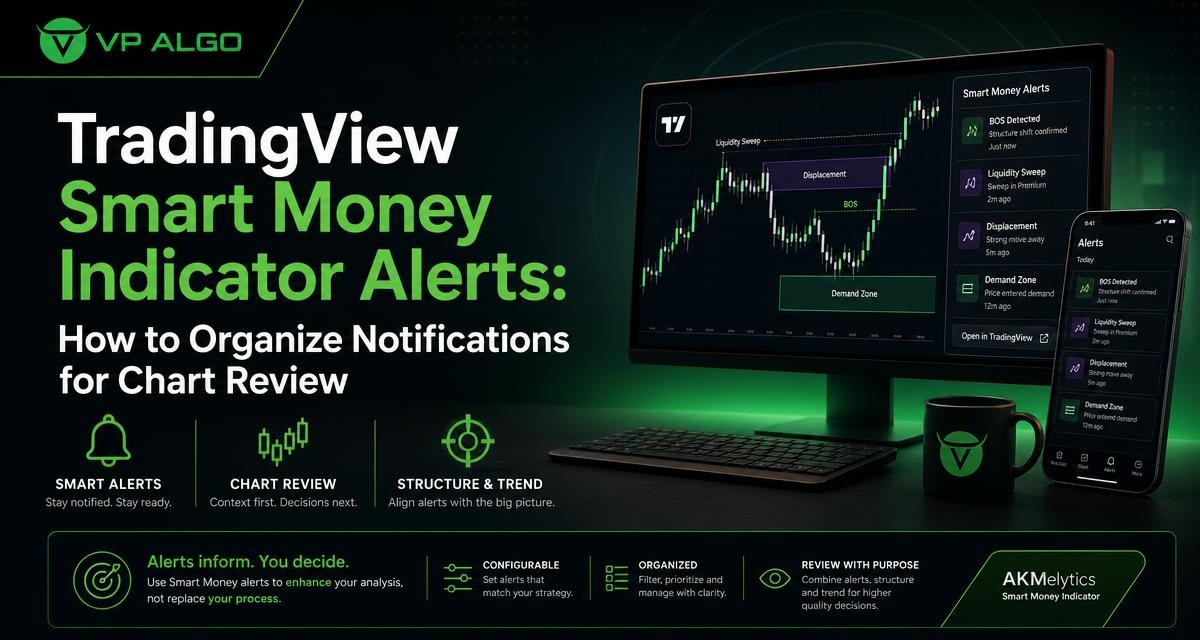
A smart money indicator for TradingView can help organize the information traders review when studying trend, momentum, market structure and potential market-flow changes. Alerts can make that information easier to notice, but they should act as prompts for chart review rather than automatic trading decisions. A practical workflow combines configurable notifications with higher-timeframe context, price structure and a deliberate confirmation process.
What TradingView indicator alerts are designed to do
An alert is a notification tied to a condition or event on a chart. Its main value is attention management: instead of watching every chart continuously, a trader can receive a prompt when a selected condition deserves closer inspection. The alert does not remove the need to open the chart, understand the surrounding price action or decide whether the setup fits a personal plan.
For smart money analysis, a notification may relate to a change in market structure, momentum, trend conditions, relative strength, market flow or another configured element. The meaning of the alert depends on the timeframe, the instrument being reviewed and the other evidence visible on the chart. One event in isolation may be useful as a starting point, but it is not the same as a complete analysis.
Why notification organization matters
Receiving too many notifications can be almost as unhelpful as receiving none. If every possible condition generates an alert, traders may start reacting to noise, repeatedly checking charts without a clear purpose or giving equal weight to events with very different importance. Organizing alerts creates a distinction between an event that deserves immediate attention and one that can wait for a scheduled review.
A useful alert system should answer three questions: what happened, where did it happen and what should be reviewed next? The notification itself may only provide the first answer. The trader’s chart-review process supplies the rest.
| Alert role | What it can prompt | What still requires review |
|---|---|---|
| Structure event | Open the chart and inspect a possible change in market structure | Whether the event is meaningful in the current trend and timeframe |
| Momentum condition | Check whether momentum is strengthening, weakening or conflicting with price | Whether momentum supports the broader market context |
| Trend condition | Review a possible shift or continuation in directional bias | Whether other timeframes agree with the observed direction |
| Flow or smart money condition | Investigate a possible change in market participation or market flow | Whether price structure and volatility provide supporting context |
| Target or risk reference | Revisit an existing analysis and its reference levels | Whether the original assumptions remain valid |
Build an alert hierarchy instead of enabling everything
Start with the events most relevant to your review process
Begin with a small set of alert types that match the way you analyze charts. If market structure is central to your process, structure events may deserve priority. If you first assess direction and then look for momentum confirmation, trend and momentum conditions may be more useful as review prompts. The goal is not to use every available feature. It is to create a manageable sequence of questions.
A simple hierarchy can include primary alerts, secondary alerts and informational conditions. Primary alerts indicate that a chart should be reviewed soon. Secondary alerts add context to a chart already under observation. Informational conditions can be recorded for later analysis rather than treated as an immediate signal.
Separate observation from decision-making
Alert names should describe an event, not make a promise about an outcome. A label such as “structure review” encourages investigation, while a label that implies certainty can encourage premature action. Clear wording helps maintain the distinction between what the indicator has identified and what the trader has independently concluded.
- Primary: conditions that cause you to open and review a chart.
- Secondary: conditions that add context to a chart already being studied.
- Informational: conditions saved for journaling, comparison or later review.
Use multiple timeframes to add context
A notification on a lower timeframe can look different when viewed against a higher-timeframe trend. This is why multi-timeframe analysis is useful when organizing TradingView indicator alerts. The alert may identify a local event, but the broader chart can show whether that event occurs during a sustained directional move, a correction or a less clear market phase.
Before treating a lower-timeframe alert as important, review the higher-timeframe structure and trend context available in your analysis. Ask whether the alert is aligned with the broader direction, occurring against it or appearing while the market lacks a clear structure. None of these situations automatically determines an outcome, but each changes how much attention the alert may deserve.
A practical timeframe review sequence
- Open the timeframe that generated the notification.
- Identify the visible structure around the event, including recent highs, lows and relevant breaks or changes.
- Move to a higher timeframe and assess the broader trend and market context.
- Return to the original timeframe to check whether momentum, flow and price behavior support the same interpretation.
- Record the conclusion before deciding whether the chart belongs on a watchlist or requires no further action.
Review market structure before reacting to an alert
Market structure gives an alert a setting. A structure-related notification may draw attention to a possible break of structure or change of character, but the trader still needs to inspect where the event occurred and what preceded it. A break within a broader directional move may be interpreted differently from an event that appears after an extended move or in a range.
Useful review questions include:
- Was the event based on a clearly visible swing or a minor fluctuation?
- Did price move decisively, or was the change limited and quickly reversed?
- Does the higher timeframe support the same structural reading?
- Are there nearby levels or areas that could make the event more significant?
- Does current volatility make the movement easier or harder to interpret?
These questions do not turn an indicator into a prediction tool. They help the trader evaluate the notification in relation to observable chart conditions.
Combine trend, momentum and flow information
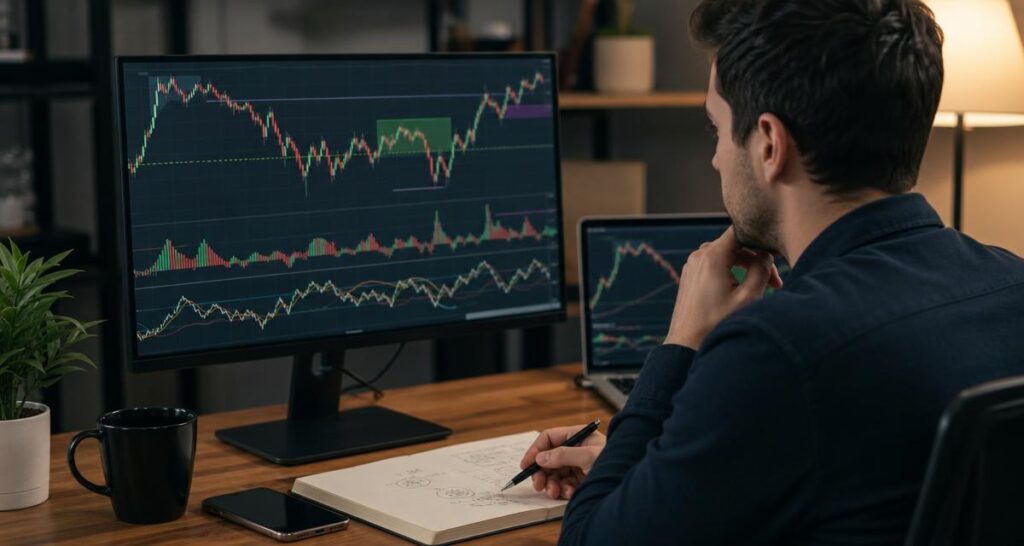
A smart money indicator may bring several analytical elements into one TradingView workspace, including trend analysis, momentum evaluation, market structure, market flow, relative strength and smart money concepts. The benefit of seeing these elements together is that the trader can compare them rather than relying on a single notification.
For example, a structure alert may deserve closer review when the trend context and momentum reading point in a similar direction. If those elements disagree, the disagreement is also useful information. It may suggest that the chart needs more observation, that the event is occurring during a transition or that the trader should avoid treating the alert as a complete setup.
| Review element | Question to ask | Possible interpretation |
|---|---|---|
| Trend | What is the broader directional context? | The alert may be aligned with, counter to or separate from the broader trend. |
| Momentum | Is movement strengthening, weakening or mixed? | Momentum can add context but should not be treated as a guarantee. |
| Structure | What changed in the sequence of highs and lows? | The event may warrant closer inspection of continuation or transition. |
| Market flow | Is there a notable change in the flow information displayed by the tool? | The chart may deserve further comparison with price and timeframe context. |
| Relative strength | Does the instrument show a different degree of strength than the surrounding context being reviewed? | This can become an additional observation rather than a standalone decision. |
Create a repeatable alert-review checklist
A checklist reduces the chance that each notification will be handled emotionally or inconsistently. It can be as short as a few questions, provided the same questions are applied each time. The checklist should support the trader’s own method rather than dictate a universal strategy.
Example chart-review checklist
- What alert was triggered, and on which timeframe?
- What was price doing immediately before the event?
- What does the higher-timeframe trend show?
- Does market structure support the alert’s relevance?
- Do momentum, flow or relative-strength observations agree or conflict?
- Are volatility-based target or risk reference levels visible, and are they appropriate for further review?
- What would invalidate the current interpretation?
- Should the chart be monitored, documented or removed from consideration?
The final question is valuable because not every alert needs follow-up. A disciplined process includes the option to do nothing when the context is unclear or the event does not fit the trader’s rules.
Use target and risk references as planning aids
Some TradingView tools display volatility-based target and risk reference levels. These can help structure a review by showing where a trader might examine the relationship between potential movement and invalidation. They should be treated as analytical references, not as promises about where price will move.
When reviewing these levels, consider whether they fit the current market structure and timeframe. A reference level that looks reasonable on one chart may have a different meaning when nearby structure, volatility or a higher-timeframe area is considered. The purpose is to make assumptions visible and reviewable, not to remove uncertainty from trading.
Keep alerts useful over time
Alert organization is not a one-time setup. Review the notifications after using them for a period of chart analysis. Look for repeated alerts that add little information, conditions that arrive too late to be useful for your workflow and alerts that are so broad they produce unnecessary chart checks.
A journal can help. Record the alert type, timeframe, surrounding context and your eventual decision to monitor, document or ignore it. This does not establish future performance, but it can reveal whether your notification settings are helping you follow a consistent review process.
- Remove alerts that create repeated noise.
- Rename conditions so their purpose is immediately clear.
- Group alerts by timeframe or review priority where practical.
- Reassess settings when your chart-review method changes.
- Keep the number of active notifications manageable.
How AKMelytics can fit into a TradingView workflow
AKMelytics – Smart Money Indicator is a TradingView technical analysis tool that combines information related to momentum, trend analysis, market structure, market flow, relative strength and smart money concepts. Its described features include multi-timeframe analysis, BOS and CHoCH structure events, Fibonacci projections, volatility-based target and risk reference levels, dashboard context and configurable TradingView alerts.
These features can support a structured chart-review workflow when used as analytical references. Traders can configure relevant alerts, open the affected chart and compare the notification with trend, momentum, structure and broader market context. The tool is intended to assist analysis and decision-making, not to provide financial advice or guarantee results.
VP ALGO TRADING offers the indicator through its website. The company also provides a request-based seven-day free trial for its indicator and Telegram channel. After purchase, customers are instructed to provide their TradingView ID by email for product access, and support is available for installation, activation or usage assistance.
Final principles for using smart money alerts
The strongest alert workflow is selective, contextual and repeatable. Notifications should help you decide which chart deserves attention, while manual review determines what the event means in its surrounding environment. Trend, momentum, market structure, flow and timeframe context each contribute a different part of the analysis.
A smart money indicator for TradingView can make chart review more organized, but it does not eliminate uncertainty or replace independent judgment. Use alerts to improve attention management, document your reasoning and maintain a consistent process. Treat every notification as an invitation to investigate rather than an automatic decision.
Frequently Asked Questions
What is a smart money indicator for TradingView?
It is a TradingView analysis tool that can combine information such as trend, momentum, market structure, market flow, relative strength and smart money concepts. It is used to support chart review rather than provide guaranteed outcomes.
What are TradingView indicator alerts?
TradingView indicator alerts are notifications connected to selected indicator conditions or events. They can prompt a trader to open a chart and review the surrounding context.
Should an alert be treated as a buy or sell decision?
No. An alert should be treated as a review prompt. The trader should assess timeframe context, market structure, trend, momentum and personal rules before making any decision.
How many alerts should a trader create?
There is no universal number. Start with the conditions most relevant to your process and keep the system manageable enough that notifications do not become distracting noise.
Why should higher-timeframe context be reviewed?
A lower-timeframe event may look different when viewed within a broader trend or market structure. Higher-timeframe review helps place the notification in a wider context.
Can AKMelytics alerts replace manual chart analysis?
No. AKMelytics is designed to assist analysis and decision-making. Its alerts and displayed information should be reviewed alongside price action, timeframe context and the trader’s own process.


Recent Comments