
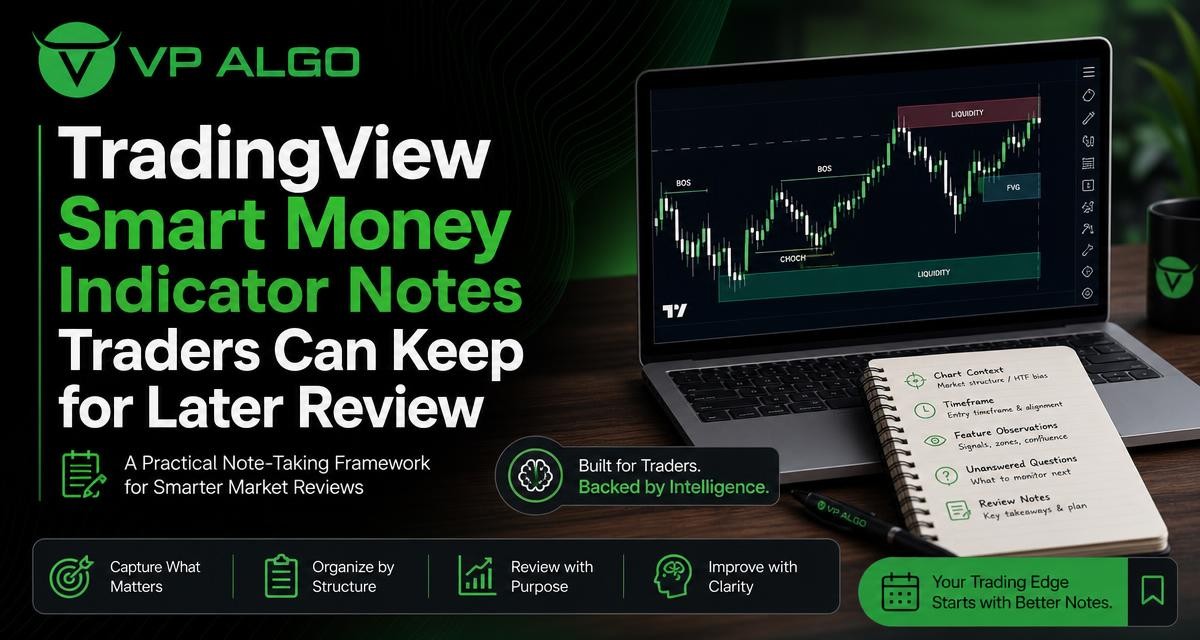
A smart money indicator for TradingView can place several types of market information on one chart, but the display is only the beginning of the review process. A useful note records what the chart was showing, which timeframe provided the context, what the indicator features suggested, and which questions remained unanswered. This approach helps traders study market conditions more consistently without treating an indicator as a guarantee of a particular outcome.
Why written notes matter when using smart money concepts
Smart money concepts often involve several connected observations: market structure, trend direction, momentum, possible institutional activity, and the relationship between higher and lower timeframes. When these observations remain only on a chart, it can be difficult to remember why a setup looked interesting or why it was rejected later. Notes create a record of the reasoning behind the observation.
Good notes are not a prediction journal designed to prove that every idea was correct. They are a research tool. A trader can use them to compare similar chart conditions, identify recurring areas of confusion, and separate a clear signal from a chart that simply contains many visual features. The goal is to improve the quality of review, not to create certainty where the market does not offer it.
Start every review with basic chart context
Before interpreting an indicator, record the basic information that defines the chart. Without this information, a later review may be difficult to reproduce. A note should identify the instrument shown in TradingView, the chart date and time, the selected timeframe, and any other chart settings that materially affect the interpretation.
The same pattern or indicator reading can have a different meaning depending on the surrounding price action. For that reason, begin with a short description rather than immediately writing that the chart is bullish or bearish. Describe what is visible first, then explain how the indicator contributes to the assessment.
- Instrument: Record the asset or symbol shown on the chart.
- Date and review time: Note when the observation was made.
- Primary timeframe: Identify the timeframe used for the detailed review.
- Higher-timeframe reference: Record whether a broader chart was checked.
- Chart state: Describe whether price is trending, ranging, consolidating, or changing direction.
- Review purpose: State whether the note is for education, setup research, or post-chart review.
These details keep the note anchored to an actual chart state. They also prevent a common review problem: remembering the indicator message but forgetting the market environment in which it appeared.
A practical note template for a smart money indicator for TradingView
A repeatable template makes it easier to compare one chart review with another. The template does not need to be complicated. It should capture the most relevant evidence while leaving space for uncertainty and follow-up questions.
| Note area | What to record | Why it helps |
|---|---|---|
| Chart context | Symbol, date, primary timeframe and broader market condition | Places the observation in a specific setting |
| Trend assessment | Observed direction, changes in direction and higher-timeframe relationship | Separates local movement from broader context |
| Market structure | Relevant highs, lows, breaks or shifts visible on the chart | Shows how the directional view was formed |
| Momentum | Whether momentum confirms, weakens or conflicts with structure | Highlights agreement and divergence between features |
| Institutional activity | Any displayed flow or activity indication and its location on the chart | Records the feature without overstating what it proves |
| Unanswered questions | What is unclear, missing or worth reviewing later | Turns uncertainty into a specific research task |
| Later review | What changed after the note was made | Allows the original observation to be evaluated fairly |
The table can be copied into a journal, spreadsheet, or document. The format matters less than using the same categories often enough to make comparisons meaningful.
Record the higher-timeframe story before the detailed chart
Multi-timeframe analysis is easier to understand when the broader view is written first. Begin by describing the higher-timeframe trend or range, then explain whether the primary chart appears aligned with it or temporarily moving against it. This order reduces the risk of treating a short-term movement as the complete market story.
For example, a note might state that the broader chart is showing a directional move while the selected timeframe is retracing within that move. Another note might describe a broad range with no clear directional structure and a shorter chart that is moving between the range boundaries. These descriptions are more useful than a simple label because they explain the relationship between timeframes.
Questions for the timeframe section
- What is the broader structure visible on the higher timeframe?
- Is the selected timeframe aligned with that structure or moving against it?
- Could the apparent trend be only a short-term movement within a larger range?
- Does the lower-timeframe information add context, or does it make the chart harder to interpret?
- Which timeframe should be revisited during the next review?
A timeframe note should not imply that one timeframe is always more reliable than another. Each timeframe answers a different question. The useful habit is to state which question each chart is being used to investigate.
Document market structure without relying on labels alone
A market structure indicator can help organize observations about swings, breaks, and changes in directional behavior. However, the note should describe the visible sequence rather than copy an on-screen label without context. Write down the relevant highs and lows, whether price has maintained or changed its previous sequence, and where the structural observation occurred.
Structure notes can also distinguish between a confirmed observation and a developing one. A developing move may look significant while it is still unfolding, but a later candle may change the interpretation. Recording the status of the observation helps prevent hindsight from being mixed with the original chart reading.
Useful structure language
- Established: The chart has already displayed a sequence that supports the observation.
- Developing: The possible change is visible but not yet fully clear in the selected context.
- Conflicted: Different timeframes or chart features are not pointing in the same direction.
- Unclear: The chart does not provide enough information for a confident structural description.
This vocabulary keeps the journal descriptive. It also makes it easier to review whether the interpretation was reasonable based on information available at that time.
Separate trend, momentum and institutional activity
Trend analysis, momentum evaluation, and institutional activity are related, but they are not interchangeable. A trend observation describes directional behavior over the chosen context. Momentum describes the strength or persistence of movement. An institutional flow feature may highlight activity or conditions that the indicator is designed to monitor. Writing each observation separately prevents one feature from being treated as proof of another.
For example, a chart may show a directional trend while momentum is weakening. It may also show a momentum reading that does not agree with the higher-timeframe structure. That disagreement is not a problem to hide; it is a reason to record the chart as conditional or unresolved. A useful journal captures both agreement and conflict.
| Feature | Note this | Avoid writing |
|---|---|---|
| Trend | Direction, timeframe and whether the move is established or developing | That trend direction guarantees a future move |
| Momentum | Whether movement appears to strengthen, weaken or conflict with structure | That momentum alone confirms a trading outcome |
| Market structure | The relevant swing sequence or structural change | That a single label explains the entire chart |
| Institutional activity | Where the feature appears and how it relates to surrounding price action | That the display proves the actions of a specific institution |
| Smart money conditions | The combination of relevant observations and remaining uncertainty | That the indicator removes the need for independent review |
This separation is particularly useful when using a TradingView trading indicator that combines several analytical elements. It shows which part of the interpretation came from which feature and where the evidence was incomplete.

Write down what the indicator showed, not just what you expected
Confirmation bias can affect chart reviews when traders record only the features that support an existing opinion. To reduce this problem, write the indicator observations before writing a conclusion. Include information that challenges the initial view, such as weakening momentum, conflicting timeframes, unclear structure, or an activity feature that does not align with the broader chart.
A simple two-column method can help. In the first column, write “supports the current view.” In the second, write “challenges the current view.” The result is not a forced balance between two sides; it is a way to make overlooked information visible.
Example of a neutral observation format
Supports: The selected timeframe appears aligned with the broader directional structure, and the displayed momentum condition is moving in the same general direction.
Challenges: The broader chart may still be within a range, the structural change is developing, and the activity feature requires further review rather than immediate interpretation.
Current conclusion: The chart is worth monitoring, but the note does not establish a guaranteed result or replace independent decision-making.
Use unanswered questions as the most valuable part of the note
Many traders record what they believe they understand but leave no space for what remains uncertain. That makes later study less productive. Every review should end with a short list of unanswered questions. These questions can concern the indicator, the chart, or the trader’s own interpretation.
- Which timeframe provides the clearest structural context?
- Was the apparent change in direction established or still developing?
- Did momentum confirm the structure, or did it weaken during the move?
- How did the displayed activity feature relate to nearby price behavior?
- What information would make the current interpretation less convincing?
- Which part of the chart should be compared with another example?
Questions like these turn a static screenshot into a study plan. They also discourage the assumption that a smart money trading indicator should answer every market question immediately.
Review old notes without rewriting the original story
Later review is most useful when the original note remains visible. Do not replace an earlier observation with a new interpretation simply because more chart information is now available. Instead, add a dated follow-up beneath the original entry. State what changed, what stayed consistent, and which part of the original reasoning was incomplete.
A follow-up can use three short headings: What happened on the chart, What the original note got right or wrong, and What to investigate next. This method does not turn the journal into a record of wins and losses. It creates a more honest record of how chart interpretation changes as new information appears.
It is also useful to review groups of notes rather than isolated examples. Look for repeated issues, such as relying too heavily on a lower timeframe, confusing momentum with trend, or failing to record conflicting signals. Patterns in the notes may reveal a process problem that is not obvious on a single chart.
How an indicator can fit into a structured TradingView workflow
VP ALGO TRADING develops and sells indicators and algorithmic trading tools for TradingView. Its AKMelytics – Market Intelligence Indicator is designed around features related to trend analysis, momentum signals, market structure, institutional flow monitoring, multi-timeframe trend assessment, and smart money analysis. These features can provide organized information for a review workflow, while the trader remains responsible for interpreting the chart and deciding how to use the information.
A practical workflow is to begin with the broader chart, move to the selected timeframe, record each feature separately, and then list agreements, conflicts, and unanswered questions. This keeps the indicator in an analytical role rather than treating it as an automatic decision-maker. The company positions its tools for educational and trading-decision assistance purposes, not as financial advice.
Suggested review sequence
- Open the relevant TradingView chart and record the basic context.
- Check the broader timeframe before studying the detailed view.
- Describe trend and market structure in plain language.
- Record momentum and institutional activity observations separately.
- Compare the features for agreement or conflict.
- Write unanswered questions before forming a final review statement.
- Return to the note later and add a dated follow-up rather than rewriting it.
This process can be adapted to different chart-review habits. The important point is to preserve the distinction between what the indicator displays, what the trader infers, and what remains unknown.
Keep the framework simple enough to use consistently
A note-taking system that takes too long may be abandoned, while a note that contains only a direction label may not support meaningful review. Start with the smallest format that captures context, timeframe, feature observations, and questions. Add detail only when it helps answer a recurring research problem.
The purpose of a smart money indicator for TradingView is not to replace disciplined observation. Used alongside a clear journal, it can help traders organize multiple chart features and revisit their reasoning with greater clarity. The strongest notes remain specific, cautious, and open to revision when later chart information changes the picture.
Frequently asked questions
What should I record first when using a smart money indicator for TradingView?
Start with the symbol, date, primary timeframe, higher-timeframe context, and broad chart condition. Then record what the indicator features show and which questions remain unresolved.
Why should trend and momentum be written as separate observations?
Trend describes directional behavior, while momentum describes the strength or persistence of movement. They can agree or conflict, so combining them too early can hide useful information.
How can I take notes about market structure?
Describe the relevant highs, lows, breaks, or developing changes and identify the timeframe. Record whether the observation is established, developing, conflicted, or unclear.
Does an institutional flow feature prove that institutions are buying or selling?
No. Record what the indicator displays and where it appears on the chart, but do not treat the display as proof of a specific institution’s actions or as a guaranteed market outcome.
Should I write down conflicting signals?
Yes. Conflicting trend, momentum, structure, or timeframe information is important context. Recording it helps prevent confirmation bias and identifies areas for further review.
Can these notes be used as financial advice?
No. The framework is for educational chart review and trading-decision assistance. It does not provide personalized financial advice, guarantee results, or eliminate trading risk.
What is the best way to review old TradingView notes?
Keep the original note intact and add a dated follow-up explaining what changed, what remained consistent, and what you would investigate next. Reviewing groups of notes can reveal repeated process issues.


Recent Comments