
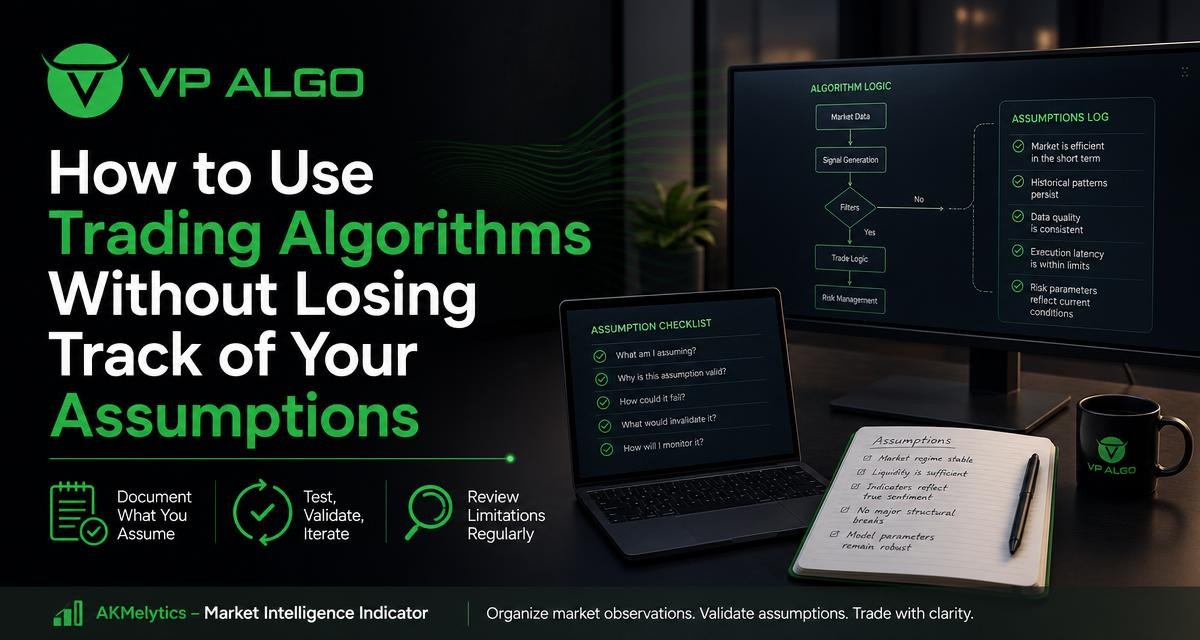
Trading algorithms can make market observations easier to organize, but they do not remove the need for clear reasoning. Whether an algorithm highlights trend, momentum, market structure, or possible institutional activity, the output still depends on assumptions about price data, timing, conditions, and interpretation. A practical way to use trading algorithms is to document those assumptions before relying on an indicator, then review whether they remain appropriate as market conditions change.
Why assumptions matter when using trading algorithms
An indicator may display a trend, momentum reading, market structure event, or other market observation in a clean visual format. That presentation is useful because it can help traders work through information consistently. However, a clear signal is not the same as a complete explanation of what the market will do next.
Every algorithmic tool reflects choices made during its design. These choices may relate to the price data being processed, the time frame being observed, how trend changes are identified, how momentum is measured, or how a potential setup is displayed. If a trader does not understand or record these assumptions, it becomes easy to treat an indicator output as a fact rather than as one interpretation of market information.
Documenting assumptions creates a useful separation between what the tool shows and what the trader believes it means. That distinction supports better review and reduces the risk of changing a trading plan after seeing an unexpected result.
What to document before using an algorithmic indicator
A short written record is often enough. The goal is not to predict every market event or create unnecessary paperwork. It is to make the logic behind your use of a trading algorithm visible to you before the pressure of a live decision affects your interpretation.
1. Define the role of the tool
Start by stating what the indicator is supposed to do in your process. Is it being used to organize observations, identify a trend, assess momentum, examine market structure, or filter possible setups? A tool that helps with market context should not automatically be treated as a complete entry and exit system.
For example, a trader might write: “I use this TradingView indicator to assess trend and market structure before reviewing a potential setup.” That statement is more precise than saying, “The indicator tells me when to trade.” It leaves room for confirmation, risk assessment, and independent review.
2. Record the market and time frame
Note the instrument or chart being reviewed and the time frame used. The same price movement can appear different on a short-term chart and a higher-time-frame chart. A momentum observation on one chart may not describe the broader market context.
Keeping this information with each review also helps identify whether your conclusions are consistent. If an indicator seems reliable only under certain chart conditions, that is an important limitation to record rather than overlook.
3. Write down the interpretation rule
Describe what you believe a displayed condition means and what it does not mean. A trend indication might suggest that recent price movement has developed in a particular direction, but it does not establish that the movement will continue. A market structure observation may help frame the chart, but it does not guarantee a specific outcome.
Use language that reflects uncertainty accurately. Terms such as “supports further review,” “shows a condition to monitor,” or “adds context” are often more appropriate than “confirms a winning trade.” This keeps the written process aligned with what an indicator can reasonably provide.
4. List the assumptions behind your decision
Assumptions can include expectations about trend continuation, the relevance of a momentum reading, the importance of a structure level, or the meaning of apparent institutional activity. They can also include practical assumptions about data quality, chart settings, and whether a signal remains relevant after a delay.
Write each assumption as a statement that could later be reviewed. For example:
- The broader trend is relevant to this observation.
- The selected time frame is suitable for the decision being considered.
- The displayed market structure has not been invalidated by later price movement.
- The momentum reading is being used as context rather than as a standalone instruction.
- The chart data and settings are appropriate for the analysis.
How to review an algorithm’s limitations
Reviewing limitations does not mean rejecting algorithmic tools. It means understanding the boundary between organized analysis and certainty. A trading algorithm processes defined inputs according to its design. It cannot know your financial circumstances, emotional state, changing objectives, or every factor affecting a market.
Signals are observations, not guarantees
A signal or highlighted condition can help draw attention to part of a chart. It does not guarantee that the market will respond in the expected way. Markets can change direction, remain range-bound, or produce conflicting evidence after an observation appears.
For that reason, avoid writing rules that treat every output as an automatic instruction. Instead, specify what additional review is required. This may include checking higher-time-frame context, assessing whether momentum agrees with the trend, or determining whether the market structure remains meaningful.
Historical behavior has limits
Looking back at charts can help a trader understand how an indicator behaves in different conditions. It can reveal situations in which a signal appears late, conflicts with another observation, or becomes difficult to interpret during sideways price action. That review is useful, but historical behavior should not be treated as a promise about future results.
When reviewing past examples, record unfavorable and ambiguous cases as carefully as attractive examples. A process that collects only successful-looking signals can create false confidence and hide the conditions in which the tool is less useful.
Settings affect interpretation
Chart settings, time frames, and other configurable choices can affect what a trader sees. Changing settings after an unfavorable observation may make the chart look more appealing without improving the underlying decision process.
Keep a record of the settings used during your review. If you change them, state why and apply the new approach consistently for a reasonable period of observation. This makes it easier to distinguish a genuine improvement from an adjustment made in response to one recent outcome.
Using trading technical analysis as a structured review process
Trading technical analysis works best when it is treated as a framework for examining price behavior rather than as a collection of isolated signals. Trading algorithms can support that framework by bringing several observations into one workflow. For example, a trader may review trend direction, momentum, market structure, and signs of institutional activity before deciding whether a chart deserves further attention.
The value comes from the order and discipline of the review. A tool should help you ask better questions, not encourage you to skip them.
| Area of review | Question to document | Limitation to remember |
|---|---|---|
| Trend | What direction or range is visible on the selected time frame? | A trend can weaken, pause, or reverse. |
| Momentum | Does recent movement support or conflict with the broader context? | Momentum can change quickly and may not identify timing by itself. |
| Market structure | Which highs, lows, breaks, or levels are being used in the analysis? | Structure is an interpretation of price behavior, not a guaranteed forecast. |
| Institutional or smart money observations | What evidence is being used to describe activity or participation? | Displayed activity should be treated as an analytical observation, not proof of future direction. |
| Decision process | What additional checks are required before acting? | An indicator cannot replace personal risk assessment or independent judgment. |
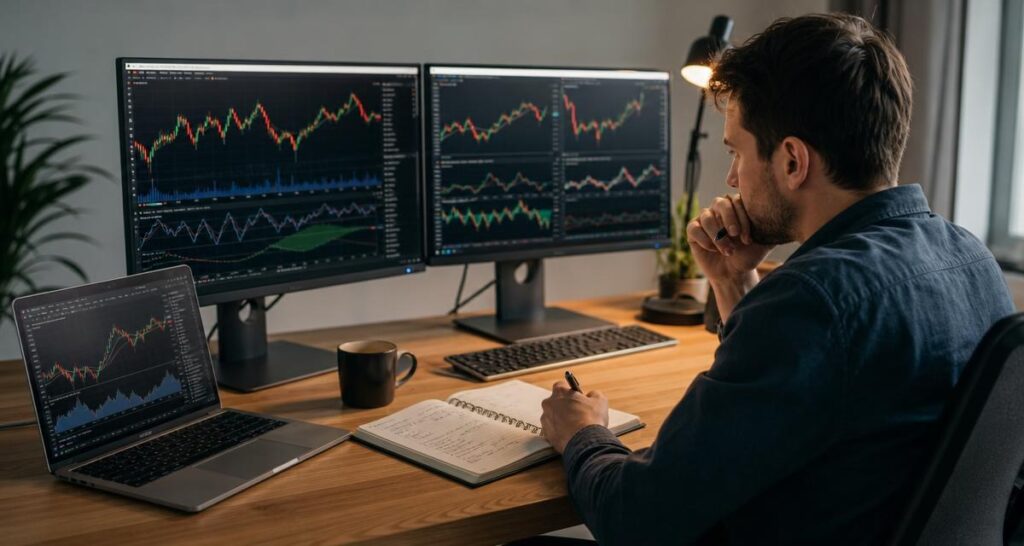
A practical journal template for algorithm-assisted analysis
A journal can be as simple as a table or a note attached to a chart. The important point is to record the reasoning before the outcome is known. This reduces hindsight bias and helps you see whether your process changes whenever a result is disappointing.
Before reviewing a possible setup
- Record the date, chart, instrument, and time frame.
- State the purpose of the indicator in this review.
- Describe the visible trend and market structure without predicting the result.
- Note whether momentum supports, conflicts with, or does not clarify the observation.
- List the assumptions that must remain true for the analysis to stay relevant.
- Write down what evidence would invalidate your interpretation.
After the market develops
- Compare the original observation with what actually occurred.
- Identify which assumption changed or proved too narrow.
- Record whether the indicator was early, late, conflicting, or simply misunderstood.
- Separate a process error from an unfavorable market outcome.
- Update your notes without rewriting the original decision.
This approach helps prevent the common mistake of judging an indicator only by whether a particular chart movement followed its display. The more useful question is whether the tool helped you follow a clearly defined and reviewable process.
How a market intelligence indicator can fit into the workflow
VP ALGO TRADING develops and sells indicators and algorithmic trading tools for TradingView. Its supplied market intelligence offering, AKMelytics – Market Intelligence Indicator, is intended to help traders organize observations related to areas such as trend, momentum, market structure, institutional activity, and smart money analysis.
Used responsibly, an indicator with several analytical components can serve as a structured starting point. A trader can use the displayed information to identify what deserves closer examination, then document the reasoning behind any conclusion. The tool should remain part of the review process rather than becoming the process itself.
When evaluating a product such as a smart money indicator or market structure indicator, ask practical questions before adopting it:
- Which market observations does it help organize?
- Which time frames and chart conditions are relevant to your intended use?
- Can you explain each displayed feature in your own words?
- What does the indicator not measure or decide for you?
- How will you record conflicting signals?
- How will you review the tool’s usefulness without selecting only favorable examples?
VP ALGO TRADING positions its indicators for educational and trading-decision assistance purposes rather than as financial advice. That distinction is consistent with a disciplined workflow: the indicator can support observation and organization, while the trader remains responsible for interpretation, risk decisions, and reviewing limitations.
Common mistakes that cause traders to lose track of assumptions
Turning a filter into a full strategy
A trend or momentum filter may narrow attention, but it may not define every part of a trading strategy. If you use a filter, write down what other decisions remain open, including how you assess context and what would make the observation irrelevant.
Changing the explanation after the result
Once a chart has developed, it is tempting to claim that the indicator “predicted” the move or that a missed condition was obvious. Preserve the original notes so that your review is based on what was known at the time, not on a reconstructed explanation.
Ignoring conflicting evidence
Trend, momentum, structure, and other observations may not agree. Conflict is not necessarily a defect; it may be information about uncertainty. Record the conflict and decide in advance whether it means waiting, conducting more analysis, or rejecting the setup from your process.
Assuming more features mean more certainty
An indicator with several components can provide more context, but additional displays do not automatically make a conclusion more reliable. Focus on whether each feature has a defined role and whether it changes your analysis in a way you can explain.
A simple checklist for ongoing review
Use this checklist whenever you review your use of trading algorithms:
- Can I explain what the algorithm is showing without calling it a prediction?
- Have I recorded the chart, time frame, settings, and purpose of the review?
- Which assumptions support my interpretation?
- What evidence would challenge or invalidate those assumptions?
- Have I considered conflicting trend, momentum, or market structure information?
- Am I reviewing both favorable and unfavorable examples?
- Am I making a decision based on a defined process rather than a single visual signal?
If you cannot answer these questions, the next step may be to improve your documentation rather than add another indicator. Better notes often reveal whether the problem is the tool, the interpretation, the settings, or the absence of a clearly defined process.
FAQ
Do trading algorithms make trading decisions automatically?
Not necessarily. Many trading algorithms and indicators organize market information or highlight conditions for review. Their role depends on the specific tool and how the trader incorporates it into a broader process.
Why should I document assumptions when using an indicator?
Documentation shows what you believed before the outcome was known. It helps identify changing interpretations, hidden biases, and limitations that may otherwise be overlooked.
Can a smart money indicator guarantee the direction of the market?
No. A smart money indicator can present observations related to smart money concepts or market activity, but it cannot guarantee a future market direction or eliminate trading losses.
How does trading technical analysis fit with algorithmic tools?
Trading technical analysis provides a framework for examining price behavior. An algorithmic tool can organize observations about trend, momentum, and market structure within that framework, while the trader remains responsible for interpretation.
What should I do when an indicator gives conflicting information?
Record the conflict instead of forcing a conclusion. Review the time frame, trend, momentum, and market structure, then follow a predefined rule for waiting, conducting further analysis, or declining to act.
Is an algorithmic indicator a substitute for financial advice?
No. An indicator is an analytical tool. VP ALGO TRADING positions its tools for educational and trading-decision assistance purposes rather than as financial advice, so users should make their own informed decisions.
How often should I review my assumptions?
Review them whenever you change settings, use a different chart or time frame, notice recurring conflicts, or update your trading process. Regular review is more useful than changing assumptions after every individual result.


Recent Comments