
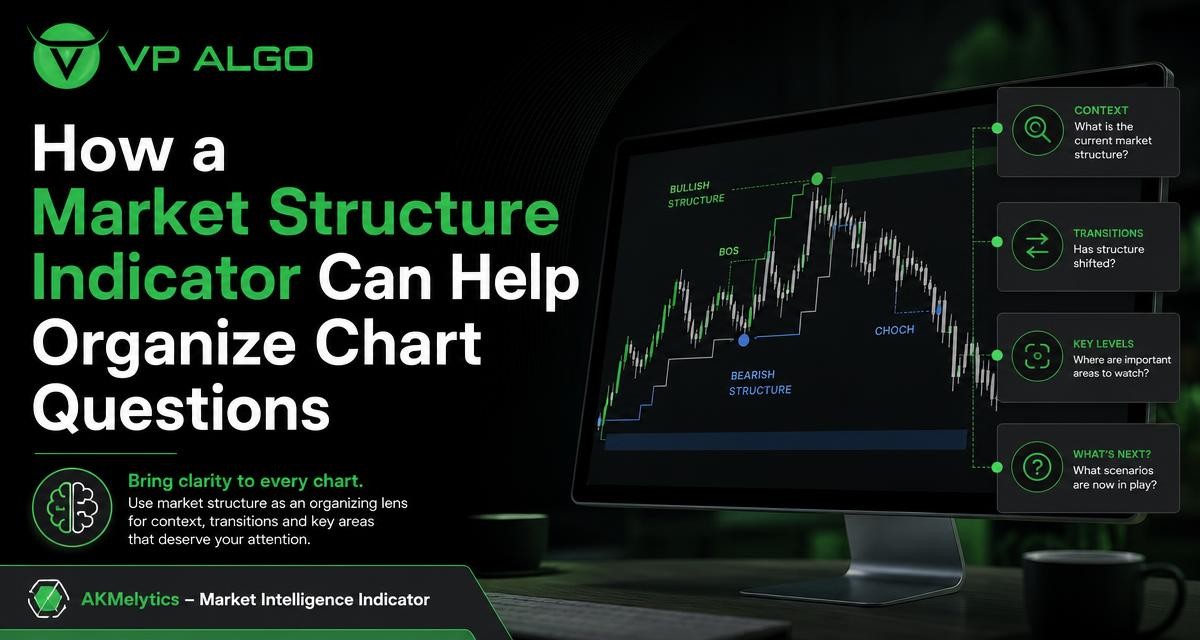
A market structure indicator can give traders a clearer way to organize questions about a chart. Instead of treating every candle, signal, or price movement as equally important, market structure creates a framework for reviewing context, transitions, momentum, and areas that may deserve closer attention. It does not remove uncertainty from trading, but it can help turn a crowded chart into a more deliberate analysis process.
What market structure means on a trading chart
Market structure describes how price develops through swings, highs, lows, breaks, and transitions. A trader may ask whether price is generally advancing, declining, or moving sideways; whether a recent move supports the existing direction; and whether the latest swing represents continuation or a possible change in behavior.
These questions are useful because a single candle rarely explains the broader market condition. A large bullish candle may appear during an established advance, after a period of consolidation, or inside a wider decline. The same candle can therefore have different significance depending on the structure around it.
A market structure indicator is designed to make some of this organization easier to see. Depending on its features, it may help identify relevant swing points, highlight structural breaks, or present trend information in a way that allows the trader to review the chart more consistently.
Why chart questions can become difficult to organize
Trading charts contain several types of information at once. Price action, momentum, trend direction, possible institutional activity, and smart money concepts may all be part of a trader’s review. Without a defined order of questions, analysis can become a collection of disconnected observations.
For example, a trader might notice a bullish pattern while the broader structure remains bearish. Another trader might see a momentum improvement and immediately treat it as a confirmed trend reversal. These interpretations may overlook the difference between a short-term movement and a meaningful structural transition.
Market structure can provide a starting point for separating those ideas. It encourages the trader to consider the larger arrangement of price before interpreting a smaller signal. This does not make the interpretation automatically correct, but it can reduce the chance of basing a conclusion on one isolated chart event.
The three main questions a market structure indicator can organize
1. What is the current context?
The first question is whether the chart is showing a recognizable directional condition or a less decisive range. A sequence of higher highs and higher lows may support an advancing structure, while lower highs and lower lows may support a declining structure. Alternating swings can suggest that the market requires more caution because direction is less established.
Context also includes the timeframe being reviewed. A chart may show upward movement on a shorter timeframe while a broader timeframe remains in a decline. A structure tool can help the trader label or compare these observations rather than assuming that one timeframe represents the entire market.
2. Has the market transitioned?
The second question concerns change. A break of a previous swing can be relevant, but its meaning depends on the surrounding price action and the level being tested. Traders may want to distinguish between a move that supports continuation and one that raises a question about a possible transition.
A market structure indicator can draw attention to these events, helping the trader investigate what happened before and after the break. The indicator should be treated as an organizing aid rather than a final verdict. Price can move through a level and later return, fail to continue, or develop into a different structure.
3. Which areas deserve closer review?
Not every section of a chart deserves equal attention. A recent structural break, a major swing area, a sharp change in momentum, or a location where several observations overlap may justify a closer review. The purpose is not to predict what must happen next, but to identify where additional analysis may be useful.
This approach can make chart work more efficient. Instead of scanning every candle with the same level of attention, the trader can first establish the structure and then focus on areas that are more relevant to the current question.
How structure relates to trend and momentum
Trend and momentum are related to market structure, but they are not identical. Trend analysis asks about the direction of price over a selected period. Momentum analysis considers the strength or speed of a move. Market structure focuses on the arrangement and sequence of price swings.
These perspectives can complement each other. For instance, a market may retain an upward structure while momentum weakens. That observation does not automatically mean the trend has ended. It may instead tell the trader to examine whether the next pullback holds an important swing area.
Likewise, momentum can improve during a broader downward structure. A short-term rally may be meaningful for the selected timeframe, but it should not automatically be described as a complete reversal of the wider trend. Keeping the concepts separate helps the trader avoid treating one type of evidence as proof of another.
| Chart question | Relevant perspective | What to review |
|---|---|---|
| What direction is price generally taking? | Trend and structure | Sequences of highs, lows, and broader swing behavior |
| Is the latest move gaining or losing force? | Momentum | The strength and persistence of the recent movement |
| Could the current behavior represent a change? | Structure transition | Breaks, retests, failed continuation, and subsequent price action |
| Where should analysis become more detailed? | Context and confluence | Key swings and areas where several observations meet |
Using smart money concepts without losing structure
Smart money concepts are often used to discuss market structure, liquidity, institutional activity, and areas where price may react. These ideas can add another layer to chart analysis, but they are most useful when connected to a clear question.
For example, rather than marking every possible area on a chart, a trader might first ask whether the broader structure is advancing, declining, or unclear. The trader can then review whether a potential smart money area appears near an important swing, follows a structural event, or conflicts with the higher-timeframe context.
This order matters because a label by itself does not explain the entire market. A zone or pattern may attract attention, but its relevance still depends on timeframe, price behavior, momentum, and what happens after the area is reached. A market structure indicator can help provide the organizing layer around which these additional observations are considered.

A practical review process for a TradingView chart
Traders using TradingView can create a repeatable review process by asking broad questions before moving to more specific details. The following sequence is one way to organize the chart without treating any indicator output as a guaranteed forecast.
- Choose the timeframe. Decide which timeframe is being analyzed and avoid mixing short-term observations with broader conclusions without identifying the difference.
- Describe the broad structure. Review the recent sequence of highs, lows, and significant swings. Classify the condition as directional, transitioning, or unclear if that description is appropriate.
- Mark the latest structural event. Note whether price has broken, respected, or failed to hold an area that was previously important to the structure.
- Review trend and momentum separately. Ask whether momentum supports the current direction, weakens it, or provides mixed information.
- Examine possible smart money or institutional activity areas. Consider their location in relation to the established structure rather than viewing them in isolation.
- Identify the unanswered question. Decide what needs further review, such as continuation, rejection, a retest, or a change in the broader structure.
- Record the reasoning. Writing down the context and uncertainty can make it easier to evaluate the analysis later without relying on memory.
This process is intentionally analytical rather than predictive. It helps define what the chart appears to be showing and what remains uncertain. A structured review can support more consistent decision-making, but it cannot guarantee a particular market outcome.
How an indicator can support, rather than replace, analysis
An indicator can save time by displaying selected information in a consistent format. The AKMelytics – Market Intelligence Indicator is designed for TradingView and includes features related to trend analysis, momentum signals, market structure, institutional flow monitoring, multi-timeframe trend assessment, and smart money analysis.
Those features can be useful when a trader wants to bring several related questions into one review process. A trader may begin with the market’s broader structure, compare it with trend information across timeframes, and then investigate momentum or institutional activity in the areas that appear most relevant.
Even with a feature-rich TradingView indicator, the trader remains responsible for interpreting the chart and managing uncertainty. Indicator readings may require context, and different settings or timeframes can change how a movement is presented. The purpose is to support chart review and trading-decision assistance, not to provide financial advice or remove the need for judgment.
Common mistakes when reading market structure
Focusing on one break without reviewing what follows
A structural break can attract attention, but the next price behavior also matters. A move may continue, pause, return to the area, or fail to develop. Reviewing the follow-through helps prevent a single event from being treated as a complete explanation.
Confusing a lower-timeframe shift with a broad reversal
Markets can show different structures on different timeframes. A short-term change may be relevant to a short-term review while still occurring inside a broader trend. Naming the timeframe makes the observation more precise.
Marking too many levels
When every swing is labeled as equally important, the chart can become harder to read. A better approach is to prioritize levels that relate to the current structure and the question being investigated.
Using labels without asking what they mean
Terms connected with smart money concepts or institutional activity can be useful shorthand, but they should not replace reasoning. The trader should still ask how the area relates to price structure, momentum, timeframe, and subsequent behavior.
Expecting an indicator to make the decision
A market structure indicator can organize evidence, but it does not eliminate market risk or guarantee profitable results. It should be part of a broader process that includes risk awareness, testing, and personal judgment.
Questions to ask before acting on a chart observation
Before treating a structure reading as actionable, a trader can review a short checklist:
- What timeframe does this observation belong to?
- Is the market directional, ranging, or in transition?
- Which swing or level makes the observation relevant?
- Does momentum support the structural interpretation or conflict with it?
- What would show continuation, and what would challenge the current view?
- Am I treating an indicator reading as evidence to review, or as a guaranteed prediction?
These questions encourage a conditional view of the chart. Instead of asking only what price will do, the trader can define what information would support or weaken the current interpretation.
Why a structured chart process can be valuable
The main benefit of a market structure indicator is not that it tells every trader the same thing. Its value is in helping organize observations that can otherwise compete for attention. Structure provides context; trend and momentum add supporting perspectives; and smart money concepts or institutional activity analysis can direct further investigation.
For traders who use TradingView, an indicator such as AKMelytics – Market Intelligence Indicator may provide a central workspace for these related chart questions. The most responsible use is to treat its displays as inputs to analysis, test how they fit a chosen process, and remain aware that no tool can predict every market movement.
FAQ
What is a market structure indicator?
A market structure indicator is a charting tool that helps display or organize price swings, highs, lows, structural breaks, and possible transitions. It can make the sequence of price behavior easier to review.
Can a market structure indicator predict market direction?
It can help identify and organize evidence about current chart conditions, but it cannot guarantee a future direction. Market behavior remains uncertain, and indicator readings require context and judgment.
How is market structure different from momentum?
Market structure focuses on the arrangement of price swings and breaks. Momentum focuses on the strength or speed of movement. They can support each other, but one should not automatically be treated as proof of the other.
How do smart money concepts fit into market structure analysis?
Smart money concepts can add ideas about liquidity, institutional activity, and areas of interest. Reviewing these ideas alongside structure can provide context, rather than relying on isolated labels or zones.
Can a market structure indicator be used on TradingView?
Yes. AKMelytics – Market Intelligence Indicator is designed for TradingView and includes features related to market structure, trend, momentum, institutional flow, multi-timeframe analysis, and smart money analysis.
Does using an indicator remove trading risk?
No. An indicator does not eliminate losses or guarantee profitable results. It is a tool for educational and trading-decision assistance, so traders should apply their own analysis and risk awareness.


Recent Comments