
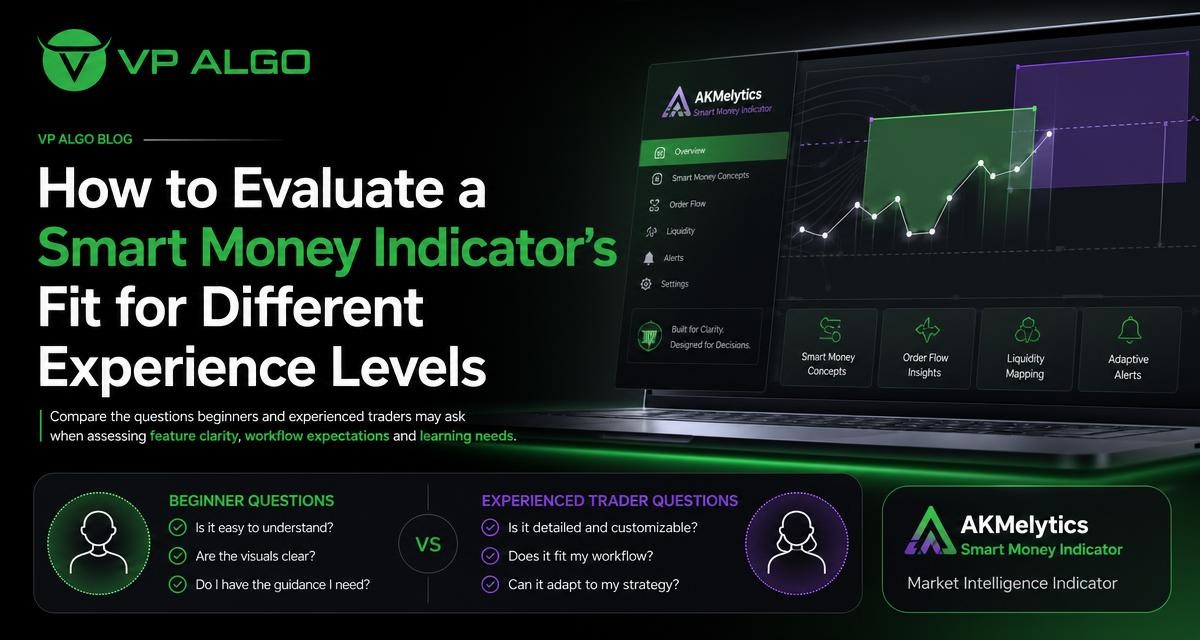
Choosing a smart money indicator is not only a question of how many features appear on a chart. The more useful question is whether the indicator’s information, terminology and workflow match the trader’s current experience. Beginners may need clear explanations and a manageable starting process, while experienced traders may focus on how the tool fits an established method. This guide explains how both groups can assess the AKMelytics Smart Money Indicator and similar TradingView tools without treating an indicator as a substitute for analysis or risk management.
What a smart money indicator is designed to help you examine
A smart money indicator is generally used to organize information related to market structure, trend, momentum, institutional activity and smart money concepts. These areas can help traders frame what may be happening in a market, but they do not remove the need to interpret price action, define a trading plan or consider risk.
The AKMelytics – Market Intelligence Indicator is presented as a TradingView indicator with features related to trend analysis, momentum signals, market structure, institutional flow monitoring, multi-timeframe trend assessment and smart money analysis. When evaluating a tool with this range of functions, it is useful to separate the underlying information from the decisions a trader may eventually make. The indicator can assist with market observation; it does not provide official financial advice or guarantee a particular result.
The main fit questions for every experience level
Before comparing beginner and experienced-user needs, every trader should ask a few basic questions. These questions help prevent a feature list from becoming the sole reason for choosing a tool.
- Can I explain what each major feature is intended to show? A label such as momentum, structure or institutional flow should have a practical meaning within the trader’s process.
- Does the indicator fit my existing chart workflow? A useful tool should support the way a trader reviews timeframes, marks levels and records observations.
- Will the information simplify analysis or create more noise? More signals and chart elements are not automatically more useful.
- Can I test my understanding before relying on the tool? A trader should have time to study the display and compare it with independent analysis.
- What support or setup help is available? Installation, activation and usage questions may matter, especially for someone using a TradingView indicator for the first time.
These questions are relevant whether someone is exploring a smart money trading indicator for the first time or adding another tool to a developed technical-analysis routine.
How beginners can evaluate a smart money indicator
Start with terminology and feature clarity
Beginners often face a vocabulary problem before they face a chart problem. Terms such as market structure, momentum, institutional flow and multi-timeframe analysis can refer to different parts of the same market picture. A suitable indicator should therefore be assessed according to how clearly its features can be understood and used.
Rather than trying to use every function at once, a new trader can begin by identifying the purpose of each feature. For example, trend analysis may be used to frame directional conditions, while momentum information may help describe the strength or weakness of a move. Market structure can provide another way to study changes in price organization. The goal at this stage is not to find a single signal that answers every question. It is to learn what information the chart is presenting.
Use a small learning sequence
A beginner may benefit from introducing the tool in stages. One possible sequence is to study the general trend first, then review market structure, and only later examine momentum or institutional-flow information. This approach can make it easier to identify which part of the indicator is influencing an observation.
Keeping a simple journal can also help. For each chart review, record the timeframe, the indicator feature being examined, what the price was doing, and what remained uncertain. This creates a record of understanding rather than a collection of assumed signals. It also gives the trader a way to notice whether the indicator is helping with structure or simply adding visual complexity.
Ask whether the workflow is realistic
A tool may appear attractive in a demonstration but still be difficult to use consistently. Beginners should consider how much time they have for chart preparation, how many timeframes they normally review and whether they can explain their process in plain language. A smart money indicator is more likely to fit when its information can be incorporated into a repeatable routine.
For example, a beginner might use the indicator to organize a pre-analysis checklist: review the broader trend, inspect the market structure, consider momentum, and then decide whether the chart provides enough context for further study. This is a workflow expectation, not a promise of a trade outcome.
How experienced traders can evaluate the same tool
Compare the indicator with an established method
Experienced traders usually have an existing process for reviewing charts. They may already use price action, technical analysis, multiple timeframes or other indicators. Their main question is often not whether a smart money indicator has many features, but whether those features add useful information without duplicating or conflicting with the current method.
An experienced user can map each AKMelytics feature to a specific stage of analysis. Trend analysis may be relevant to directional context. Momentum signals may be reviewed as a secondary observation. Market structure may be compared with the trader’s own interpretation of swings and breaks. Institutional flow monitoring and smart money analysis may be treated as additional context rather than automatic confirmation.
Evaluate information quality and chart discipline
Experienced traders should pay attention to how the indicator affects decision-making discipline. Does it encourage a clear sequence of analysis, or does it tempt the user to react to every change on the chart? Does it support multi-timeframe review in a way that complements the trader’s plan? Does it help organize an existing process, or does it encourage constant changes to that process?
These questions are particularly useful when assessing a market structure indicator or momentum indicator for TradingView. The value of a feature depends on how it is interpreted in context. A trader who already has defined criteria can assess whether the indicator contributes a distinct perspective, improves observation, or merely repeats information already available elsewhere.
Check integration rather than replacement
A smart money indicator may be a better fit as an analytical layer than as a complete trading system. Experienced traders can evaluate it by asking where it belongs in their workflow: market scanning, higher-timeframe context, setup review, trade journaling or post-analysis. This makes the assessment more precise than simply asking whether the indicator is “accurate.”
The same principle applies to algorithmic trading tools generally. A tool can help structure information while leaving the trader responsible for interpretation, planning and risk decisions. No indicator should be treated as a guarantee of profitable results or as a replacement for independent judgment.
Beginner and experienced-user priorities at a glance
| Evaluation area | Beginner questions | Experienced-trader questions |
|---|---|---|
| Feature clarity | Can I understand what trend, momentum and structure features show? | Do the features provide distinct information or duplicate my current tools? |
| Workflow | Can I follow a simple, repeatable chart-review sequence? | Where does the indicator fit within my established process? |
| Multi-timeframe use | Which timeframe should I study first, and how should I record observations? | Does the multi-timeframe view complement my existing market framework? |
| Signal interpretation | Can I avoid treating a visual cue as an automatic trade instruction? | Can I define the role of each signal within predetermined criteria? |
| Learning needs | Do I need help with terminology, setup or basic chart use? | Do I need technical clarification, configuration help or workflow support? |
| Evaluation standard | Does the tool make analysis clearer and more structured? | Does the tool add relevant context without increasing unnecessary noise? |
How to assess feature clarity before making a decision
Look for a clear relationship between feature and purpose
Each major feature should answer a recognizable analytical question. Trend analysis may help frame direction. Momentum evaluation may help describe movement strength. Market structure may help the trader study how price is organized. Institutional-flow monitoring and smart money concepts may provide another layer of market context. The precise interpretation still depends on the trader’s method and the conditions being studied.
If a feature cannot be explained without relying on vague language, it may be too early to make it central to a trading routine. Beginners can use this as a learning checkpoint. Experienced traders can use it as a test of whether a feature has a defined role in their framework.
Separate display convenience from analytical value
A TradingView indicator can make several observations visible in one environment, which may be convenient. Convenience, however, is not the same as evidence of a successful trade. When reviewing a tool, note whether it improves the organization of information, helps with consistency or simply makes the chart more crowded.
A useful evaluation should include periods when the market appears unclear. If the trader only studies obvious moves, it may be difficult to understand how the indicator behaves when trend, momentum and structure do not point in the same direction. Studying ambiguity can reveal whether the tool supports careful analysis or encourages premature conclusions.
Workflow expectations for using a TradingView indicator
Technical fit also includes the practical steps involved in accessing and using the product. VP ALGO TRADING offers the AKMelytics – Market Intelligence Indicator for TradingView and provides a request-based seven-day free trial for its indicator and Telegram channel. Prospective users should confirm the current process and eligibility details directly with the company rather than assuming that every account or setup will have identical conditions.
After purchase, customers are instructed to provide their TradingView ID by email for product access. The company also states that support is available for installation, activation or usage assistance. These details matter when assessing workflow expectations, especially for a trader who is unfamiliar with adding a purchased TradingView indicator. They do not change the need to learn the tool and evaluate it independently.
A practical evaluation process for both groups
- Define the problem you want the indicator to address. Decide whether you are looking for help with trend context, market structure, momentum, institutional activity or organization across timeframes.
- List your current tools and habits. Note the timeframes you review, the indicators you already use and the steps you normally follow before recording an observation.
- Study one feature at a time. Avoid forming conclusions about every component during the first chart session.
- Build a written workflow. Describe what you will review first, what you will review next and what would make you stop for further analysis.
- Review different market conditions. Include directional movement, consolidation and situations where the chart is difficult to interpret.
- Record confusion as well as clarity. A list of unanswered questions is useful for deciding what requires more education or support.
- Assess fit before increasing reliance. The purpose of the evaluation is to understand the tool’s role, not to assume that more exposure guarantees better trading decisions.
Common mistakes when choosing a smart money trading indicator
Choosing based only on the number of features
A long feature list can sound impressive, but it does not reveal whether the information is understandable or useful for a particular trader. A beginner may become overwhelmed, while an experienced trader may find that several features repeat existing analysis. Fit is more important than volume.
Expecting an indicator to make the decision
An indicator can organize market information, but it should not be treated as a financial adviser or as a source of guaranteed trade outcomes. Traders remain responsible for understanding the tool, setting their own process and considering the risks associated with their decisions.
Ignoring the learning curve
Every new analytical tool requires time for terminology, chart interpretation and workflow development. If a trader does not allow time for learning, normal uncertainty may be mistaken for product failure. Conversely, persistent confusion may indicate that the tool is not a suitable fit at the current experience level.
Changing the whole strategy immediately
Experienced traders can make a clearer assessment by introducing an indicator gradually instead of replacing an established method at once. Beginners can do the same by learning the tool alongside basic technical-analysis concepts. A controlled evaluation makes it easier to identify what the indicator actually contributes.
When the AKMelytics Smart Money Indicator may be worth investigating
The AKMelytics Smart Money Indicator may be relevant to traders who want a structured way to review trend analysis, momentum, market structure, institutional activity, multi-timeframe conditions and smart money concepts within TradingView. Its fit will depend on the user’s familiarity with those ideas and on whether the feature set supports a clear personal workflow.
Beginners may focus on whether the terminology can be learned in manageable stages and whether the chart remains understandable. More experienced traders may focus on whether the indicator adds useful context to an existing process. In both cases, the most responsible assessment is practical: understand the feature, observe how it fits the workflow, document what it contributes and avoid treating it as a promise of performance.
Frequently asked questions
What is a smart money indicator used for?
A smart money indicator can help organize observations related to market structure, trend, momentum, institutional activity and smart money concepts. It supports analysis but does not guarantee a trade result or replace independent judgment.
Is the AKMelytics Smart Money Indicator suitable for beginners?
It may be suitable for beginners who are prepared to learn its terminology and introduce its features gradually. New users should first focus on understanding the chart information rather than trying to use every feature at once.
How should experienced traders assess the indicator?
Experienced traders can compare each feature with their existing method and determine whether it adds distinct context. They should also assess whether it improves workflow or creates unnecessary chart noise.
Does a smart money indicator provide financial advice?
No. The indicator is intended for educational and trading-decision assistance purposes. It should not be treated as official financial advice, a guarantee or a substitute for personal analysis.
Can a smart money indicator replace a trading strategy?
An indicator is better evaluated as one part of a broader analytical process. It can help organize information, but it does not remove the need for a defined workflow, independent interpretation and risk considerations.
What practical access steps should a user expect?
VP ALGO TRADING states that customers provide their TradingView ID by email after purchase for product access. Support is available for installation, activation or usage assistance, and prospective users should confirm current details directly with the company.
What is the best way to decide whether the tool fits?
Study its features one at a time, test them within a written workflow, review different market conditions and record what improves or complicates your analysis. This process is more useful than relying on feature count or assumptions about future results.


Recent Comments