
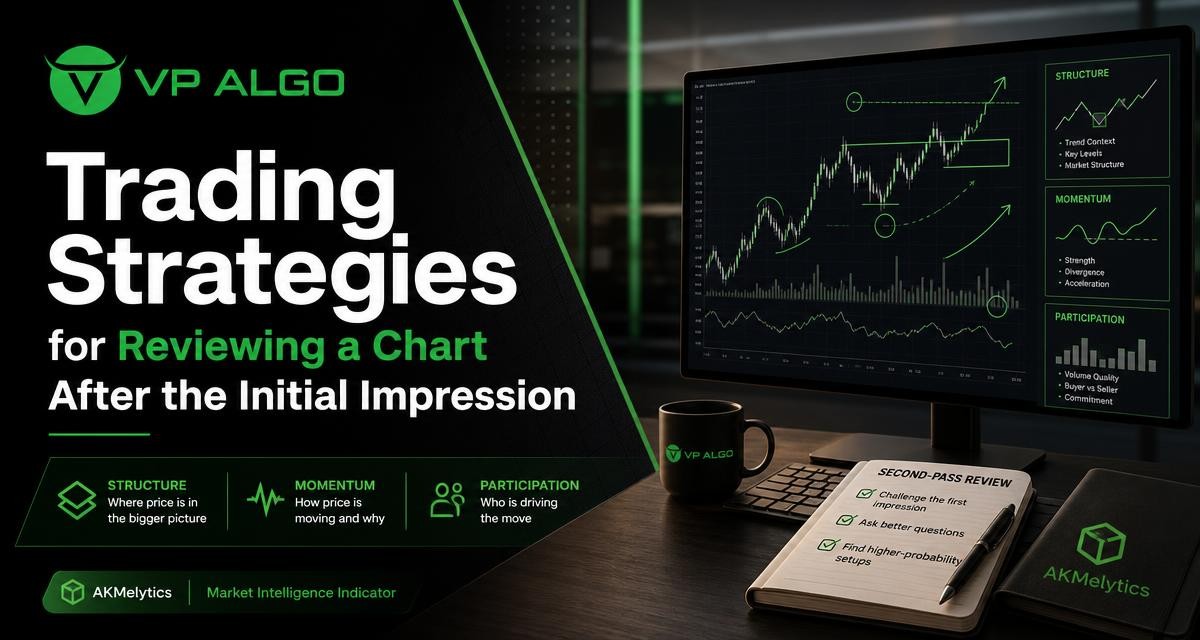
Many trading strategies begin with a fast visual impression: price appears to be trending, a level seems to be holding, or a familiar candlestick pattern catches attention. That first observation can be useful, but it should not become a decision by itself. A second-pass chart review creates space to test the initial idea against trend, momentum, market structure and participation before treating a potential setup as worthy of further attention.
Why a second chart review matters
The first look at a chart is often shaped by the most visible feature. A sharp candle may make the market appear strongly bullish or bearish. A recent breakout may dominate the analysis even though the broader trend is unclear. A trader may also notice a familiar pattern and unconsciously search for evidence that confirms it.
A second review does not mean endlessly analysing every chart. It means asking a consistent set of questions after the initial impression. The purpose is to separate what the chart appears to be saying from what the wider evidence actually supports. This can reduce impulsive interpretation and make the analysis easier to repeat.
| Review stage | Main question | What to examine |
|---|---|---|
| Initial impression | What stands out immediately? | Recent price movement, visible levels and obvious patterns |
| Structure review | Where is price within the wider market structure? | Swing points, direction, support and resistance areas |
| Momentum review | Does movement have strength or show hesitation? | Continuation, weakening movement and momentum signals |
| Participation review | Is there evidence that the move is being supported? | Institutional activity or smart money conditions shown by available tools |
| Decision review | What would invalidate the idea? | Conflicting evidence, risk points and missing confirmation |
Step one: record the first impression without acting on it
Start by describing the chart in one or two neutral sentences. For example, the market may appear to be moving upward after reclaiming a prior level, or price may look weak after breaking below a recent range. The aim is not to predict the next move. It is to document the original observation before a more detailed review changes it.
This simple pause can expose assumptions. A trader who writes “strong bullish trend” may later notice that the move is occurring inside a larger sideways structure. Someone who sees a bearish reversal may discover that momentum has not yet weakened across the relevant timeframe. Writing the first impression makes it easier to compare intuition with evidence.
Separate observation from interpretation
- Observation: price has made a higher high over the recent swing.
- Interpretation: buyers may currently have control.
- Assumption: the upward movement will continue.
The first two statements can be evaluated on the chart. The third requires more information. Good trading strategies distinguish visible facts from expectations about what may happen next.
Step two: review market structure before individual signals
Market structure provides context for almost every other chart observation. Look at the sequence of significant highs and lows rather than focusing only on the latest candle. A series of higher highs and higher lows can suggest an upward structure, while lower highs and lower lows can suggest downward pressure. Alternating swings or overlapping movement may indicate that the market is less directional.
Structure should also be considered across more than one timeframe when that information is available. A short-term upward move may be a reaction within a broader decline. Conversely, a brief pullback may not invalidate a wider upward structure. Multi-timeframe trend assessment helps prevent a narrow chart view from dominating the complete analysis.
Questions for a structure review
- What are the most meaningful recent swing highs and swing lows?
- Is price making progress in one direction or moving within a range?
- Has a structural level been broken, reclaimed or repeatedly rejected?
- Is the current movement aligned with the broader timeframe or moving against it?
- Where could the initial interpretation be invalidated?
A market structure indicator can help organise these observations, but it should support chart reading rather than replace it. Indicators may simplify complex information, yet the trader still needs to understand which swing points and levels matter to the analysis.
Step three: test the first idea with momentum
Direction and momentum are related, but they are not identical. Price can continue moving upward while the force behind the move weakens. It can also fall sharply as part of a temporary reaction before the broader trend resumes. A second-pass review should therefore ask whether momentum confirms the initial impression, merely supports it temporarily, or conflicts with it.
Consider the quality of recent movement. Are candles progressing cleanly, or are they becoming smaller and more overlapping? Is price extending beyond previous levels, or repeatedly failing near the same area? Does a momentum signal agree with the direction visible in the chart? These questions can reveal whether a move is developing, mature, stalled or uncertain.
Momentum is context, not a standalone command
A momentum indicator for TradingView may highlight acceleration, weakening movement or changes in pressure. However, a signal should be interpreted in relation to structure and location. Strong momentum into a major area may describe an active move without proving that entering immediately is appropriate. Weak momentum during a controlled pullback may not mean that the broader trend has ended.
Useful trading strategies treat momentum as one part of a sequence. First identify the structure, then consider how momentum behaves within that structure. This approach is more informative than using an isolated colour change, arrow or line crossing as the entire basis for a decision.
Step four: examine participation and smart money conditions
After reviewing direction and momentum, consider whether the movement appears to have meaningful participation behind it. Participation is not something a chart can prove with certainty, but tools that assess institutional activity or smart money conditions may add another layer to the review.
For example, a trader may ask whether the latest movement is consistent with the broader flow shown by the chosen indicator. Does the tool suggest that activity supports the direction, or does it show a conflict? Is the move occurring near a meaningful structural area? These questions are more useful than treating a smart money reading as a guaranteed forecast.
The AKMelytics – Market Intelligence Indicator is designed to help traders examine areas such as trend analysis, momentum evaluation, market structure, institutional flow monitoring, multi-timeframe trend assessment and smart money analysis. Used as part of a second review, a TradingView indicator with these capabilities can help organise several questions on one chart. It remains an aid for analysis and decision support, not a substitute for independent judgment or risk management.

Step five: look for disagreement instead of confirmation
Many traders naturally search for evidence that supports the first idea. A stronger review deliberately searches for disagreement. If the initial impression is bullish, look for reasons it may be premature: a higher-timeframe resistance area, weakening momentum, a failed breakout or a structure that is still sideways. If the first impression is bearish, check whether price is approaching support, reclaiming a key level or showing improving momentum.
This is not an argument for taking the opposite position whenever one conflicting signal appears. It is a way to measure uncertainty. One disagreement may simply be normal market noise. Several independent conflicts may indicate that the original interpretation needs to be reduced in confidence or set aside.
A useful second review does not ask, “How can I prove this trade idea?” It asks, “What evidence would make this idea less convincing?”
A practical conflict checklist
- Does the short-term direction disagree with the wider timeframe?
- Does momentum fail to support the apparent trend?
- Is price entering an area where previous movement was rejected?
- Does the participation or smart money view conflict with the price structure?
- Would the setup depend on one isolated candlestick pattern?
Step six: distinguish a setup from a decision
A chart can contain the ingredients of a possible setup without providing a complete decision. A trend, a structural level and supportive momentum may create a scenario worth monitoring. They do not guarantee that the next movement will follow the expected direction.
Before moving from analysis to action, define what would support the idea, what would weaken it and what information is still missing. This keeps the review process clear. It also helps prevent a trader from changing the interpretation after price moves away from the original area.
| Element | Example question | Why it matters |
|---|---|---|
| Context | What is the wider trend or range? | Prevents a short-term view from being treated as the whole market picture |
| Trigger | What event would make the setup worth monitoring? | Creates a defined condition instead of a vague expectation |
| Confirmation | Do structure, momentum and participation agree? | Shows whether several parts of the review point in the same direction |
| Invalidation | What would weaken or cancel the idea? | Limits emotional reinterpretation after the chart changes |
| Risk awareness | Is the uncertainty acceptable for the trader’s plan? | Keeps analysis separate from assumptions about outcomes |
How to use a trading indicator without outsourcing judgment
A trading indicator can make a review more structured by bringing trend, momentum, market structure or participation information into view. It may be particularly useful for comparing observations across timeframes and for highlighting conditions that deserve closer inspection.
Still, more signals do not automatically create better analysis. Multiple tools may describe the same underlying price movement, and several agreeing readings may not remove uncertainty. Use an indicator to ask better questions, not to avoid asking questions. Check how the displayed information relates to the actual candles, levels and timeframe being studied.
A simple indicator review routine
- Read the price chart first and write the initial impression.
- Review the wider structure and mark important swing areas.
- Check whether momentum supports or challenges the direction.
- Examine any available institutional flow or smart money information.
- Compare the indicator readings with the price action rather than viewing them separately.
- Record the conditions that would invalidate the analysis.
This routine can be adapted to different trading styles without turning the indicator into a buy-and-sell authority. VP ALGO TRADING positions its tools for educational and trading-decision assistance purposes rather than as financial advice. Traders remain responsible for evaluating whether a method fits their own process and risk considerations.
Common mistakes during a second-pass review
Changing the timeframe until the chart agrees
Moving between timeframes can provide useful context, but repeatedly searching for a view that confirms the first idea creates bias. Choose the timeframes relevant to the analysis before reviewing the chart and apply the same process consistently.
Counting signals instead of weighing context
Three weak signals do not necessarily outweigh one important structural conflict. Consider the quality, location and timeframe of each observation. A signal near a significant level may deserve more attention than the same signal in the middle of an unclear range.
Treating a pattern as a prediction
Candlestick patterns and chart formations describe what has happened in a particular context. They do not remove uncertainty about the next movement. Confirm the pattern’s location, structure and momentum before giving it analytical weight.
Ignoring the possibility of no trade
A second review may conclude that the chart is mixed or incomplete. That is a useful result. The purpose of trading strategies is not to force an interpretation from every chart. Sometimes the clearest decision is to continue monitoring until the evidence becomes easier to assess.
Turn the process into a repeatable journal entry
Writing down the second review can improve consistency. A short entry might include the initial impression, the wider structure, the momentum assessment, the participation view, the main conflict and the condition that would invalidate the idea. Over time, this record can show whether errors usually come from rushing the first impression, overlooking higher-timeframe context or relying too heavily on one indicator.
The journal does not need to predict outcomes or prove that a method works in every situation. Its main purpose is to make the reasoning visible. That makes it easier to review decisions honestly and refine the process without relying on memory alone.
Final checklist for reviewing a chart twice
- Have I recorded the initial impression in neutral language?
- What does the wider market structure show?
- Is the current movement directional, corrective or range-bound?
- Does momentum confirm the apparent direction?
- What does the available participation or smart money analysis suggest?
- What evidence conflicts with the original idea?
- What would invalidate the setup?
- Am I analysing a possible scenario rather than assuming an outcome?
The most useful trading strategies are often processes rather than single signals. A disciplined second look can turn a fast chart reaction into a more balanced assessment of structure, momentum and participation. Tools such as the AKMelytics – Market Intelligence Indicator may help organise that review on TradingView, while the final interpretation remains the trader’s responsibility.
Frequently asked questions
What is a second-pass chart review?
It is a structured review performed after the first visual impression. It checks the initial idea against market structure, momentum, participation, timeframe context and possible invalidation conditions.
Why should traders question their first chart impression?
A first impression can be dominated by a recent candle, breakout or familiar pattern. Questioning it helps reveal conflicting evidence and reduces the risk of treating an immediate reaction as a complete analysis.
How does market structure support trading strategies?
Market structure places current price movement within the sequence of highs, lows, ranges and important levels. This context helps traders distinguish a broader trend from a short-term reaction.
Can a momentum indicator confirm a trade?
A momentum indicator can show whether movement appears to strengthen or weaken, but it cannot guarantee a future outcome. It should be interpreted alongside structure, price location and the wider chart context.
What does a smart money indicator add to chart analysis?
A smart money indicator may help traders review institutional activity or related participation conditions. These readings can add context, but they should not be treated as certain forecasts or automatic trade instructions.
Is it useful to skip a chart when the evidence conflicts?
Yes. Mixed evidence is a valid analytical conclusion. Waiting for clearer conditions can be more consistent than forcing a decision when structure, momentum and participation do not align.


Recent Comments