
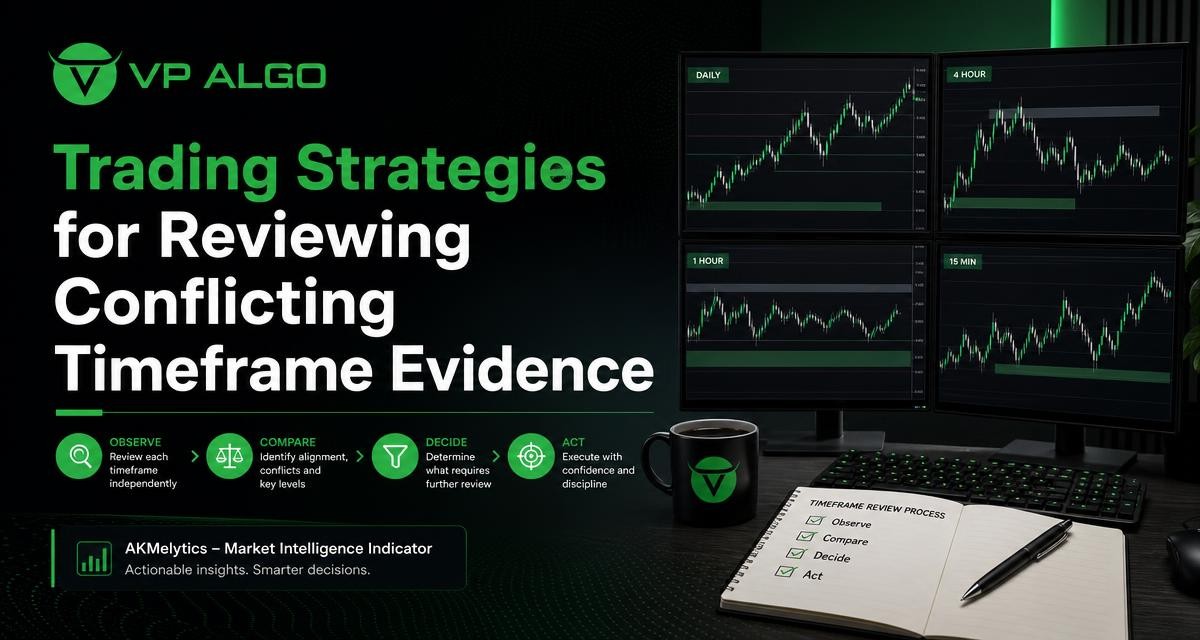
Trading strategies often become difficult to apply when different timeframes appear to tell different stories. A higher timeframe may show a developing uptrend while a lower timeframe displays a sharp decline, weak momentum or a break in market structure. Rather than treating this conflict as a simple buy-or-sell signal, traders can use it as a prompt for further review. A structured process helps separate broad market context from short-term movement and makes stock technical analysis more deliberate.
Why timeframe evidence can conflict
Each timeframe presents a different view of market activity. A longer timeframe compresses many price movements into a broader picture, while a shorter timeframe reveals more detail and more frequent changes in direction. These views can be different without either one being incorrect.
For example, a market can remain within a broader rising structure while experiencing a short-term pullback. On a lower timeframe, that pullback may look like a series of lower highs and lower lows. On a higher timeframe, the same movement may still be part of a normal retracement rather than a confirmed reversal. The apparent conflict often reflects different stages of the same price movement.
Timeframe disagreement can also result from using indicators that measure different features of the market. Trend analysis may remain positive while momentum weakens. Market structure may be intact even as institutional activity or smart money observations appear less supportive. These differences should be examined together rather than forced into one simplified conclusion.
Start with a clear timeframe hierarchy
Before comparing signals, decide what role each timeframe plays in the review. A practical hierarchy usually includes a broader timeframe for context, an intermediate timeframe for setup evaluation and a lower timeframe for timing or confirmation. The exact chart intervals will depend on the trader’s method, but the responsibilities should remain clear.
| Timeframe role | Main question | Evidence to review |
|---|---|---|
| Higher timeframe | What is the broader market condition? | Trend direction, major structure, important areas and sustained momentum |
| Middle timeframe | Is there a developing setup? | Structure changes, pullbacks, momentum behaviour and alignment with the broader context |
| Lower timeframe | Is there a clear point for closer observation? | Short-term price action, local structure, momentum shifts and possible invalidation signals |
This hierarchy prevents a lower-timeframe move from automatically overriding the larger context. It also prevents traders from using a broad trend as a reason to ignore meaningful short-term deterioration. Each chart has a job, and evidence should be judged according to that job.
Separate context from timing
One of the most useful trading strategies for conflicting evidence is to separate the question of direction from the question of timing. The higher timeframe may help describe the prevailing environment, but it does not necessarily identify the moment when a trader should act. Similarly, a lower timeframe may show a potential change in short-term conditions without proving that the broader trend has reversed.
Use the higher timeframe for context
Begin by recording the broad condition without making an immediate trade decision. Is the market showing a rising structure, a falling structure or a less defined range? Are recent movements consistent with that condition, or is the structure becoming less clear?
This stage is about establishing a working hypothesis. It should not be treated as a prediction or a guarantee. A broad upward condition, for instance, can still contain periods of weakness, and a broad downward condition can include temporary rallies.
Use the middle timeframe for evaluation
The middle timeframe helps determine whether the current movement is developing in a way that supports or challenges the higher-timeframe view. A pullback that begins to stabilise may deserve further observation. A pullback that continues to break important structural points may require a more cautious interpretation.
Momentum is especially useful here. Price can remain near a prior trend direction while momentum gradually loses strength. That does not automatically confirm a reversal, but it does indicate that the original view should be reviewed rather than repeated without adjustment.
Use the lower timeframe for detail
The lower timeframe can provide detail about local behaviour, but it is also more vulnerable to noise. Small movements may appear significant when viewed in isolation. For that reason, lower-timeframe evidence should usually be assessed in relation to the broader context and the specific question being asked.
If the question is whether a pullback is beginning to stabilise, the lower timeframe may help identify a change in short-term structure. If the question is whether the larger trend has ended, lower-timeframe movement alone is usually insufficient. The evidence should be escalated to the higher and middle timeframes before drawing a broader conclusion.
Review the main evidence categories
A disciplined review becomes easier when observations are grouped into categories. This reduces the risk of allowing one striking candle or one indicator reading to dominate the entire analysis.
Trend direction
Trend analysis considers the general direction of price movement over the selected period. Compare the apparent direction across timeframes, but do not expect perfect agreement. A trend may be established on a higher timeframe while moving sideways or temporarily against that direction on a lower one.
Ask whether the disagreement is a normal difference in scale or a sign that the larger condition is becoming less reliable. The answer depends on the persistence and significance of the movement, not simply on whether two charts use different colours or labels.
Momentum
Momentum evaluation focuses on the strength and persistence of movement. A market can continue rising while momentum weakens, or it can begin recovering before the broader trend changes. These observations are valuable because they identify a possible transition, but they should not be treated as standalone proof of a future move.
When momentum conflicts across timeframes, record which timeframe is weakening and whether the change is brief or persistent. Short-term weakness inside a stable broader structure may call for patience. Weakness that spreads across multiple timeframes deserves a more substantial review of the original market interpretation.
Market structure
Market structure provides a framework for understanding swings, breaks and areas where the current interpretation could be challenged. A lower-timeframe structure break may describe a local pullback. A corresponding break on a broader timeframe may carry more significance for the overall analysis.
Instead of asking whether any structure has broken, ask which structure has broken, how clearly it occurred and what that break means within the timeframe hierarchy. This keeps the review specific and avoids treating every short-term fluctuation as a major reversal.
Institutional activity and smart money observations
Institutional activity monitoring and smart money concepts can add another layer of context to a chart review. These observations may help traders examine where participation appears to be changing or where market behaviour is consistent with a developing area of interest. They do not remove uncertainty, and they should be considered alongside trend, momentum and structure.
When these observations conflict with price direction, avoid assigning automatic priority to one category. Instead, document the disagreement and ask whether the evidence is confirming, weakening or simply failing to support the current view. That distinction creates a more measured review process.

A practical process for conflicting signals
When timeframe evidence does not align, use a repeatable sequence rather than making an immediate decision. The following process can be adapted to different trading strategies and charting routines.
- Define the review question. Decide whether you are assessing broad direction, a developing setup, a pullback or short-term timing. A vague question produces vague conclusions.
- Record the higher-timeframe condition. Describe the trend, structure and momentum in neutral language. Avoid adding a trade conclusion at this stage.
- Examine the middle timeframe. Identify whether the current movement supports the broader condition, challenges it or remains inconclusive.
- Inspect lower-timeframe details. Look for evidence that answers the original question, while recognising that smaller movements can be noisy.
- Classify the conflict. Decide whether it is a normal pullback, a developing transition, a timing disagreement or a genuinely unclear market condition.
- Identify what requires confirmation. Specify the observation that would strengthen or weaken the current interpretation. This may relate to structure, momentum or the persistence of a move.
- Record the conclusion and uncertainty. A valid conclusion can be that the evidence is insufficient. Waiting for clearer information is part of a structured process, not a failure to analyse.
How a TradingView indicator can support the review
A TradingView indicator can help organise observations that might otherwise be scattered across several chart studies. The AKMelytics – Market Intelligence Indicator is designed to bring together areas such as trend analysis, momentum signals, market structure, institutional flow monitoring, multi-timeframe trend assessment and smart money analysis.
Used appropriately, this type of tool can support a checklist-based review. A trader might first examine the broader trend assessment, then inspect momentum and structure on the relevant chart, and finally compare those observations with institutional activity or smart money information. The indicator is an aid to market evaluation, not a replacement for a trader’s own process or risk awareness.
It is also important to understand what an indicator observation does not establish. A signal or condition does not guarantee a profitable result, eliminate losses or provide official financial advice. Traders still need to interpret the chart, define what would invalidate their working view and decide whether the available evidence is sufficient for their own method.
Common mistakes when comparing timeframes
Giving every timeframe equal authority
Different timeframes serve different purposes. Treating a short-term fluctuation as equal to a broad structural change can create unnecessary confusion. Establish the hierarchy before reviewing the evidence.
Searching for perfect alignment
Markets do not need to display identical conditions on every chart. Requiring complete agreement may cause traders to overlook useful context or wait for a signal that is too late to be meaningful. The objective is not perfect alignment; it is a clear understanding of what agrees, what conflicts and what remains unknown.
Letting one signal dominate
A single momentum reading, structure break or smart money observation should not automatically override all other evidence. Review the strength, timeframe and persistence of the observation before giving it greater weight.
Changing the method after seeing the chart
It is easy to adjust the interpretation until it supports a preferred outcome. A written process helps reduce this problem. Define the role of each timeframe and the evidence that would change the working view before reacting to every new candle.
Confusing analysis with certainty
Technical analysis organises available information; it does not remove uncertainty. A careful review can improve consistency while still ending with an inconclusive result. That is a more useful outcome than forcing a confident conclusion from conflicting evidence.
Build a review worksheet
A simple worksheet can make multi-timeframe analysis more consistent. Use one row for each timeframe and record observations under the same categories each time.
| Review area | Higher timeframe | Middle timeframe | Lower timeframe |
|---|---|---|---|
| Trend | Broad direction and clarity | Support, pause or challenge | Local direction |
| Momentum | Strength or deterioration | Developing change | Short-term acceleration or weakness |
| Structure | Major swings and breaks | Setup structure | Local shift or noise |
| Smart money observations | Broad participation context | Relevant areas of interest | Short-term confirmation or conflict |
| Further review | What could change the view? | What needs clarification? | What should not be overinterpreted? |
Keeping the language descriptive is useful. Instead of writing “the market will rise,” record that the higher timeframe shows a rising structure while the lower timeframe shows weakening momentum. This creates a reviewable observation and avoids turning analysis into a prediction.
When conflicting evidence means wait and review
Not every disagreement needs to be resolved immediately. If the higher timeframe is unclear, the middle timeframe is transitioning and the lower timeframe is volatile, the most responsible analytical conclusion may be that the setup requires further review. This does not predict what will happen next. It simply recognises that the current evidence is not sufficiently aligned for the intended method.
Traders can then define what they want to observe next: a clearer structural development, more consistent momentum, continued support for the broader trend or a change in the smart money observations being monitored. The benefit of this approach is that it replaces impulsive interpretation with a set of observable conditions.
Final perspective
The most useful trading strategies for conflicting timeframe evidence do not attempt to eliminate disagreement. They explain it. By assigning a role to each timeframe, separating context from timing and reviewing trend, momentum, market structure and smart money observations together, traders can make their stock technical analysis more orderly.
Indicators such as the AKMelytics – Market Intelligence Indicator may help organise these categories on TradingView, but the quality of the process still depends on careful interpretation. A structured review should clarify what the chart shows, what remains uncertain and what deserves further observation before any trading decision is considered.
Frequently Asked Questions
What should traders do when two timeframes show opposite trends?
First, identify the role of each timeframe. The higher timeframe may show the broader condition while the lower timeframe may be showing a pullback or short-term reversal. Review structure, momentum and persistence before deciding whether the conflict is normal or significant.
Which timeframe should have the most influence?
That depends on the purpose of the analysis. Higher timeframes generally provide broader context, while lower timeframes provide detail for timing. A clear hierarchy is more useful than treating one timeframe as universally superior.
Can conflicting timeframe evidence confirm a trend reversal?
Conflict alone does not confirm a reversal. A reversal interpretation usually requires broader evidence, such as a meaningful structural change and sustained movement across relevant timeframes. Short-term weakness may only represent a pullback.
How does momentum help with multi-timeframe analysis?
Momentum can show whether a movement is strengthening, weakening or changing pace. It helps identify conditions that deserve further review, but a momentum reading should be considered with price structure and broader trend context.
What is the role of a smart money indicator in this process?
A smart money indicator can help organise observations related to institutional activity and smart money concepts. It should complement, rather than replace, review of trend, momentum, market structure and the trader’s own decision process.
Is waiting for clearer evidence a trading strategy?
Waiting can be part of a structured strategy when the available evidence is inconclusive. Defining what needs to become clearer helps make waiting an intentional review step rather than an emotional reaction.
Can the AKMelytics indicator guarantee a profitable outcome?
No. The indicator is intended to assist with market evaluation and trading decisions, not to guarantee profits or eliminate losses. Market conditions remain uncertain, and traders should apply their own analysis and risk awareness.


Recent Comments