
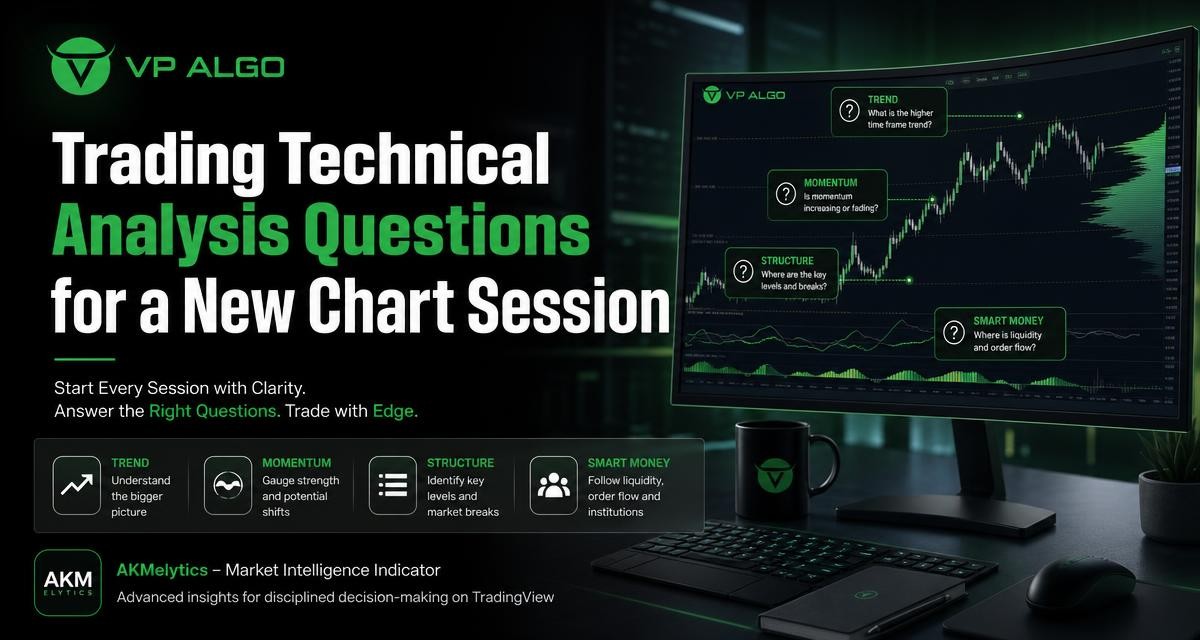
Trading technical analysis becomes more useful when each chart session begins with a consistent set of questions. Instead of searching immediately for a buy or sell signal, review the broader trend, current momentum, market structure and smart money context first. This process can help traders organise information on TradingView and make their chart review more deliberate.
Why start a chart session with questions?
A new chart can present more information than a trader can process at once. Candlesticks, trend lines, indicators, support and resistance levels, and multiple timeframes may all appear relevant. Without a clear process, it is easy to focus on one attractive pattern while ignoring the wider market condition.
Questions create a practical sequence for analysis. They encourage you to identify what the market is doing before considering what it might do next. They also make it easier to separate observation from interpretation. For example, “price has formed a higher high” is an observation, while “the market is likely to continue rising” is an interpretation that still requires context and risk assessment.
The four areas to review before studying a setup
A useful opening review can be divided into four areas: trend, momentum, market structure and smart money context. These categories overlap, but each highlights a different part of the chart. Reviewing them in order can provide a clearer picture than relying on a single indicator or isolated candlestick pattern.
| Review area | Key question | What to examine |
|---|---|---|
| Trend | What direction is the market currently showing? | Directional movement, swing progression and multi-timeframe alignment |
| Momentum | How strong is the current movement? | Acceleration, slowing price action and confirmation or divergence |
| Market structure | Where are important breaks and levels? | Swing highs, swing lows, structure breaks and areas of reaction |
| Smart money context | What activity or liquidity conditions may be relevant? | Institutional-flow context, liquidity areas and smart money concepts |
Trading technical analysis questions about trend
What is the dominant direction on the higher timeframe?
Begin with a higher timeframe before moving to the chart interval you use for detailed study. Ask whether price is generally making higher highs and higher lows, lower highs and lower lows, or moving within a range. This does not require forcing the chart into a bullish or bearish label. A market may be directional on one timeframe and consolidating on another.
Higher-timeframe analysis provides context for lower-timeframe observations. A short-term upward move can occur inside a broader downward structure, while a brief decline can appear during a wider advance. Recording the larger direction first helps prevent a small price movement from becoming the entire analysis.
Is the trend consistent across the timeframes I am reviewing?
Multi-timeframe trend assessment can show whether the chart intervals are broadly aligned or presenting conflicting information. Consider writing down the apparent direction for each timeframe you use. If one timeframe is rising, another is ranging and a third is falling, that disagreement is itself useful information.
Conflicting timeframes do not automatically invalidate a chart. They simply indicate that the market may be transitioning, consolidating or viewed at different stages of the same movement. A trend indicator for TradingView can help organise this review, but the indicator should be considered alongside the actual price structure rather than as a replacement for it.
Where could the current trend be losing strength?
Trend analysis should include signs of deterioration, not only evidence that supports the existing direction. Ask whether new swing points are becoming smaller, whether pullbacks are deepening, or whether price is repeatedly failing near a previous level. A trend can remain intact while its momentum changes, so this question is about awareness rather than prediction.
Questions about momentum
Is price movement accelerating, slowing or remaining balanced?
Momentum describes the force and pace behind a move. A market that is moving steadily may present a different context from one that is making fast, extended candles. Likewise, a trend that continues to make new highs but shows less follow-through may need closer examination.
When reviewing momentum, compare recent movement with earlier movement on the same chart. Look at the size and sequence of price swings, how quickly pullbacks develop, and whether continuation follows a breakout. This approach keeps momentum analysis connected to the chart rather than treating one reading as a complete conclusion.
Does momentum support the apparent trend?
Ask whether the momentum picture agrees with the direction identified in the trend review. If price is rising and upward momentum is also building, the two observations are aligned. If price continues higher while momentum appears weaker, the difference may signal caution or simply reflect a mature move. It is not, by itself, proof that a reversal will occur.
A momentum indicator for TradingView can make this comparison easier to monitor. The useful question is not whether an indicator has produced a particular colour or signal, but whether its reading adds context to the price action you can already see.
Are there signs of a momentum shift?
Momentum can change before the broader market structure changes. Look for failed continuation, a sharp rejection after an extended move, or a change in the character of pullbacks. These observations can help you distinguish between a healthy retracement and a potentially more meaningful change in conditions.
Use this information as part of a process rather than as a standalone entry instruction. A momentum shift deserves further review of structure, key levels and the timeframe involved.
Market structure questions for a new chart
What are the most recent meaningful swing points?
Marking every minor fluctuation can make a chart difficult to read. Instead, identify the swing highs and swing lows that clearly influenced price movement. These points provide a framework for understanding whether the market is advancing, declining or ranging.
The definition of a meaningful swing depends partly on the timeframe and the chart’s volatility. A level that matters on a shorter chart may have little importance on a higher timeframe. The aim is not to find one perfect set of lines, but to build a consistent method for distinguishing major structure from minor noise.
Has market structure been confirmed or merely tested?
A move through a previous high or low deserves careful interpretation. Ask whether price has clearly broken the level, whether the move was brief, and whether there was follow-through afterward. A temporary move beyond a level can have a different meaning from a sustained structural break.
A market structure indicator may help highlight potential breaks and turning points, but visual confirmation remains important. Review the surrounding candles, the timeframe and the strength of the movement. Avoid treating every small breach as a major change in structure.
Where are the important reaction areas?
Note areas where price previously paused, rejected a level or changed direction. These zones can provide context for later movement. They are not guaranteed barriers, and a reaction area should not be treated as an automatic entry or exit instruction.
When several observations point to the same area, it may deserve more attention during the session. For example, a previous swing level that also sits near a visible structure break can be more relevant than an isolated line drawn without broader context.
Smart money and institutional activity questions
What does the smart money context suggest?
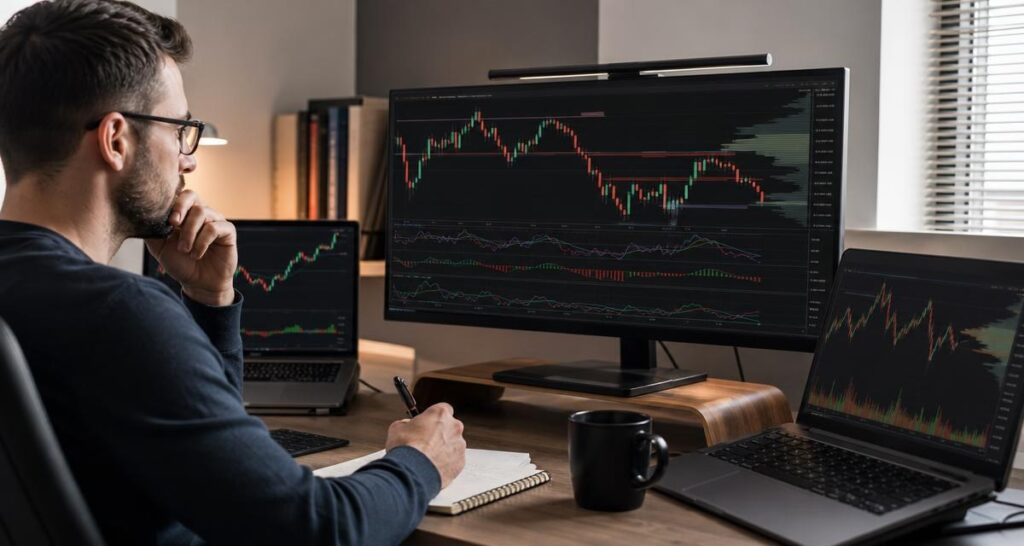
Smart money concepts are often used to study liquidity, institutional activity and the way price behaves around important areas. Begin by asking where liquidity may be concentrated and whether price has recently moved toward or away from such areas. Keep the question descriptive: the purpose is to understand context, not to assume that every movement represents a specific institution’s decision.
Institutional-flow context can add another layer to trading technical analysis when it is considered with trend, momentum and structure. It should not override clear evidence from the chart or create certainty where the market remains unclear.
Has price reacted around a liquidity area?
Review whether price has swept, tested or rejected a level that may attract attention from multiple market participants. Then examine what happened afterward. Did price continue in the same direction, return into the previous range or form a new structural point?
The reaction after a liquidity event can be more informative than the event alone. A quick move beyond a level followed by a strong return may tell a different story from a clean break followed by sustained acceptance. The timeframe and surrounding market conditions still matter.
Do the smart money signals agree with the broader chart?
A smart money indicator can help bring several concepts into one TradingView workspace. However, any signal should be checked against the higher-timeframe trend, momentum and market structure. If the different views disagree, document the disagreement instead of selecting the signal that best matches a preferred trade idea.
This is especially useful for newer traders. A structured review reduces the temptation to use a smart money trading indicator as a shortcut around chart interpretation. Indicators can support analysis, but they do not remove uncertainty from financial markets.
How to combine the answers into a session view
After reviewing each category, summarise the findings in a short session note. The summary should describe the current condition, the areas that require attention and the information that would change your view. It does not need to produce a trade every time. Sometimes the most useful conclusion is that the chart is mixed or lacks sufficient confirmation.
| Session note | Example question | Why it matters |
|---|---|---|
| Directional bias | What is the clearest higher-timeframe direction? | Sets context before detailed chart analysis |
| Condition | Is price trending, ranging or transitioning? | Helps match expectations to the current environment |
| Confirmation | Which evidence supports the current view? | Separates several aligned observations from one signal |
| Conflict | Which timeframes or indicators disagree? | Highlights uncertainty that deserves caution |
| Invalidation | What price development would challenge the view? | Encourages flexibility instead of attachment to a forecast |
A simple written conclusion might state that the higher timeframe is directional, the current chart is pulling back, momentum is moderating, and price is approaching a previous reaction area. That statement is more useful than a label such as “strong buy” because it explains what has actually been observed.
Using a TradingView trading indicator in the process
A TradingView trading indicator can support a repeatable chart workflow by bringing trend, momentum, market structure, institutional-flow context and smart money analysis into the same review. VP ALGO TRADING offers the AKMelytics – Market Intelligence Indicator for this type of market evaluation.
Used appropriately, an indicator can help traders organise information and notice conditions that deserve further study. It should not be treated as a guarantee, an automatic decision-maker or a substitute for understanding the chart. Review the indicator’s signals alongside price action, timeframe context and your own trading rules.
A practical order for using the indicator
- Start with the higher timeframe. Review the broad trend and whether the market appears directional or range-bound.
- Check momentum. Ask whether movement is strengthening, weakening or failing to confirm the trend.
- Study structure. Identify meaningful swing points, breaks and reaction areas.
- Review smart money context. Consider liquidity and institutional-flow-related information without treating it as certainty.
- Compare the views. Record where the indicator and price action agree, and where they do not.
- Write the session conclusion. Note the current condition and what would need to happen before the analysis changes.
Common mistakes when opening a chart
Starting with a trade direction
Choosing a bullish or bearish opinion before reviewing the chart can cause confirmation bias. The trader may then notice only the evidence that supports the original idea. Beginning with neutral questions about trend and structure creates more room for the chart to provide the context.
Using too many indicators
Adding more tools does not always add more understanding. Several indicators may describe the same underlying price movement, creating the appearance of confirmation without providing independent information. Choose tools that serve distinct purposes and learn how their readings relate to price.
Ignoring timeframe disagreement
A lower-timeframe signal may look clear while the higher timeframe is approaching a significant reaction area. This does not make the lower-timeframe observation meaningless, but it does change its context. Always record the timeframe on which each conclusion is based.
Turning a signal into a promise
No trading technical analysis method can remove market uncertainty. A signal, structure break or smart money indication may be useful for study, but it cannot guarantee a particular outcome. Analysis should support disciplined decision-making rather than create confidence that the market must follow one path.
Build a repeatable chart-session checklist
The best checklist is one you can apply consistently without making the process unnecessarily complicated. Keep the questions visible beside your TradingView workspace and answer them in the same order. Over time, your notes can show which observations frequently appear together and which conditions tend to create confusion.
- What is the higher-timeframe trend?
- Is the current market trending, ranging or transitioning?
- Does momentum support the apparent direction?
- Which swing highs and lows define the current structure?
- Has a structural break been confirmed with follow-through?
- Where are the main reaction and liquidity areas?
- What does the smart money context add to the analysis?
- Which observations agree, and which conflict?
- What development would change the current view?
This checklist is an educational framework, not financial advice or a recommendation to enter a trade. Traders should consider their own objectives, risk tolerance and decision-making rules before acting in the market.
Frequently asked questions
What is the first question to ask during a new chart session?
Start by asking what direction the market is showing on the higher timeframe. This establishes context before you study short-term movements, indicators or potential setups.
How do trend and momentum differ?
Trend describes the direction and progression of price structure, while momentum describes the strength and pace of the movement. A trend can continue while momentum strengthens, weakens or becomes mixed.
Why is market structure important in trading technical analysis?
Market structure helps organise swing highs, swing lows, breaks and reaction areas. It provides a framework for interpreting price movement instead of relying on isolated candles or signals.
What does a smart money indicator for TradingView do?
A smart money indicator for TradingView can help present information related to liquidity, institutional activity and smart money concepts. Its readings should be reviewed with price action and broader market context.
Can a TradingView trading indicator replace chart analysis?
No. A TradingView trading indicator can support a structured review, but it does not eliminate uncertainty or replace the need to examine trend, momentum, structure and timeframe context.
What should I do when indicators disagree?
Record the disagreement and investigate the timeframe, price structure and market condition. Conflicting information may indicate a transition or lack of confirmation rather than a reason to force a trade idea.
Is this checklist financial advice?
No. It is an educational chart-review framework. VP ALGO TRADING positions its indicators as tools for educational and trading-decision assistance, not as official financial advice.


Recent Comments