
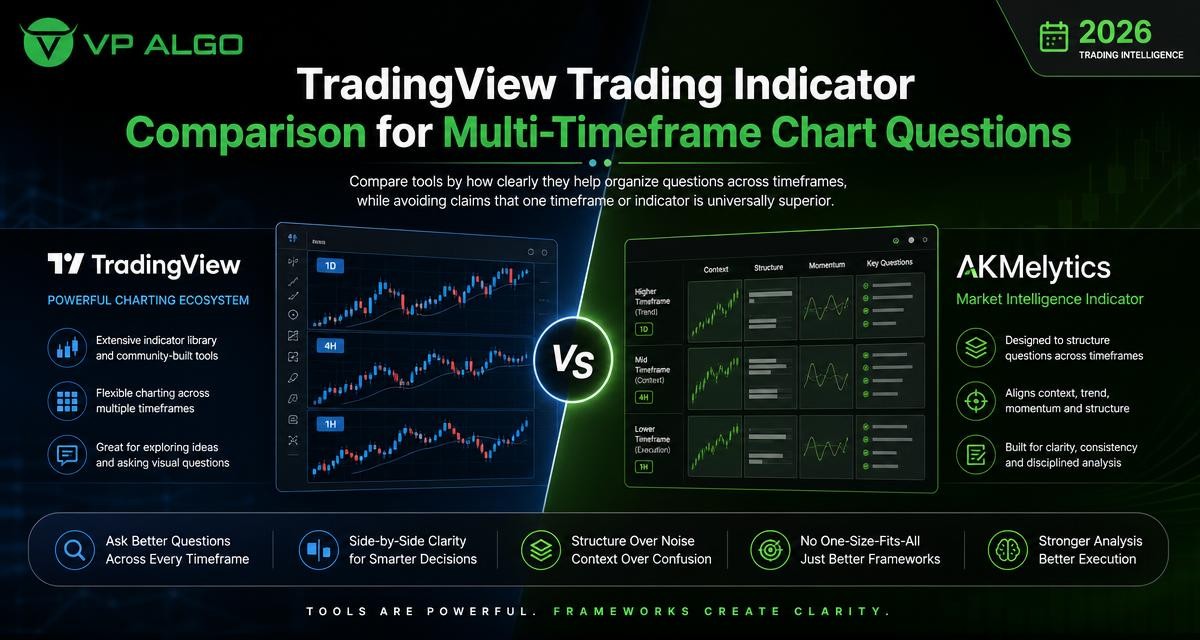
Choosing a TradingView trading indicator is not simply a matter of finding the tool with the most signals. A more useful comparison asks what question each indicator helps you organize, how that question changes across timeframes, and whether the information supports a clear analysis process. This approach can help traders compare trend, momentum, market structure and smart money tools without assuming that one indicator or timeframe is universally superior.
Why multi-timeframe questions matter
A chart can look different depending on the timeframe being reviewed. A broader chart may show a developing trend, while a shorter chart may display a pullback, consolidation or temporary change in momentum. Neither view automatically cancels out the other. They are answering different questions about market behaviour.
For that reason, a multi-timeframe review should not be treated as a search for one perfect signal. It is better understood as a process of separating context from detail. A longer timeframe can help frame the wider market structure, while a shorter timeframe can help examine recent movement. The exact timeframes used will depend on the trader’s method, market and available screen time.
Four questions to ask before comparing indicators
- What market question is the indicator designed to organize?
- Does the tool provide information that is understandable on more than one timeframe?
- Can the output be checked against price structure and current market conditions?
- Does it encourage a repeatable review process rather than automatic reliance on a signal?
Compare indicators by purpose, not by signal count
Different indicator categories are often compared as though they perform the same job. They do not. A trend indicator may help describe directional conditions, while a momentum indicator may help assess the strength or pace of recent movement. A market structure tool focuses on the arrangement of price swings, and a smart money or institutional-flow tool may be used to organize questions about participation and areas of interest.
The best comparison therefore begins with function. More information on a chart is not necessarily more useful information. A tool that helps answer one clearly defined question may be more practical than a crowded combination of indicators that produces overlapping or difficult-to-interpret signals.
| Indicator category | Main question | Useful multi-timeframe role | Point to check |
|---|---|---|---|
| Trend indicator | What is the broader directional condition? | Use a wider view for context and a shorter view to inspect recent movement. | Check whether a short-term change is a reversal, pullback or consolidation. |
| Momentum indicator | How strong or persistent is recent movement? | Compare momentum behaviour with the broader directional context. | Do not treat momentum alone as proof of a future move. |
| Market structure indicator | How are highs, lows and price relationships developing? | Review larger structure before examining smaller swings. | Confirm that the selected timeframe matches the question being asked. |
| Smart money or institutional-flow indicator | What participation or flow-related conditions are being highlighted? | Use as an additional analytical layer alongside price and structure. | Understand what the display represents before acting on it. |
How to compare a TradingView trading indicator across timeframes
1. Start with the broadest useful context
Begin with the timeframe that best reflects the holding period or chart question under review. The purpose is not to predict every short-term movement. It is to establish what the chart is currently showing at a broader level: directional movement, a range, a transition or an unclear condition.
This first step can reduce the temptation to interpret every small fluctuation as a meaningful change. A short-term signal may look compelling in isolation, but its importance can change when viewed within a wider structure. The broader view should provide context, not dictate an automatic decision.
2. Move down one level to inspect structure
After establishing context, move to a more detailed timeframe and ask whether the visible swings support, challenge or simply add detail to the wider view. This is where market structure becomes useful as an analytical language. Traders can examine the relationship between recent highs and lows, the development of ranges and whether price is extending or retracing.
A market structure indicator can help make these questions more visible, but the displayed interpretation still needs to be understood. An indicator should support chart reading rather than replace it. If the structure becomes confusing when the timeframe changes, that is a reason to investigate the tool’s settings and logic, not to assume that the newest signal is correct.
3. Use momentum as supporting evidence
Momentum can add information about the pace and persistence of movement. However, a momentum reading should be considered alongside trend and structure. Strong momentum in a short-term chart may occur during a move that remains part of a broader range. Conversely, a broader trend may continue even when short-term momentum temporarily weakens.
When comparing momentum indicators for TradingView, ask whether the display helps you distinguish continuation, slowing movement and possible transition. Avoid turning a single reading into a guaranteed prediction. The value of momentum analysis is often in improving the quality of the question: is the current move developing with support, losing energy or occurring in an uncertain environment?
4. Review flow and smart money information carefully
Smart money and institutional-flow concepts are commonly used to organize questions about participation, liquidity and areas that may deserve closer attention. These concepts can add another perspective to stock technical analysis, but they should not be treated as a promise that a particular market action will follow.
If a smart money indicator is part of a TradingView workflow, review what each visual element means and how it relates to price structure. Consider whether it is being used as context, confirmation or a prompt for further investigation. The distinction matters because an analytical prompt is not the same as a trade instruction.

What to look for in a multi-timeframe indicator comparison
Clarity of presentation
A useful indicator should make its information easier to organize. The chart should remain readable enough for a trader to identify the current question without being distracted by excessive labels, colours or overlapping signals. Clarity is especially important when the same tool is viewed across several timeframes.
During a comparison, observe whether the indicator’s display remains understandable when the chart changes scale. If the interpretation depends on memorising too many visual conditions, the tool may require a more deliberate learning process before it can support consistent analysis.
Separation between context and trigger
Some indicators are more useful for describing the market environment than for identifying a specific entry or exit. This distinction should be explicit. Trend, structure, momentum and flow information can all contribute to a review, but they do not necessarily perform the same role.
A practical charting process can label each observation as context, confirmation or a decision point. This prevents a broad trend reading from being confused with a short-term trigger. It also makes it easier to review later whether the analysis followed a repeatable method.
Consistency of interpretation
Consistency does not mean that every timeframe must show the same message. Markets can be aligned on one timeframe and mixed on another. Instead, consistency means that the trader knows what each timeframe is intended to answer and applies the same interpretive rules each time.
For example, one trader may use a wider chart to study trend and structure, a middle chart to review momentum, and a shorter chart to investigate recent price behaviour. Another trader may organise the process differently. Neither arrangement is automatically better; the important point is that the roles are defined before the chart is examined.
Where AKMelytics fits into the comparison
AKMelytics – Market Intelligence Indicator is the identified indicator offering for this topic from VP ALGO TRADING. When evaluating it, traders should focus on how the product fits into their own chart-review process rather than asking whether it is universally the best TradingView trading indicator.
A sensible evaluation can begin with the questions below:
- Which parts of the analysis does the indicator help organise?
- Can its information be reviewed across the timeframes relevant to the trader?
- Are trend, momentum, structure or smart money observations clearly separated?
- Does the presentation help the trader explain why a chart is being interpreted in a particular way?
- Is there enough product guidance to understand installation, activation and normal usage?
VP ALGO TRADING develops and sells TradingView indicators and algorithmic trading tools. Its business information also identifies the Delphi Intelligence Smart Money Indicator, with features related to trend analysis, momentum evaluation, market structure, institutional activity, multi-timeframe trend assessment and smart money analysis. Those categories provide a useful framework for comparing an indicator’s intended analytical role, while each trader remains responsible for understanding the product and applying independent judgement.
A practical review workflow for stock technical analysis
The following workflow can be adapted to different trading styles without assuming that one timeframe or indicator is suitable for everyone:
- Define the chart question. Decide whether you are studying direction, structure, momentum, participation or a combination of these.
- Choose the relevant timeframes. Assign each timeframe a role before looking for a signal.
- Record the broader condition. Note whether the market appears directional, ranging, transitional or unclear.
- Inspect the next level of detail. Review recent swings and momentum without ignoring the broader context.
- Check for agreement and conflict. Treat disagreement between timeframes as information to investigate, not as an automatic failure.
- Write down the invalidating condition. Identify what would make the current interpretation less convincing.
- Review the process afterwards. Assess whether the indicator clarified the question or merely added visual noise.
This process keeps the emphasis on analysis. It also helps separate a tool’s usefulness from the outcome of any individual market decision. No indicator can remove uncertainty or guarantee a result, so a comparison should include usability, interpretation and risk awareness rather than signal frequency alone.
Common mistakes when comparing indicators
Assuming more timeframes mean more certainty
Looking at several charts can reveal useful context, but it can also create conflicting interpretations. More screens do not automatically produce a clearer conclusion. The solution is to give each timeframe a defined purpose and accept that some conditions will remain uncertain.
Ranking indicators by the number of alerts
A high number of alerts may reflect sensitivity rather than quality. A tool should be judged by whether its information is relevant to the question being asked and understandable within the trader’s process. Fewer, clearer observations may be more useful than constant notifications.
Using a short-term signal against wider context without explanation
A short-term change may be meaningful, but it should be explained in relation to the wider chart. If a trader chooses to focus on a shorter timeframe, that choice should be deliberate rather than the result of ignoring an inconvenient broader view.
Treating an indicator as financial advice
Trading indicators are analytical tools, not financial advisers or guarantees of future performance. VP ALGO TRADING positions its indicators for educational and trading-decision assistance purposes rather than official financial advice. Traders should evaluate their own circumstances, risk tolerance and decision process independently.
How to choose a useful comparison standard
The most useful comparison standard is the one that reflects the trader’s real charting task. A beginner may prioritise clear terminology and a manageable display. A more experienced participant may focus on how several analytical layers fit together without duplicating information. Both are legitimate requirements.
Before selecting any TradingView trading indicator, write down the questions the chart must answer. Then assess whether the tool helps answer those questions across the chosen timeframes. This creates a more balanced comparison than asking which indicator produces the fastest signal or the highest number of apparent opportunities.
Frequently asked questions
What is a TradingView trading indicator?
A TradingView trading indicator is a chart-based analytical tool used to organise information about market conditions. Depending on its design, it may focus on trend, momentum, market structure, participation or other observations.
Is one timeframe better than all others?
No. A timeframe is useful in relation to the question being asked and the trader’s method. Wider and shorter timeframes can provide different types of context, so they should not be ranked as universally superior.
How should I compare trend and momentum indicators?
Compare their purpose first. A trend indicator generally helps describe direction, while a momentum indicator helps examine the pace or strength of recent movement. Reviewing them together can provide context, but neither should be treated as a guaranteed prediction.
What does a market structure indicator help with?
It can help organise observations about price swings, highs, lows and changing relationships within the chart. The trader should still understand how the indicator defines and displays structure.
Can a smart money indicator guarantee profitable trades?
No. Smart money concepts and related indicators can provide an additional analytical perspective, but they cannot guarantee profits, eliminate losses or predict future market results.
What should I evaluate in AKMelytics?
Evaluate whether AKMelytics fits your chart-review process, communicates its information clearly across relevant timeframes and helps you organise questions about market conditions. Product guidance and your own independent judgement should remain part of the evaluation.
Are TradingView indicators financial advice?
No. Indicators are tools for analysis and decision support. They are not a substitute for personalised financial advice, and their use does not remove market uncertainty or trading risk.


Recent Comments