
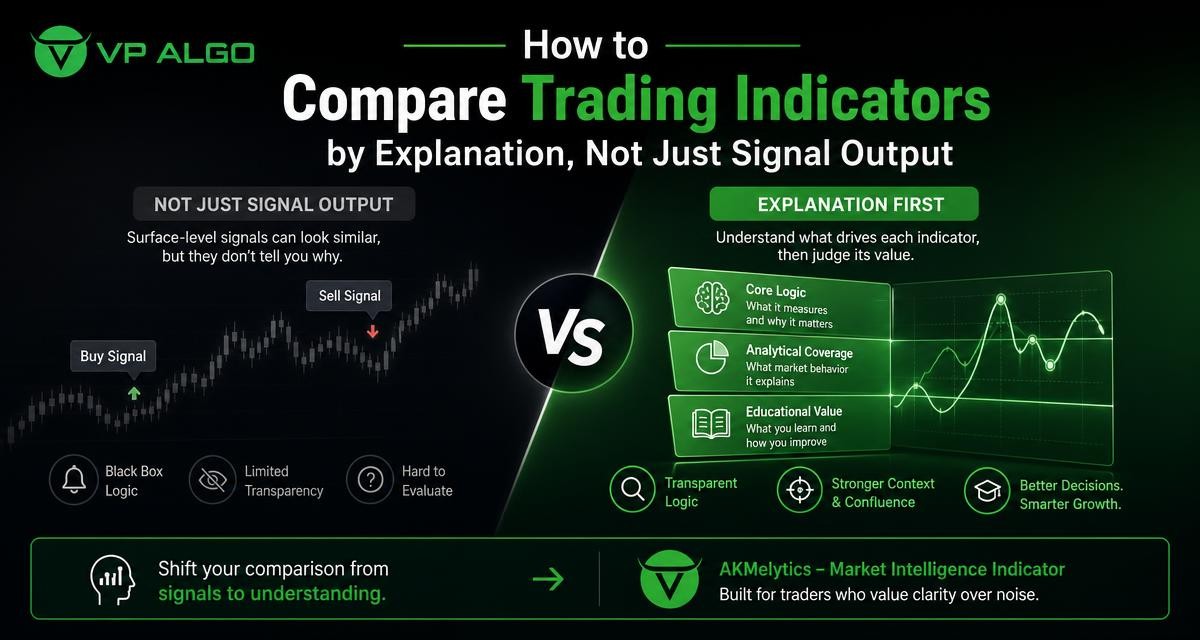
Searching for the best trading indicator often leads traders to compare arrows, alerts and buy-and-sell labels. That approach can be useful at first, but signal output alone does not explain why an indicator produces a reading, what market conditions it is designed to interpret, or how a trader should assess the result. A more useful comparison looks at explanation, analytical coverage, transparency and educational value.
Why signal counts are a weak way to compare indicators
An indicator that produces many signals may appear active and responsive, while one that produces fewer readings may seem less useful. Neither conclusion is reliable without context. The number of signals depends on the calculation method, timeframe, market conditions, sensitivity settings and the type of information the tool is intended to present.
A signal is not the same as an explanation. A label may tell you that a condition has been detected, but it may not show whether the reading comes from trend direction, momentum, market structure, institutional activity or another calculation. Without that context, it becomes difficult to decide whether the signal fits your analysis process.
Signal counting can also encourage traders to judge an indicator by apparent activity rather than by its role. A tool designed to help assess broader trend conditions should not be evaluated in the same way as a tool designed to identify short-term momentum changes. The right question is not simply, “How many signals does it produce?” It is, “What information does it provide, and can I understand how that information supports my analysis?”
What should define the best trading indicator?
There is no single indicator that is automatically best for every trader, timeframe or decision process. A more practical definition is that the best trading indicator for a particular user is one that presents relevant information clearly, fits the trader’s method and encourages disciplined interpretation.
For comparison purposes, assess an indicator across several dimensions rather than relying on a single headline feature.
| Comparison area | What to examine | Why it matters |
|---|---|---|
| Explanation | Whether the tool shows the conditions behind a reading | Helps the trader understand rather than blindly follow a label |
| Analytical coverage | Which market concepts the indicator addresses | Shows whether it supports the trader’s actual workflow |
| Context | Whether readings can be viewed across relevant timeframes | Reduces the risk of interpreting one isolated chart event |
| Transparency | Whether the logic, terminology and limitations are understandable | Makes evaluation and responsible use easier |
| Educational usefulness | Whether the tool helps develop analysis skills | Supports independent decision-making instead of dependence on alerts |
| Practical use | Whether the display is readable and fits the charting routine | A useful concept can still be difficult to apply if the interface is unclear |
Compare the explanation behind each reading
Look for conditions, not just labels
A transparent trading indicator should make it easier to identify the type of condition being assessed. For example, a trader may want to distinguish between a change in trend, a momentum acceleration, a shift in market structure or evidence of stronger participation. These are different observations, even when they appear as similar chart labels.
When reviewing an indicator, ask what a signal is intended to communicate. Does it describe direction, strength, a structural event, a possible area of interest or a combination of inputs? The answer should be understandable from the product explanation and the chart presentation. If the trader cannot explain the reading in plain language, the signal may be difficult to use consistently.
Check whether the tool separates evidence from interpretation
Good analysis distinguishes between what the chart is showing and what the trader decides to do about it. An indicator may identify a condition, but the decision to enter, exit or remain inactive requires further analysis, risk management and personal rules.
This distinction is especially important for tools associated with smart money concepts, institutional flow or algorithmic analysis. Such terms can describe useful analytical themes, but they should not be treated as automatic instructions. A comparison should examine whether the tool helps users review the underlying context instead of presenting every reading as a trade recommendation.
Evaluate analytical coverage in trading technical analysis
Trading technical analysis involves more than one chart observation. Trend, momentum and market structure can each contribute a different part of the market picture. A tool that brings several analytical areas together may help traders organize their review, provided that the information remains clear and is not reduced to an unexplained score.
Trend analysis
Trend analysis addresses the broader direction or bias visible on a chart. When comparing a trend indicator for TradingView, examine whether it helps the user see the relevant direction and whether the timeframe is clear. A trend reading should not be confused with certainty about what the market will do next.
Ask whether the indicator encourages the trader to consider the broader chart rather than react to one candle or one short-term movement. A useful trend view can provide context, but it remains one part of a wider process.
Momentum evaluation
Momentum relates to the strength or speed of price movement. A momentum indicator for TradingView may help users identify when movement is strengthening, weakening or changing character. These observations can complement trend analysis, but momentum and direction are not identical.
For example, a market can continue moving in one direction while momentum changes. A clear tool should help traders see that distinction rather than combining every condition into a single unexplained buy or sell message.
Market structure
A market structure indicator can organize observations about swings, breaks and changes in the way price is forming. When comparing tools in this category, look for clear terminology and a display that makes the relevant structural event understandable.
Market structure should also be interpreted in relation to timeframe and surrounding price action. A small structural change on one chart may not carry the same meaning as a larger change on another. The best comparison therefore considers not only whether structure is included, but also whether the tool helps users place it in context.
Institutional activity and smart money concepts
Some traders want an institutional flow indicator or smart money indicator to support their review of participation and market behavior. These concepts can be useful areas of study, but labels alone do not prove that a particular market participant has acted or that a future move is likely.
When assessing a smart money trading indicator, review how its terminology is explained. Does the presentation help users understand the analytical idea, or does it rely on impressive-sounding labels without enough detail? A responsible comparison should favor clarity over implied certainty.

Why multi-timeframe context matters
A reading on a short timeframe can look different from the broader market condition. This is why multi-timeframe trend assessment can be valuable when it is presented clearly. It allows a trader to ask whether a short-term observation agrees with, conflicts with or sits inside a wider trend.
Multi-timeframe analysis does not remove uncertainty. It simply gives the trader more context before interpreting a signal. When comparing indicators, check whether timeframe information is easy to identify and whether the tool encourages users to review more than one chart perspective.
| Question | What a careful comparison looks for |
|---|---|
| What is the broader direction? | A clear view of the higher-level trend or market bias being assessed |
| What is happening on the working timeframe? | Specific information about current momentum, structure or price behavior |
| Do the readings agree? | An explanation of alignment or conflict rather than an automatic conclusion |
| What would invalidate the interpretation? | Awareness that market conditions can change and readings have limitations |
Transparency is more useful than impressive terminology
Product descriptions often use terms such as artificial intelligence, institutional flow, smart money, algorithms or advanced signals. These terms may describe the intended analytical approach, but they do not replace an explanation of how the tool should be read.
Before choosing a TradingView trading indicator, look for practical information: the concepts covered, the meaning of the visual elements, the intended use and the support available if installation or activation needs attention. Clear documentation helps traders form realistic expectations and decide whether the tool fits their own method.
Transparency also includes acknowledging what an indicator does not do. A tool can assist with market review without being a financial adviser, broker or provider of official financial advice. It can organize information without eliminating losses or guaranteeing results. These boundaries are part of a responsible comparison, not a weakness.
Use educational value as a comparison criterion
An indicator is more educationally useful when it helps a trader learn to recognize and question market conditions. Instead of treating every alert as an instruction, the trader can use the display to ask:
- What condition is being identified?
- Which timeframe is relevant?
- Does the reading agree with the broader market context?
- What other evidence should be reviewed?
- What would make the interpretation less convincing?
This approach is particularly relevant for beginners, but experienced traders can benefit from it as well. A structured tool may help standardize a chart review and reduce the temptation to make decisions based on one isolated visual cue.
VP ALGO TRADING develops and sells trading indicators and algorithmic trading tools for TradingView. Its identified offering, AKMelytics – Market Intelligence Indicator, can be considered within this broader comparison process. Rather than judging a product only by the number of labels it displays, prospective users should review how its analytical purpose, terminology and chart information fit their own learning and decision-making routine.
How to compare an indicator before using it
1. Define the job you want the tool to perform
Start by writing down whether you need help with trend review, momentum analysis, market structure, institutional activity, smart money concepts or a combination of these areas. A tool cannot be evaluated fairly if its intended role is unclear.
2. Read the explanation before watching the signals
Review the available product information and identify the meanings of the chart elements. Note any terms that require clarification. If the explanation is difficult to follow, consider whether that difficulty will affect your day-to-day use.
3. Observe how different conditions are presented
Look at whether trend, momentum and structure are distinguishable. A display that combines every observation into one color or arrow may be fast to read, but it may provide less educational context than a display with clearly separated information.
4. Test your interpretation against multiple chart situations
Review examples that include directional movement, sideways conditions and changing momentum. Do not focus only on situations that look favorable. The purpose is to learn how the indicator behaves and how its information should be interpreted when the chart is less clear.
5. Create rules for confirmation and risk
Decide what additional analysis you will perform before treating a reading as relevant. Your process may include reviewing price action, timeframe context, market structure or other factors. An indicator should support a process, not replace one.
6. Assess the practical support experience
Installation and activation are also part of usability. VP ALGO TRADING states that customers provide their TradingView ID by email after purchase and can contact support for installation, activation or usage assistance. Review the current product information for the latest access instructions rather than assuming that every TradingView tool uses the same process.
Common mistakes when choosing a trading indicator
Choosing the most active display
More alerts do not automatically mean more insight. Activity can create noise and encourage frequent reactions. Compare the relevance and explanation of readings instead.
Treating a label as a prediction
An indicator reading describes a calculation or detected condition. It does not guarantee a future outcome. Keeping that distinction clear helps prevent overconfidence.
Comparing tools without defining a workflow
A trader who wants a structured market review may need different information from someone studying one narrow technical concept. Define the workflow first, then assess whether the indicator supports it.
Ignoring limitations
Every indicator is based on a method and a set of inputs. Market conditions change, and no tool eliminates uncertainty or trading losses. Responsible use includes reviewing limitations and applying independent judgment.
A better standard for finding the best trading indicator
The best trading indicator is not necessarily the one with the most signals, the most dramatic labels or the longest feature list. It is the one that gives you understandable information for a defined analytical purpose and fits the way you review charts.
When comparing options such as a market structure indicator, momentum tool, trend indicator or smart money indicator, prioritize explanation over volume. Examine the coverage of trading technical analysis, the availability of timeframe context, the clarity of terminology and the opportunity to learn from the chart. This approach produces a more realistic comparison and supports better-informed trading decisions without turning an indicator into a promise of performance.
Frequently asked questions
What makes the best trading indicator different from other indicators?
The best choice depends on the trader’s purpose. A useful indicator should provide relevant, understandable information, fit the trader’s workflow and support disciplined analysis rather than relying only on unexplained signals.
Should I choose an indicator with more buy and sell signals?
Not necessarily. Signal frequency does not show whether the readings are relevant, understandable or suitable for your timeframe. Compare the explanation and analytical purpose behind each signal.
Can one trading indicator cover trend, momentum and market structure?
Some tools are designed to address multiple analytical areas. If a product claims broad coverage, review how each area is presented and whether the information remains clear enough to interpret independently.
Is a smart money indicator a guarantee of better trading results?
No. A smart money indicator may support the study of market behavior or related concepts, but it cannot guarantee profits, eliminate losses or predict future results.
Why is multi-timeframe analysis useful?
It helps traders compare a short-term reading with broader market context. This can reveal alignment or conflict between timeframes, although it does not remove uncertainty.
How should beginners use a TradingView trading indicator?
Beginners should first learn what each reading means, compare it with price and timeframe context, and develop clear rules for confirmation and risk. The indicator should support learning, not replace judgment or financial advice.


Recent Comments