
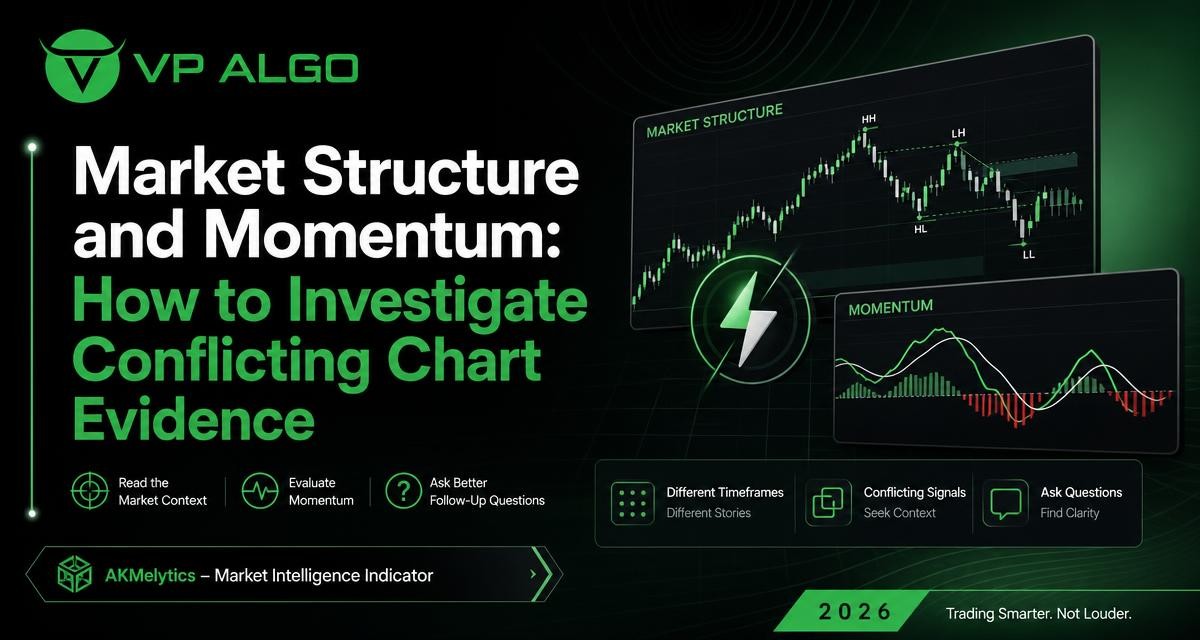
When a chart presents a rising market structure but weakening momentum, or strong momentum inside a broader decline, the disagreement is not necessarily an error. It is a clue that different parts of the market are being measured at different speeds. A market structure indicator can help map swings, breaks and directional context, while a momentum indicator for TradingView can highlight the strength or weakness of recent price movement. Used together, they give traders better questions to investigate before treating one signal as a complete trading decision.
Why structure and momentum can disagree
Market structure describes how price is organizing over time. Traders may study successive highs and lows, changes in swing relationships, breakouts and possible shifts in direction. Momentum focuses more closely on the force behind recent movement. It may rise as price accelerates, weaken while price continues to advance, or turn positive during a rebound that has not yet changed the larger trend.
Because these observations describe different dimensions of price behavior, disagreement is normal. A market can remain in a broader uptrend while its short-term momentum fades. It can also show a sharp upside impulse within a larger downtrend. The key question is not which reading should automatically win. The better question is what the conflict says about context, timing and the next evidence required.
Structure is usually slower than momentum
A meaningful structural change often requires price to move beyond an important swing or invalidate a previous relationship between highs and lows. Momentum can change much earlier because it responds to the speed and direction of recent candles. This difference creates a familiar situation: momentum turns first, while structure remains unchanged.
That early momentum shift may represent a temporary pause, a pullback, or the beginning of a larger reversal. Until price confirms the change through its behavior around relevant swing points, the observation remains a possibility rather than a completed structural conclusion.
Momentum can remain strong during a late move
Strong momentum is not automatically proof that a move has room to continue. Price may accelerate as it approaches a prior high, low, range boundary or other area that traders are watching. In that situation, momentum can look convincing while the broader market is reaching a decision point. Structure provides the surrounding map; momentum describes the current pressure within that map.
Start with context before interpreting the conflict
The same momentum reading can mean different things in a trend, a range and a transition. Before deciding that structure and momentum conflict, describe the environment as clearly as possible. Ask whether price is making directional progress, moving between established boundaries or repeatedly failing to hold new ground.
| Market context | Structure observation | What momentum may be showing | Useful follow-up question |
|---|---|---|---|
| Directional trend | Price continues to hold a sequence of relevant swing relationships | A pullback, continuation impulse or temporary loss of force | Has price actually invalidated the trend, or only slowed down? |
| Trading range | Breaks may fail and price returns toward the range | Short bursts of strength near either boundary | Is momentum producing acceptance beyond the boundary or only a brief excursion? |
| Possible transition | Previous swing relationships begin to weaken | Momentum may shift before a new structure is established | What price level would confirm that the prior direction has changed? |
| Sharp event-driven movement | Large candles can distort the apparent swing picture | Momentum may spike and then normalize quickly | Does later price action support the initial move? |
This classification does not predict what will happen next. It simply prevents a single indicator reading from being interpreted without a surrounding framework. A market structure indicator is most useful when its signals are connected to visible price context rather than read in isolation.
Use multiple timeframes without mixing their roles
Conflicting evidence often appears because traders compare a structure reading from one timeframe with momentum from another without defining the purpose of each chart. A higher timeframe can provide directional context, while a lower timeframe can show the current phase of a pullback or attempt to continue. Neither timeframe has to be treated as the only correct one.
Assign a question to each timeframe
Instead of asking every chart to answer the same question, give each one a specific job. A broader chart may help answer, “What type of market environment is price in?” A middle timeframe may help answer, “Is the current movement aligned with or opposed to that environment?” A more detailed chart may help answer, “What evidence would confirm or reject the immediate idea?”
- Higher timeframe: Identify the broader swing context, major directional relationships and whether price is trending or ranging.
- Intermediate timeframe: Examine the current leg, pullback or consolidation within that context.
- Lower timeframe: Observe short-term momentum behavior and whether a proposed continuation or reversal is gaining acceptance.
The exact chart intervals depend on the trader’s process. The important principle is consistency. If a lower-timeframe momentum change is treated as a full reversal while the higher-timeframe structure remains intact, the conclusion may be stronger than the evidence supports.
Watch for timeframe compression
A movement that looks like a reversal on a detailed chart may be only a pullback on a broader chart. Conversely, a gradual change that seems insignificant on a short timeframe may become important when it alters a major swing relationship. When readings disagree, expand the view and identify which swing points matter to the question being asked.
A practical investigation process
When structure and momentum do not agree, use a repeatable investigation rather than reacting to the most visible signal. The following process is designed to organize chart evidence. It is not a promise that any particular outcome will follow.
1. Describe the structural state
Write down what price has actually done. Has it created higher or lower relevant swings? Has it broken a level and held beyond it, or has it quickly returned? Is the market making progress, or is it moving inside a boundary? Avoid beginning with labels such as “bullish” or “bearish” before recording the underlying observations.
2. Describe the momentum state
Next, identify whether momentum is increasing, decreasing, crossing, diverging from price behavior or simply oscillating around a central area. A momentum reading should be connected to a recent price segment. Ask whether the indicator is measuring acceleration, a loss of force or a move that has already occurred.
3. Separate fact from interpretation
“Price has held above the previous swing low” is an observation. “The trend will continue” is an interpretation. Keeping those statements separate makes it easier to assess new evidence without defending an early conclusion. This distinction is especially useful when an indicator changes before price confirms a structural shift.
4. Define the invalidation evidence
Decide what would make the current interpretation less credible. For a continuation idea, that might be a failure to hold a relevant level or a return into a prior range. For a reversal idea, it might be the absence of follow-through or the inability to establish a new swing relationship. The point is to specify the evidence before the chart becomes emotionally compelling.
5. Wait for the next informative behavior
Not every disagreement needs an immediate resolution. Sometimes the next useful information comes from a retest, a failed break, renewed momentum or a clear change in the swing sequence. Waiting for a defined follow-up observation can be more informative than adding more indicators to the chart.

Common types of disagreement
Rising structure with weakening momentum
This pattern may indicate that the trend is losing short-term force, but it does not by itself prove that the trend has ended. Price can continue to make higher highs while momentum gradually declines. Investigate whether pullbacks are becoming deeper, whether relevant lows are still holding and whether each new advance is being accepted or quickly rejected.
The most useful follow-up is often structural. Has price actually broken a level that matters, or has momentum only warned that the current advance is less forceful than before?
Falling structure with improving momentum
Improving momentum during a decline can reflect a short-term recovery, reduced selling pressure or the early stages of a potential transition. It remains incomplete until price changes the relevant swing relationships. Examine whether the rebound can hold above a prior reference point and whether subsequent selling produces a new low.
This is where a momentum indicator for TradingView can help frame an early question, while structure provides the confirmation criteria. The two observations do not need to agree at the same moment.
Strong momentum inside a range
Momentum can become strong near the top or bottom of a range without creating a lasting breakout. A trader investigating this condition should distinguish between an excursion beyond a boundary and sustained acceptance outside it. Price returning inside the range may carry more information than the initial burst of momentum.
A structural break without convincing momentum
A break of a swing level with limited momentum may represent a genuine change, a slow transition or a false break. Rather than dismissing it because the momentum reading is modest, inspect the quality of the break, the subsequent hold and the behavior on any retest. A market does not need a dramatic impulse for every structural adjustment, but the new condition should still be tested against later price action.
How an indicator can support the investigation
A multi-factor TradingView tool can make it easier to place related observations in one analytical workflow. VP ALGO TRADING describes its AKMelytics – Market Intelligence Indicator as covering areas such as trend analysis, momentum evaluation, market structure, institutional activity, multi-timeframe trend assessment and smart money analysis. These categories can help traders organize questions that might otherwise be scattered across several chart studies.
The value of such a tool is not that it removes uncertainty. Its role is to help users compare evidence consistently. For example, a trader may use market structure information to identify the relevant swing context, momentum information to assess the current impulse and multi-timeframe information to see whether the observations belong to the same directional environment.
Questions to ask when using a market structure indicator
- Which swing points is the indicator treating as significant?
- Does the displayed break represent a confirmed change or an early observation?
- What timeframe produced the structure reading?
- Is current momentum aligned with the broader context or moving against it?
- What price behavior would make the present interpretation less convincing?
- Am I using the tool to investigate evidence, or searching for confirmation of a preferred outcome?
These questions encourage a process-led approach. A visual label may draw attention to a condition, but the trader still needs to understand the chart setting, timeframe and limitations of the observation.
Avoid stacking indicators that measure the same thing
When readings conflict, adding more studies can feel like a solution. It may instead create several versions of the same information. Multiple momentum tools may all react to recent price movement, while several trend tools may repeat a lagging view of direction. More signals do not automatically create more independent evidence.
Before adding another indicator, identify the missing question. Do you need a clearer view of swing context, a way to compare timeframes, a better description of momentum change or a method for recording invalidation conditions? If the question is unclear, additional chart elements may increase visual noise rather than improve analysis.
Build a simple evidence worksheet
A short worksheet can make conflicting observations easier to review. It also helps distinguish what was visible on the chart from what was assumed at the time. The format can be adapted to a trader’s own process.
| Area | Record |
|---|---|
| Context | Trend, range or possible transition |
| Structure | Relevant highs, lows, breaks and failed breaks |
| Momentum | Increasing, decreasing, neutral or changing direction |
| Timeframe relationship | How the broader and more detailed charts relate |
| Conflict | The exact observations that do not agree |
| Follow-up evidence | The next behavior that would clarify the situation |
| Risk boundary | The condition that invalidates the working interpretation |
This worksheet is not a trading signal. It is a way to slow down interpretation and make the reasoning inspectable. Over time, it can also reveal whether a trader repeatedly treats short-term momentum as a structural reversal, or overlooks weakening momentum because a broader trend label remains unchanged.
Practical limitations and responsible use
Indicators process price information according to their design and settings. They do not remove ambiguity from markets, and they cannot guarantee that a displayed condition will lead to a particular outcome. A market structure indicator may help define a chart observation, but it should not be presented as a substitute for judgment, risk management or independent analysis.
VP ALGO TRADING positions its indicators and trading tools for educational and trading-decision assistance purposes rather than official financial advice. Traders should understand the tool they use, review how its readings fit their own process and avoid treating historical or current chart behavior as a guarantee of future results.
Final framework: let disagreement generate better questions
Conflicting chart evidence is often most useful when it exposes a difference in scale or timing. Structure may describe the market’s broader organization, while momentum may show the strength of the latest movement. One can change before the other without either reading being meaningless.
Start with context, assign clear roles to each timeframe, record observations separately from interpretations and define the evidence that would confirm or weaken the current view. A market structure indicator and a momentum indicator for TradingView can support that process when they are used to investigate relationships rather than produce automatic conclusions. The goal is not to force every chart component into agreement. It is to understand why they disagree and what the market would need to show next.
Frequently asked questions
What is a market structure indicator used for?
A market structure indicator helps organize observations about swings, highs, lows, breaks and possible changes in directional context. Its readings still need to be interpreted alongside price behavior and timeframe.
Why can momentum turn before market structure changes?
Momentum responds to the strength and speed of recent movement, while structural change usually depends on price altering important swing relationships. For that reason, momentum can weaken or improve before structure is confirmed to have changed.
Does weakening momentum mean that a trend has ended?
No. Weakening momentum may describe a pause, pullback or loss of short-term force. A trend conclusion requires additional evidence, such as a meaningful failure to hold relevant structure or a confirmed change in swing relationships.
How should multiple timeframes be used?
Give each timeframe a specific role. A broader chart can provide context, an intermediate chart can show the current phase and a more detailed chart can help investigate immediate follow-up behavior. Avoid treating a lower-timeframe shift as a complete reversal without broader confirmation.
What does a momentum indicator for TradingView add to analysis?
It can help describe whether recent price movement is gaining or losing force. It is most informative when compared with structure and context rather than used as a standalone prediction tool.
Can a market structure indicator guarantee a trading outcome?
No. An indicator organizes market information but cannot guarantee profits, eliminate losses or predict future results. It should be used as part of an independent and risk-aware analytical process.
How does AKMelytics – Market Intelligence Indicator fit this approach?
VP ALGO TRADING describes AKMelytics as covering trend, momentum, market structure, institutional activity, multi-timeframe trend assessment and smart money analysis. Traders can use those areas to compare chart evidence, while retaining responsibility for interpretation and decisions.


Recent Comments