
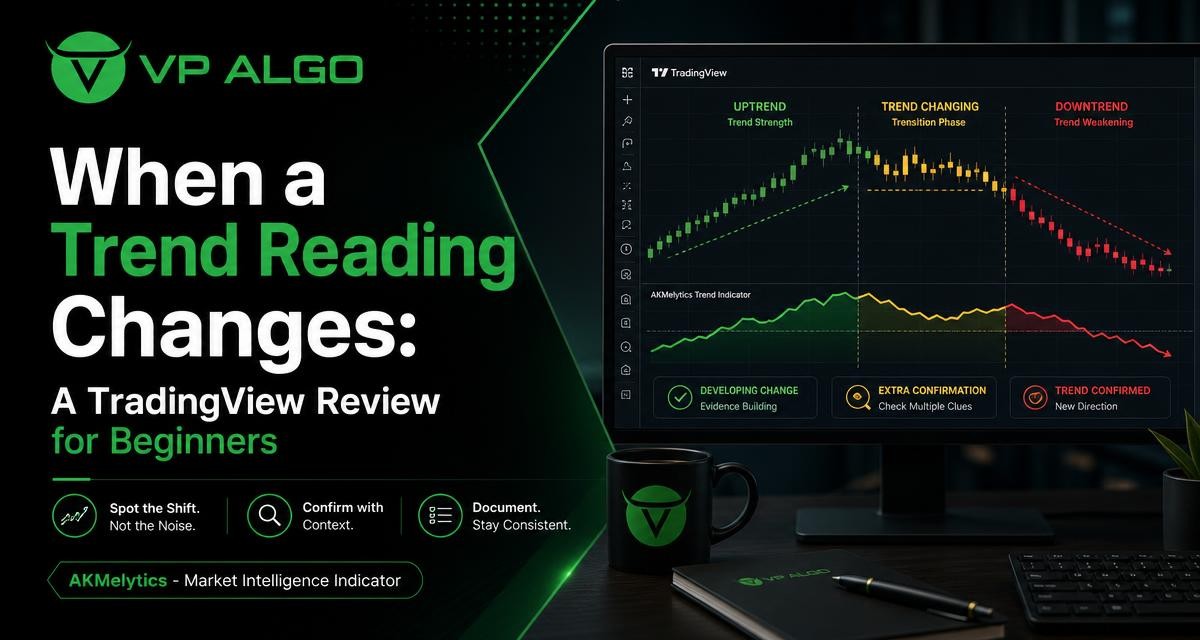
A trend indicator for TradingView can help beginners organise what they see on a chart, but a changing reading should not automatically be treated as a confirmed reversal. Markets often move through pauses, pullbacks and brief bursts of momentum before the broader direction becomes clearer. A useful review process combines the indicator reading with price structure, timeframe context and written observations.
Why trend readings change
Most trend tools respond to changes in price, momentum or market structure. When price begins moving differently, the indicator may change colour, print a new signal, alter its trend state or show a loss of momentum. That change is information, but it is not a complete explanation of what the market will do next.
A reading can change for several reasons:
- A genuine directional shift: buyers or sellers may be gaining control after a period of balance.
- A normal pullback: price may move against the prevailing trend before continuing in the original direction.
- A range-bound market: repeated reversals may produce conflicting readings because neither side has sustained control.
- A timeframe difference: a short-term chart may turn bearish while a higher timeframe remains bullish.
- A momentum slowdown: the trend may still exist, but its pace has weakened.
Understanding these possibilities prevents a common beginner mistake: treating every new signal as a new trend. The better question is whether the change is supported by several independent observations.
What to review before calling a trend change
Start with price structure
Price structure provides the basic framework for stock trend analysis. In a rising structure, traders commonly look for a sequence of higher highs and higher lows. In a falling structure, lower highs and lower lows are more consistent with continued weakness. A market that has not broken a meaningful structural level may simply be retracing.
Draw attention to the most recent swing points rather than every small movement. On an active chart, minor fluctuations can make the market appear to change direction repeatedly. A structural break is more useful when it is clear on the selected timeframe and followed by price that holds beyond the broken area.
Check momentum separately
Trend and momentum are related, but they are not identical. Price can remain in an upward trend while momentum fades. It can also produce a sharp short-term move without establishing a lasting trend. A momentum indicator for TradingView can add context by showing whether movement is strengthening, slowing or becoming inconsistent.
Do not use a momentum change in isolation. A weakening momentum reading may warn that a trend is becoming less forceful, but it does not by itself prove that sellers have taken control. Compare the momentum observation with the recent price structure and the behaviour of the next few candles.
Use more than one timeframe
A trend reading is always connected to a timeframe. A five-minute chart may show several changes during a single session, while a daily chart may still display one uninterrupted trend. This is not necessarily a contradiction. It may simply show that the lower timeframe is moving inside the broader market structure.
Beginners can use a simple top-down record:
- Note the broad direction on the higher timeframe.
- Record whether the working timeframe agrees or disagrees.
- Use the lower timeframe only to study the detail of the current move.
- Write down what would need to happen for the higher-timeframe view to change.
This approach makes it easier to distinguish a short-term fluctuation from a broader trend transition.
A practical framework for documenting a changing trend
Writing down the evidence can be more useful than repeatedly changing chart settings. A simple journal encourages consistent analysis and makes hindsight less persuasive. Record the chart context before deciding whether a new reading deserves attention.
| Observation | Question to ask | What it may indicate |
|---|---|---|
| Indicator trend reading | Has the state changed once or remained changed? | A warning, transition or potentially developing move |
| Recent swing points | Has price broken and held beyond a meaningful level? | Possible change in market structure |
| Momentum | Is movement strengthening, fading or conflicting? | Follow-through, exhaustion or uncertainty |
| Higher timeframe | Does the broader chart support the new reading? | Alignment or a lower-timeframe counter-move |
| Market condition | Is price trending or moving sideways? | More or less reliability for directional signals |
| Next confirmation | What specific evidence would support or weaken the view? | A defined review plan instead of an impulse |
Record the first change, then the follow-through
The first change in a trend indicator is often best treated as an alert for further review. Mark the candle or area where the reading changed, then observe whether price develops in the same direction. Follow-through can include a sustained break, a new swing sequence or continued momentum, depending on the method being used.
This does not mean waiting for certainty, which is rarely available in markets. It means separating an initial signal from the evidence that gives the signal context. A journal entry might state: “The indicator changed bearish on the working timeframe, but the higher timeframe remains bullish and the latest low has not broken.” That is more precise than simply writing “trend reversed.”
Describe uncertainty directly
Good analysis allows for mixed conditions. If the indicator is bullish but price is below a recent swing high, record both facts. If momentum is improving while the broader structure remains weak, do not force the chart into a single label. Terms such as “developing,” “unconfirmed” and “range-bound” can describe the situation more accurately.
Documenting uncertainty also helps beginners review decisions fairly. A later price move should not change what was reasonably visible at the time. The purpose of the record is to improve the process, not to make every past chart look obvious.
How to distinguish a developing change from noise
There is no universal test that proves whether a trend change is real. However, several questions can help assign more weight to a reading. The more observations that agree, the stronger the case for continued review. The more observations that conflict, the more cautious the interpretation should be.
- Persistence: Does the new reading remain in place, or does it reverse on the next few candles?
- Structure: Has price changed its pattern of highs and lows?
- Location: Is the change occurring near a significant recent level or in the middle of a noisy range?
- Participation: Does the movement show convincing follow-through, or does it quickly lose energy?
- Timeframe alignment: Do other relevant timeframes support the same interpretation?
- Market regime: Has the chart been trending, consolidating or repeatedly reversing?
A brief move against the trend may be noise when it lacks follow-through and leaves the underlying structure intact. The same initial move may deserve closer attention when it breaks a meaningful level, establishes a new swing pattern and remains supported by momentum.
Using a TradingView indicator without over-relying on it
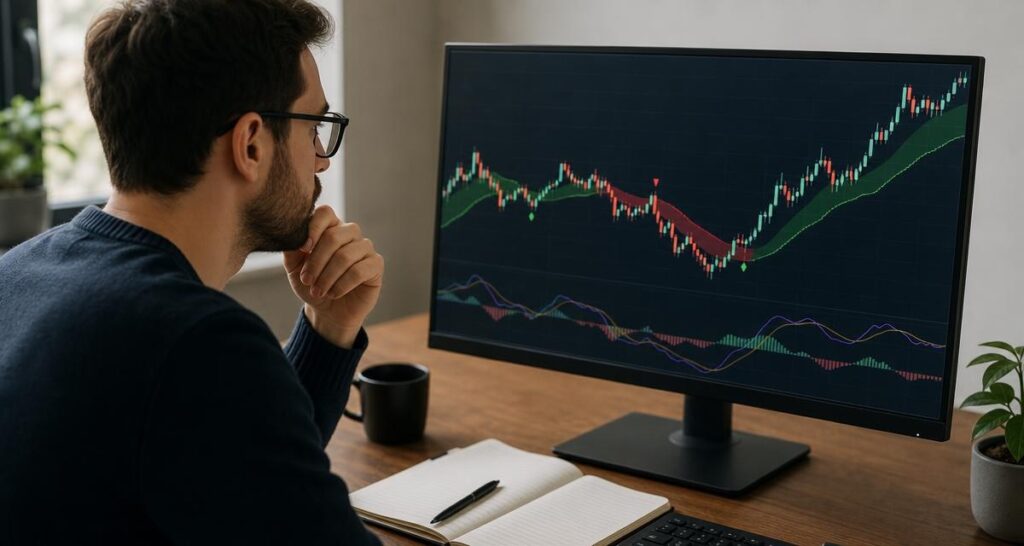
TradingView gives users a flexible charting environment, so beginners can easily add several tools. More indicators do not automatically create better analysis. If multiple tools respond to the same price movement, they may appear to confirm one another while offering little independent information.
A more disciplined chart may include one trend-oriented view, one way to examine momentum and clearly marked price structure. The goal is not to collect signals. It is to answer practical questions: What is the current direction? How strong is the move? What would invalidate the current interpretation?
Understand what the indicator measures
Before relying on any trend indicator for TradingView, read its description and learn how its readings are generated. Find out whether it focuses mainly on price direction, momentum, market structure or a combination of conditions. Also determine whether a displayed signal can change while a candle is still forming.
This matters because an unfinished candle may produce a temporary reading that changes before the candle closes. Beginners should distinguish between an intrabar indication and a confirmed close-based observation. The exact behaviour depends on the individual tool and its settings, so it should be tested and understood before being used as part of a routine.
Keep settings consistent during review
Changing inputs after every losing or conflicting observation makes it difficult to know whether the method is helping. Start with settings that you understand, apply them consistently and record the results of your observations. Adjustments can be evaluated later rather than made in response to one chart.
Consistency does not make a tool infallible. It simply makes the review more meaningful. A beginner can then ask whether the indicator provides useful context in trending markets, how it behaves during consolidation and whether its signals tend to arrive early, late or inconsistently.
Where a market intelligence indicator fits
VP ALGO TRADING develops and sells TradingView indicators and algorithmic trading tools. Its identified offerings include the AKMelytics – Market Intelligence Indicator, while the company also describes the Delphi Intelligence Smart Money Indicator as combining trend analysis, momentum evaluation, market structure, institutional activity and smart money concepts.
For a beginner reviewing a market intelligence or smart money indicator, the sensible starting point is not to treat every displayed condition as an instruction. Instead, examine how the tool helps organise observations across trend, momentum and structure. Ask whether the chart presentation makes it easier to compare timeframes, identify a developing change and document what remains unconfirmed.
These tools are intended to support education and trading-decision analysis rather than provide financial advice. They do not remove uncertainty or eliminate losses. A user should understand the indicator, test a review process and make independent decisions within an appropriate risk framework.
A beginner-friendly review routine
The following routine can be completed whenever a trend reading changes:
- Save the chart context. Note the instrument, timeframe, date and indicator settings used.
- Mark the recent structure. Identify the relevant highs, lows, support areas and resistance areas visible on the chart.
- Describe the new reading. Write exactly what changed rather than immediately naming it a reversal.
- Check momentum. Decide whether the move is gaining strength, losing strength or producing mixed evidence.
- Compare timeframes. Record whether the higher timeframe agrees with the working chart.
- Define confirmation. State what future price behaviour would support the developing interpretation.
- Review later. Assess whether the new reading persisted, failed or remained inside a range.
This routine is deliberately descriptive. It does not tell a trader when to buy or sell. Its purpose is to create a repeatable method for studying changing conditions and reducing emotional reactions to individual candles.
Common beginner mistakes when a trend changes
Calling every pullback a reversal
A pullback can move sharply and still leave the larger trend intact. Check whether the recent structure has actually changed before labelling it a reversal.
Ignoring the higher timeframe
A lower-timeframe signal may be useful for studying short-term behaviour, but it should not automatically override the broader chart. Record the disagreement instead of hiding it.
Adding indicators until they agree
Several tools may be derived from similar price information. Select indicators for distinct analytical purposes and understand what each one contributes.
Changing settings to fit the last outcome
Frequent adjustments can create an attractive historical appearance without improving the underlying process. Use a stable method long enough to evaluate its behaviour across different market conditions.
Treating a signal as certainty
Even a well-defined reading can be wrong. A trend indicator is an analytical aid, not a guarantee of direction or outcome. Good documentation includes the possibility that the interpretation will fail.
Final perspective
A changing reading on a trend indicator for TradingView is a prompt to investigate, not a conclusion by itself. Beginners can improve their stock trend analysis by combining the indicator state with price structure, momentum, timeframe context and a written confirmation plan.
The most useful review is often the one that explains why the market is uncertain. By recording what changed, what remained intact and what evidence would matter next, traders can build a clearer process without mistaking a short-term fluctuation for a fully developed trend.
Frequently asked questions
What is a trend indicator for TradingView?
It is a chart-based tool that helps display or interpret directional market conditions on TradingView. The exact inputs and behaviour depend on the individual indicator, so users should understand its methodology and settings.
Does a changed trend reading confirm a reversal?
No. A changed reading may reflect a pullback, momentum slowdown, consolidation or an emerging reversal. Price structure, follow-through and timeframe context can help determine how much weight to give it.
How can beginners identify short-term market noise?
Look for a lack of persistence, limited follow-through and no meaningful change in the sequence of highs and lows. Comparing the move with a higher timeframe can also show whether it is part of a broader trend.
Why should momentum and trend be reviewed separately?
Trend describes directional structure, while momentum describes the strength or pace of movement. A trend can continue while momentum fades, and a sharp momentum burst may occur without creating a lasting trend.
Should beginners use several TradingView indicators?
More indicators are not always better. A simpler chart with distinct tools for trend, momentum and structure may be easier to understand than a crowded chart with overlapping signals.
What should be written in a trend-change journal?
Record the timeframe, indicator reading, recent swing points, momentum condition, higher-timeframe view and the evidence that would confirm or weaken the interpretation.
Can an indicator provide financial advice?
No. Trading indicators are analytical tools and cannot remove market risk or guarantee an outcome. The offerings discussed here are positioned for educational and trading-decision assistance, not as official financial advice.


Recent Comments