
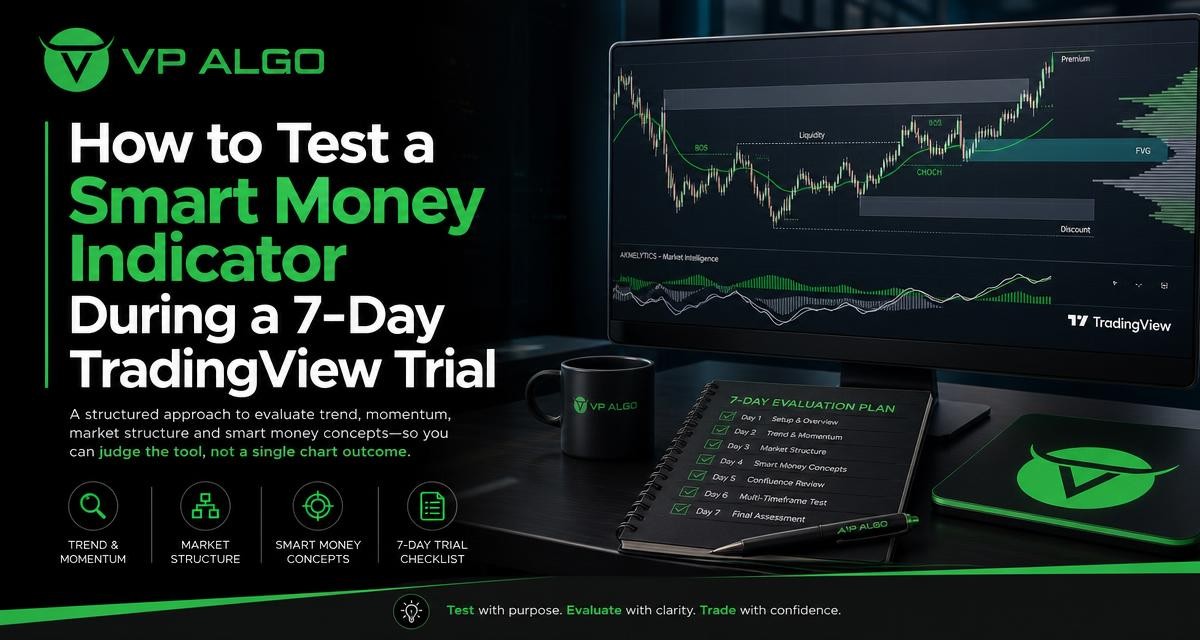
A seven-day trial is long enough to examine a smart money indicator for TradingView carefully, but only if you use a consistent review process. Instead of judging the tool by one winning or losing chart outcome, use the trial to study how it presents trend, momentum, market structure, institutional activity and smart money concepts across the charts you already follow.
What a useful indicator trial should help you answer
The purpose of a trial is not to prove that an indicator can predict every market move. No indicator removes uncertainty or guarantees profitable trading. A better objective is to determine whether the tool organizes relevant market information in a way that suits your analysis and decision-making process.
By the end of seven days, you should have a clearer view of whether the indicator is understandable, relevant to your workflow and useful across different market conditions. You should also know which features deserve attention and which signals you would treat cautiously.
| Trial question | What to review |
|---|---|
| Can I understand the information? | Labels, colours, panels, signal descriptions and chart layout |
| Does it support my analysis? | Trend, momentum, market structure and smart money features |
| Does it fit my process? | Timeframes, chart routine, trade planning and note-taking |
| Does it encourage disciplined decisions? | Whether it provides context rather than prompting impulsive entries |
| Can I use it consistently? | Clarity, setup requirements and the amount of information displayed |
Before day one: set up a fair test
Start by writing down what you want the indicator to help you evaluate. For example, you may want a clearer view of the prevailing trend, additional confirmation for momentum, or a structured way to observe market structure and institutional activity. A written objective prevents the trial from becoming a search for attractive signals.
It is also useful to record the charts and timeframes you normally study. Do not change your entire trading routine simply to make the indicator look useful. Review it on familiar charts first, then consider whether it adds information that was previously difficult to organize.
Prepare a simple review sheet
A short journal can make the seven-day trial more informative. For each observation, record the date, market or chart being reviewed, timeframe, apparent trend, momentum condition, relevant structure and what the indicator displayed. Note whether the information confirmed your own analysis, challenged it or added context you had not considered.
- Write down the question you were asking before opening the chart.
- Record what the indicator showed before considering a possible trade.
- Separate the quality of the information from the outcome of a later price move.
- Note confusing labels, clutter, delayed changes or features you did not use.
- Review your notes at the end of the trial rather than relying on memory.
This approach helps you evaluate the tool as a TradingView trading indicator, not as a collection of isolated buy and sell prompts. The quality of a decision-support tool depends partly on whether you can apply its information consistently.
Day one: learn the chart interface and terminology
Use the first day to understand what is displayed before interpreting the signals. Explore the main chart elements, trend readings, momentum information, market structure markings and smart money features. If the chart contains several layers of information, identify what each layer is intended to represent.
Do not assume that every visual change means a complete change in market direction. A chart can show short-term momentum moving against a broader trend, or a structural development that requires additional context. Your first task is to learn how the indicator organizes these different observations.
Questions to ask on the first day
- Which features describe the broader trend?
- Which features relate to shorter-term momentum?
- How are changes in market structure shown?
- Which elements relate to institutional activity or smart money analysis?
- Can you explain the chart output in your own words?
If you need help with installation, activation or usage, VP ALGO TRADING states that support is available for those areas. Keep a note of any question you ask so that your final assessment includes both the indicator experience and your understanding of its features.
Days two and three: review trend and momentum together
A trend indicator for TradingView can be useful when it gives you a consistent way to describe directional conditions. During days two and three, compare the indicator’s trend information with the price structure you can see on the chart. Ask whether the display helps you distinguish between a broader directional bias and a short-lived price movement.
Then review momentum separately. A momentum indicator for TradingView should not be treated as an automatic instruction to enter a position. Instead, consider whether it helps you identify strengthening, weakening or conflicting conditions. Momentum can change before the broader structure changes, so disagreement between the two readings is something to document rather than immediately dismiss.
| Area | Useful review questions | What not to assume |
|---|---|---|
| Trend | Does the display make the prevailing direction easier to describe? | That a trend reading will continue indefinitely |
| Momentum | Does it show whether current movement is strengthening or weakening? | That momentum alone confirms a trade |
| Timeframe context | Can you compare broader and shorter-term readings? | That every timeframe will agree |
| Conflicting signals | Does the tool make disagreement visible? | That conflict must be resolved with a forced entry |
Use multiple timeframes without forcing agreement
The indicator includes multi-timeframe trend assessment as part of its feature set. Use this part of the trial to observe how information from different timeframes relates. A higher timeframe may present one condition while a lower timeframe shows a temporary movement in another direction.
The goal is not to find a perfect alignment on every chart. It is to understand whether the multi-timeframe view helps you frame a market question more clearly. For example, you might use it to distinguish a short-term pullback from a broader change in direction, while still requiring your own analysis before making a decision.
Days four and five: examine market structure and smart money concepts
On days four and five, focus on market structure and smart money concepts. Market structure analysis involves observing how price develops over time, including changes in directional behaviour and important areas on the chart. A market structure indicator can organize these observations, but its markings still need to be interpreted in context.
Smart money concepts are often used to discuss institutional activity, liquidity and the way significant market participants may influence price behaviour. In a trial, avoid treating a smart money label as proof that a particular institution has entered or will continue to support a move. Instead, assess whether the feature helps you study the relationship between structure, momentum and price action.
Review structure in context
For each chart, first describe what you see without relying on the indicator. Then review the indicator’s market structure and smart money features. This two-step process helps you identify whether the tool adds useful organization or simply causes you to follow labels without understanding the chart.
- Compare the displayed structure with visible price behaviour.
- Look for situations where trend and structure support the same interpretation.
- Record cases where momentum and structure point in different directions.
- Observe how the tool presents possible institutional activity without treating it as certainty.
- Ask whether the information improves your planning or merely adds more chart elements.
This is also a good time to review how quickly you understand the display. A feature may be technically interesting but still unsuitable for your process if you cannot explain its purpose or apply it consistently.
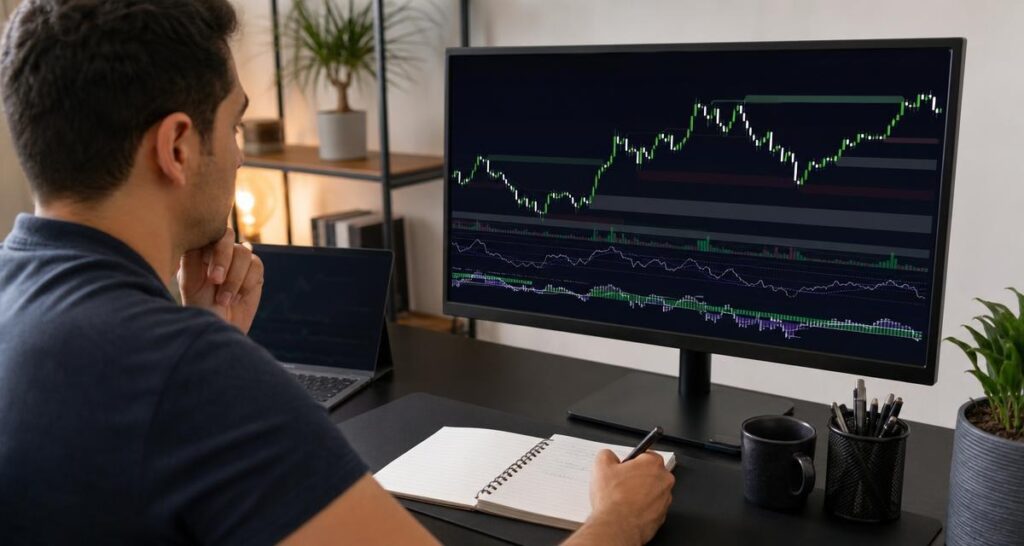
Day six: test the complete workflow
Use the sixth day to combine the features in the same sequence you would use during ordinary analysis. Begin with the broader trend, review momentum, examine market structure, and then consider smart money or institutional-flow information. This order keeps the indicator in a supporting role and reduces the temptation to react to one prominent chart label.
Write down your analysis before checking how the chart develops. The purpose is not to produce a performance statistic or claim that past chart behaviour predicts future results. It is to determine whether the indicator helps you create a repeatable review process and whether its information remains understandable when several features appear together.
Assess the quality of the workflow
A suitable workflow should be clear enough that you can repeat it. It should also leave room for risk awareness and independent judgment. The indicator is designed to assist with market evaluation and trading decisions; it is not a substitute for financial advice or a guarantee of a particular outcome.
Consider these practical points:
- How long does it take to interpret the chart?
- Which features do you actually use?
- Does the display reduce confusion or create additional noise?
- Can you record a reason for a decision without relying on vague phrases?
- Would you still apply your own rules when the indicator and your initial view disagree?
Day seven: review the evidence and decide what fits
On the final day, review your journal rather than focusing on the most memorable chart. Group your observations into strengths, limitations and unanswered questions. Pay particular attention to repeated patterns in your own use of the tool: perhaps the trend view was clear, while the smart money features required more study, or perhaps the additional information made your chart routine less efficient.
Judge the indicator against your stated objective. If your objective was to organize trend, momentum, market structure and institutional activity in one TradingView workspace, ask whether the tool helped you do that. If your objective was to find guaranteed entries or remove trading risk, the trial cannot validly support that expectation because no indicator can provide such a guarantee.
| Assessment category | Positive evidence | Warning signs |
|---|---|---|
| Clarity | You can explain the main features and their purpose. | You rely on unexplained labels or colours. |
| Context | Trend, momentum and structure can be reviewed together. | One signal dominates every decision. |
| Consistency | You can follow the same review sequence across charts. | Your interpretation changes based on the latest outcome. |
| Practical fit | The information supports your existing TradingView routine. | The chart becomes too distracting or difficult to read. |
| Expectations | You treat the tool as analysis support. | You expect certainty, guaranteed profits or eliminated losses. |
Common mistakes when testing a smart money indicator
Judging it by one chart outcome
A single profitable or unprofitable outcome says little about whether an indicator fits your process. Review several observations and focus on clarity, consistency and context rather than trying to prove that the tool is always right.
Changing too many variables
If you switch markets, timeframes, strategies and chart layouts at the same time, it becomes difficult to know what you are evaluating. Start with familiar charts and make changes one at a time.
Confusing information with instruction
A smart money trading indicator can present information about trend, structure, momentum or institutional activity. That information still requires interpretation. Treating every label as an automatic buy or sell instruction can weaken rather than improve your decision process.
Ignoring usability
Technical capability is only one part of an indicator’s value. If the display is difficult to understand or creates excessive noise, that matters. A feature is useful only when you can apply it responsibly and consistently.
How to request the trial and follow up
VP ALGO TRADING offers a request-based seven-day free trial for its indicator and Telegram channel. Before requesting access, prepare your TradingView details and write down the questions you want answered during the trial. After purchase, the company instructs customers to provide their TradingView ID by email for product access.
For installation, activation or usage questions, contact the company’s support channel using the details provided by VP ALGO TRADING. Review the current information supplied by the company for trial eligibility, access and purchase terms rather than assuming that conditions are the same for every user.
Final checklist for your seven-day review
Use this checklist before reaching a conclusion about the AKMelytics – Market Intelligence Indicator:
- I understand what the trend, momentum, structure and smart money features display.
- I tested the indicator on charts and timeframes relevant to my own routine.
- I compared the tool’s information with independent chart observations.
- I recorded conflicting conditions instead of forcing them into a single signal.
- I assessed clarity and workflow fit, not just individual chart outcomes.
- I understand that the indicator supports analysis and does not provide financial advice or guaranteed results.
- I know which questions to ask before requesting continued access or purchasing.
A structured trial gives you a more useful basis for evaluation than a quick glance at a few signals. By reviewing trend, momentum, market structure, institutional activity and smart money concepts together, you can decide whether this smart money indicator for TradingView belongs in your own analysis process.
Frequently asked questions
What should I look for in a smart money indicator for TradingView?
Look for clear presentation of relevant market information, including trend, momentum, market structure and smart money features. Also assess whether you can understand and use the information consistently within your existing chart routine.
Can the indicator guarantee profitable trades?
No. The indicator is intended to assist with market evaluation and trading decisions. It does not guarantee profits, eliminate losses or provide certainty about future market movements.
How should I evaluate smart money concepts during the trial?
Compare the smart money features with visible price behaviour and market structure. Treat the information as analytical context rather than proof of a particular institution’s activity or a guaranteed future move.
Should I judge the indicator by its buy and sell signals?
Do not judge it by signals alone. Review how the signals relate to trend, momentum, structure and your own trading rules, and assess whether the complete workflow improves clarity and consistency.
Why should I use more than one timeframe?
Different timeframes can show different conditions. Reviewing them together may help you distinguish broader directional context from shorter-term movement, but agreement between timeframes should not be treated as a guarantee.
What support is available if I need help using the indicator?
VP ALGO TRADING states that customers can contact support for installation, activation or usage assistance. Follow the contact instructions supplied by the company for the relevant request.
What happens after purchasing the indicator?
VP ALGO TRADING instructs customers to provide their TradingView ID by email for product access. Check the company’s current instructions and contact support if you need help with activation or use.


Recent Comments