
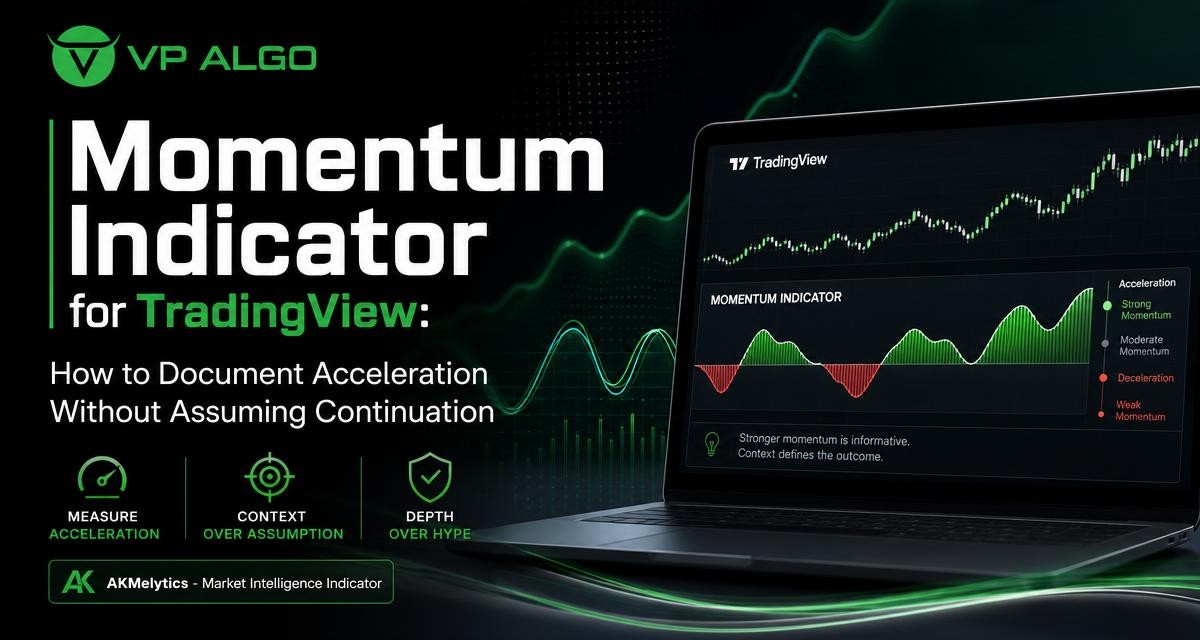
A momentum indicator for TradingView can help traders document when price movement is becoming stronger, weaker, or more uneven. That information is useful, but it does not establish that a move will continue. A careful process compares momentum with trend direction, market structure, volatility, and the broader conditions visible on the chart. The goal is not to turn acceleration into a promise. It is to record what is changing and decide what still needs confirmation.
What momentum actually tells you
Momentum describes the rate and force of price movement over a chosen period. When price advances more quickly than it did previously, momentum may be described as strengthening. When the advance loses force, momentum may be weakening even if price is still rising. The same principle applies to declining markets.
This distinction matters because direction and momentum are not identical. Price can move upward with weak momentum, rise sharply for a short period, or remain in a broader uptrend while short-term momentum turns lower. A momentum reading records the current character of movement; it does not independently explain whether that movement has enough support to continue.
Acceleration is a condition, not a forecast
Acceleration means that price movement is becoming more pronounced relative to a reference period or recent baseline. On a chart, this may appear as expanding candles, a faster sequence of higher closes, a momentum line moving away from its prior range, or a stronger indicator signal. Each observation can be useful, but none removes uncertainty.
Strong momentum can occur at the beginning of a new directional move. It can also occur late in an extended move, during a short-lived reaction, or when market participants are responding to a sudden change in conditions. For that reason, a momentum indicator is best treated as a measurement layer within a broader analysis rather than as a standalone buy and sell instruction.
How a momentum indicator for TradingView supports chart documentation
TradingView gives traders a visual environment in which price, indicator readings, levels, and multiple timeframes can be reviewed together. A momentum indicator can make changes in the pace of movement easier to record consistently. Instead of relying only on a subjective impression that a chart “looks strong,” a trader can describe what the indicator is showing and compare it with observable price behaviour.
Useful documentation focuses on relationships rather than isolated signals. For example, a trader might record that momentum strengthened as price moved through a prior level, then note whether the breakout held, whether structure changed, and whether the higher timeframe agreed with the move. This creates a more disciplined chart review without treating the indicator as a prediction tool.
| Observation | What it may describe | What it does not prove |
|---|---|---|
| Momentum rises with expanding price movement | Acceleration is increasing | That the move must continue |
| Momentum rises while price remains below resistance | Buying pressure may be increasing within a range | That resistance will be broken |
| Price makes a new high but momentum does not | Momentum may be lagging or diverging | That a reversal is certain |
| Momentum weakens during an established trend | The pace of movement may be slowing | That the trend has ended |
| Momentum agrees across more than one timeframe | Directional conditions appear more aligned | That the setup is risk-free |
Read momentum alongside trend direction
A momentum reading becomes more informative when it is placed inside a defined trend. Trend analysis asks whether price is forming a sequence of higher highs and higher lows, lower highs and lower lows, or relatively balanced swings. Momentum analysis asks how forcefully price is moving within that structure.
For stock trend analysis, consider separating the chart into at least two questions: What is the broader direction, and what is the current pace of movement? A rising market with improving momentum may indicate alignment between direction and acceleration. A rising market with declining momentum may indicate a slowing advance, but it may still remain structurally bullish until important levels or swing relationships change.
Examples of useful combinations
- Uptrend with strengthening momentum: The trend and acceleration point in the same direction, but price location and nearby resistance still require review.
- Uptrend with weakening momentum: The advance may be losing pace. This can justify closer monitoring rather than an automatic reversal conclusion.
- Downtrend with strengthening downside momentum: Selling pressure may be becoming more forceful, although support and potential reactions remain relevant.
- Range with alternating momentum: Momentum may be reflecting movement between boundaries rather than a durable directional trend.
- New directional move without structural confirmation: Acceleration may be early, but a trader should distinguish an initial impulse from an established trend.
Why market structure changes the interpretation
Market structure provides the framework for deciding where a momentum change is occurring. A strong indicator reading in the middle of a broad range has a different meaning from a similar reading after price breaks and holds beyond a well-defined structural level. The indicator reading may be identical, but the surrounding market conditions are not.
A market structure indicator can help organize observations such as swing highs, swing lows, breaks, retests, and areas where price previously changed direction. These observations do not predict the next move. They help the trader ask whether acceleration is taking place at a meaningful location and whether price behaviour supports the interpretation.
Questions to ask at important levels
- Is momentum increasing as price approaches a prior high, low, or consolidation boundary?
- Did price move beyond the level, or did it only test and reject it?
- After a break, did price hold the new area or return quickly to the previous range?
- Is the momentum reading supported by the higher timeframe?
- Could the move be a reaction inside a larger opposing trend?
These questions help prevent a common mistake: treating a strong reading as more important than the location where it occurs. Momentum has context. A fast move into resistance can behave differently from a fast move away from a confirmed support area, and neither interpretation is certain without additional evidence.
Use multiple timeframes without forcing agreement
Multiple-timeframe analysis can add context to a momentum indicator for TradingView. A higher timeframe may show the prevailing structure, while a lower timeframe may show the latest acceleration or loss of pace. Reviewing both can reduce the risk of interpreting a short-term burst as a complete change in market direction.
Timeframes do not always agree, and that disagreement is itself useful information. For example, short-term momentum may be rising while the higher timeframe remains in a declining structure. Rather than forcing the two readings into a single conclusion, document the condition as a shorter-term recovery within a broader downtrend, unless price provides evidence of a larger structural change.
| Timeframe role | Questions for review | Documentation example |
|---|---|---|
| Higher timeframe | What is the broader structure and where are the major levels? | “Price remains within a broader range.” |
| Working timeframe | Is momentum accelerating in the direction of the broader context? | “Momentum is improving near the upper half of the range.” |
| Lower timeframe | Is the recent move holding, failing, or changing character? | “The initial impulse has not yet produced a sustained break.” |

Document momentum with a repeatable process
A repeatable review process makes it easier to separate observations from assumptions. The following framework can be used when studying a chart in TradingView or recording notes for later review.
- Define the reference period. State which timeframe and recent price behaviour you are examining. Momentum has different meanings on a short intraday chart and a longer-term chart.
- Describe the current price direction. Record whether price is advancing, declining, consolidating, or moving unevenly.
- Record the momentum change. Note whether the indicator is rising, falling, crossing a reference area, making a new extreme, or failing to confirm price movement.
- Mark the nearby structure. Identify relevant swing points, range boundaries, support, resistance, or a possible break and retest.
- Check timeframe alignment. Compare the working chart with the broader context without assuming that disagreement must resolve immediately.
- Write the uncertainty explicitly. State what would support continuation and what would weaken the current interpretation.
- Review the outcome later. Compare the original observation with what happened, while avoiding the assumption that one historical outcome proves a universal rule.
This process turns an indicator into a documentation aid. It also discourages hindsight-based explanations, because the original note records both the observed condition and the unresolved alternatives.
Common mistakes when interpreting momentum
Assuming a high reading means a buy signal
A high momentum reading may show strong recent movement, but it does not identify the trader’s preferred entry location or establish that price has room to move further. The reading should be considered alongside structure, current price location, and the trader’s own risk process.
Treating divergence as a guaranteed reversal
When price reaches a new extreme but momentum does not match it, traders may describe the condition as divergence or reduced confirmation. This can be a warning that the move is losing force. It is not proof that price will reverse. Markets can continue in the same direction while momentum remains uneven.
Ignoring the difference between impulse and continuation
An initial price surge can be meaningful without becoming a sustained trend. Documentation should distinguish the first acceleration from later evidence, such as a successful hold beyond a structural level or a continuation of higher lows. This distinction helps avoid assigning too much significance to one fast candle or one indicator change.
Using too many indicators to replace judgment
Adding more indicators does not automatically create better analysis. Several tools may describe closely related aspects of price movement and create the appearance of confirmation without adding independent information. A simpler chart with clear notes about trend, momentum, structure, and uncertainty may be more useful than a crowded chart.
How a market intelligence indicator can fit into the workflow
VP ALGO TRADING develops and sells TradingView indicators and algorithmic trading tools for traders who want a more structured way to review market conditions. Its AKMelytics – Market Intelligence Indicator is positioned within this type of workflow, where momentum can be considered alongside trend analysis, market structure, institutional activity, and smart money concepts.
The value of a combined view is organization. Instead of treating a momentum reading as an isolated answer, a trader can examine whether different parts of the chart are describing compatible or conflicting conditions. That does not remove the need for interpretation, and it does not turn an indicator into financial advice. It provides information that traders may use as part of their own educational and decision-making process.
What to look for when evaluating an indicator
- Does it make the relevant chart information easier to review?
- Can you explain what each signal or display is intended to represent?
- Does it encourage confirmation through context rather than automatic action?
- Can you record conditions that disagree instead of hiding them?
- Does your process still include risk awareness and independent judgment?
VP ALGO TRADING states that support is available for installation, activation, or usage assistance, and its website offers a request-based seven-day free trial for its indicator and Telegram channel. Traders should review the current product information and access requirements directly before deciding whether the tool fits their workflow.
A practical template for momentum notes
Short, consistent notes can be more useful than a long narrative written after the chart has moved. A template might include the following fields:
- Market and timeframe: Identify what is being reviewed.
- Broader structure: Uptrend, downtrend, range, or unclear.
- Current momentum: Strengthening, weakening, mixed, or unchanged.
- Price location: Near support, resistance, a range boundary, or an unmarked area.
- Confirmation: What price action or structure supports the reading?
- Conflict: What evidence argues against the preferred interpretation?
- Condition to monitor: What future observation would make the analysis stronger or weaker?
The final field is especially important. It keeps the analysis conditional rather than turning an observation into a fixed forecast. A trader can be interested in improving momentum while still acknowledging that continuation depends on what price does next.
Final perspective
A momentum indicator for TradingView is most useful when it documents the changing pace of price movement without pretending to know the future. Strong momentum may support a directional interpretation, but trend, market structure, timeframe context, and price location determine how that reading should be understood.
By recording acceleration, confirmation, conflict, and uncertainty separately, traders can build a clearer review process. Tools such as the AKMelytics – Market Intelligence Indicator may help organize market intelligence across several analytical areas, but the resulting information remains part of a broader decision process rather than a guarantee of continuation or a substitute for financial advice.
Frequently asked questions
What is a momentum indicator for TradingView?
It is a TradingView-based chart tool that helps show changes in the speed or force of price movement. It can help document strengthening or weakening momentum, but it does not guarantee a future direction.
Does strong momentum mean price will continue rising?
No. Strong momentum records recent acceleration. Continuation still depends on factors such as market structure, nearby levels, timeframe context, and what price does after the initial move.
How should momentum be used in stock trend analysis?
Use momentum alongside broader trend direction and market structure. First identify whether price is trending or ranging, then assess whether acceleration supports or conflicts with that context.
What does weakening momentum mean in an uptrend?
It may mean that the pace of the advance is slowing. It does not automatically mean the uptrend has ended. A trader should review structure, support, and subsequent price behaviour before drawing a stronger conclusion.
Why are multiple timeframes useful when reviewing momentum?
They help distinguish a short-term acceleration from a broader directional change. Timeframes may disagree, and that disagreement can be recorded as uncertainty rather than forced into a single signal.
Can a momentum indicator replace market structure analysis?
No. Momentum describes the pace of movement, while structure describes the arrangement of swings and important price areas. Using both provides more context than relying on either one alone.
Is an indicator a form of financial advice?
No. A TradingView indicator provides analytical information. VP ALGO TRADING positions its indicators for educational and trading-decision assistance purposes rather than as financial advice. Traders remain responsible for their own research and decisions.


Recent Comments