
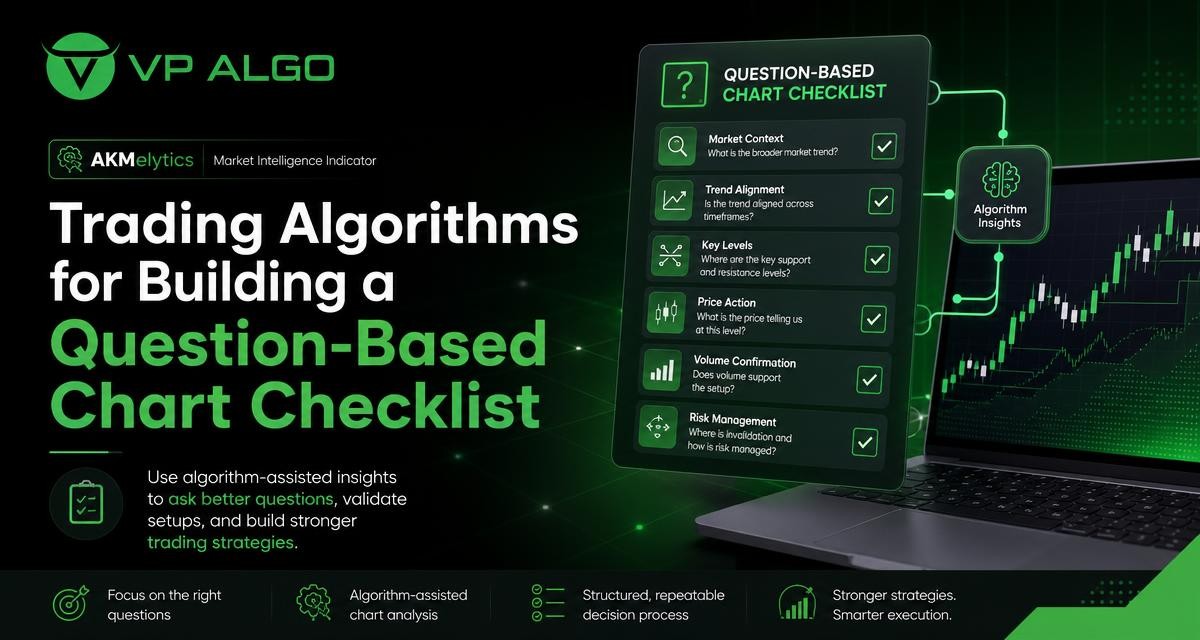
Trading algorithms can help turn a crowded chart into a more structured decision-making process. Instead of treating an indicator as a device that predicts the next price move, traders can use algorithm-assisted tools to ask better questions about trend, momentum, market structure, institutional activity and smart money conditions. This approach creates a chart checklist based on evidence rather than automatic predictions or execution.
Why build a chart checklist around questions?
A chart often contains more information than a trader can process consistently. Price candles, moving averages, momentum readings, support and resistance areas, volume-related observations and multiple timeframes can all compete for attention. Without a clear process, it is easy to focus on the most recent signal and overlook the broader market context.
A question-based checklist provides a repeatable way to review a chart. It does not tell a trader what must happen next. Instead, it prompts the trader to examine whether the conditions behind a possible setup are present, unclear or absent. That distinction matters because a technical indicator is better used as an analytical aid than as a substitute for judgment.
For example, the checklist might begin with a broad question: What is the market currently showing? The following questions can then examine direction, momentum, structure and participation. A trader can record the answers before considering whether a particular trading strategy is appropriate for the situation.
What trading algorithms can contribute
In a charting context, trading algorithms generally process market data according to defined rules and display calculated information through an indicator or other tool. The result may help organize complex observations into visual signals, zones, labels or trend assessments. The value is not that the algorithm knows the future. Its value is that it can apply a consistent analytical framework to the data being reviewed.
Algorithm-assisted tools can be especially useful when a checklist covers several related areas. A market intelligence indicator may bring together trend analysis, momentum evaluation, market structure, institutional activity and smart money concepts. Reviewing these areas together can help a trader distinguish between a single isolated signal and a broader group of observations.
However, the output still needs interpretation. A displayed trend condition does not remove the need to consider timeframe, volatility, market context, risk and the trader’s own rules. The algorithm supports the process; it does not make the decision on the trader’s behalf.
The core questions in a chart checklist
A useful checklist should be short enough to use consistently but detailed enough to prevent impulsive conclusions. The following structure can be adapted to different trading strategies without turning the review into a search for a perfect signal.
1. What is the higher-timeframe direction?
Start with the broader chart rather than the entry timeframe. Ask whether the higher-timeframe market appears to be trending upward, trending downward or moving without a clear directional structure. This first step gives the rest of the analysis a context.
Multi-timeframe trend assessment can be useful here. A shorter timeframe may show a sharp move while the broader chart remains range-bound. Conversely, a temporary pullback on a lower timeframe may occur within a larger directional move. The purpose of this question is not to force every chart into a bullish or bearish label. It is to identify whether the larger context is clear enough to continue the review.
2. Is momentum supporting the current move?
Trend and momentum are related, but they are not identical. Price may continue moving in one direction while momentum weakens. A checklist should therefore ask whether momentum supports the current market behavior, is losing strength or is giving mixed information.
A momentum indicator for TradingView can help make this review more systematic. Rather than treating a momentum reading as a direct buy or sell instruction, compare it with price structure. If price is making a directional move but momentum does not confirm the same strength, the mismatch becomes a question for further analysis. It may suggest caution, consolidation or the need to wait for clearer evidence.
3. What is the market structure?
Market structure describes how price is forming swings, breaks and areas of continuation or rejection. Ask whether the chart is creating higher highs and higher lows, lower highs and lower lows, or a less defined sequence. Also consider whether a recent break has been confirmed by subsequent price behavior or appears to be a short-lived movement.
A market structure indicator can help highlight relevant changes, but the displayed information should be read in relation to the selected timeframe. A structure break on a very short chart may not change the broader market view. The checklist should record the timeframe and the specific price behavior being evaluated rather than relying on a label alone.
4. Is there evidence of meaningful participation?
Another useful question concerns participation. Does the move appear to have enough market activity to deserve attention, or is price drifting through a thin or indecisive area? Depending on the available tool and chart data, a trader may review indications associated with institutional activity, flow or smart money concepts.
These observations should not be interpreted as proof that a particular institution has entered or that a future move is guaranteed. They are part of the market context. An institutional flow indicator or smart money indicator may organize signals related to participation, but the trader still needs to examine how those signals relate to price, structure and timeframe.
5. Are the conditions aligned or conflicting?
After reviewing trend, momentum, structure and participation, ask whether the evidence is broadly aligned. Alignment does not mean every indicator must show the same message. It means the main observations are not contradicting one another in a way that makes the setup difficult to explain.
For instance, a higher-timeframe trend may be upward while lower-timeframe momentum is temporarily weak. That is not automatically a contradiction; it may simply describe a pullback. In contrast, an unclear higher-timeframe structure, weakening momentum and conflicting flow readings may justify treating the chart as uncertain. A good checklist makes room for a “not clear” answer.
6. What would invalidate the current interpretation?
Many chart reviews focus only on evidence that supports a preferred idea. A better process asks what would challenge it. This may involve a failure to hold a structural level, a change in the higher-timeframe trend, a loss of momentum or a new conflict between the indicator and price action.
Writing this question into the checklist encourages conditional thinking. Instead of assuming that a signal must work, the trader identifies what would show that the original interpretation needs to be reconsidered. This is useful for both discretionary analysis and rule-based trading strategies.
A practical question-based checklist
The checklist below can be used as a starting framework. It is not a trading signal and should be adapted to the trader’s own method, timeframe and risk controls.
| Area | Question to ask | Possible observation |
|---|---|---|
| Higher-timeframe trend | What is the broader directional condition? | Upward, downward, range-bound or unclear |
| Momentum | Does momentum support the current price movement? | Confirming, weakening, reversing or mixed |
| Market structure | What pattern of swings and breaks is visible? | Continuation, transition, range or unconfirmed break |
| Participation | Is there evidence that the move has meaningful activity behind it? | Supported, limited, conflicting or unclear |
| Timeframe alignment | Do the reviewed timeframes tell a compatible story? | Aligned, transitional or conflicting |
| Invalidation | What would challenge the current interpretation? | Defined price or structure condition |
| Decision quality | Is there enough evidence to continue, wait or stand aside? | Review further, wait for clarity or no setup |
The final answer does not have to be “buy” or “sell.” In many situations, “wait” or “no clear setup” is the most accurate answer available from the chart. Including those options helps prevent the checklist from becoming a mechanism that pushes the trader into a position.

How an indicator can support each question
Trend analysis
A trend-focused display can provide a consistent starting point for reviewing direction across one or more timeframes. The trader can compare that display with visible price swings and ask whether the trend assessment is supported by the chart. If the tool and price appear to disagree, that disagreement should be investigated rather than ignored.
Momentum evaluation
Momentum-related calculations can help identify whether a move is gaining strength, losing strength or behaving unevenly. They are most useful when treated as one layer of evidence. A momentum reading should be considered alongside structure and price behavior, not used in isolation.
Market structure analysis
Structure-related features may help draw attention to possible breaks, swing relationships and transitions. This can reduce the chance of overlooking a relevant change during a busy chart review. Even so, the trader should verify the timeframe and examine whether the apparent break has follow-through.
Smart money and institutional activity concepts
Smart money concepts and institutional activity features can add another perspective to the checklist. They may help a trader ask where participation appears to be concentrated and whether price behavior is consistent with the displayed context. These concepts are not a guarantee of institutional intent, and they should not be presented as certainty about what large market participants will do next.
Using AKMelytics without turning it into an automatic decision-maker
AKMelytics – Market Intelligence Indicator can be considered within this question-based workflow as a TradingView indicator intended to support market evaluation. The appropriate use is to review its available analytical information alongside the chart and then document the reasoning behind the interpretation.
A practical review might begin by checking the broader trend, then examining momentum and market structure before considering smart money or institutional activity observations. The trader can mark each answer as confirmed, uncertain or conflicting. This creates a record of the analysis without assuming that the indicator has predicted the next price movement.
The same principle applies to any trading algorithms or technical tools. An indicator can help organize information, but it cannot know a trader’s financial circumstances, risk tolerance or complete trading plan. It also cannot remove uncertainty from markets. Those limits should remain visible in the workflow.
Common mistakes when using algorithm-assisted checklists
Treating every signal as a command
A signal may identify a condition worth examining, not an instruction to enter a trade. When every label is treated as a command, the checklist loses its analytical purpose. Use the signal to open a question and then review the surrounding context.
Ignoring conflicting evidence
Traders may give more weight to the indicator output that confirms an existing opinion. A disciplined checklist records both supporting and conflicting observations. If the evidence does not align, the correct response may be to wait for additional clarity.
Mixing timeframes without a defined role
A higher timeframe and an entry timeframe answer different questions. Problems arise when a short-term movement is used to describe the entire market or when a broad trend is treated as a precise entry signal. Define what each timeframe is meant to show before using it in the checklist.
Adding too many conditions
A checklist with dozens of conditions can become difficult to complete and may encourage selective use. Start with a small number of meaningful questions covering trend, momentum, structure, participation and invalidation. Add another condition only when it solves a specific analytical problem.
Confusing historical behavior with future certainty
Charts and indicators describe available market data and calculated conditions. They do not guarantee that the next move will resemble a previous one. Past observations can inform a process, but they should not be presented as proof of future results.
How to make the checklist part of a consistent routine
Consistency improves when the checklist is used at the same stages of the trading process. For example, a trader might complete one review before studying a possible setup and another review before taking any action. The exact routine depends on the trader’s method, but the questions should remain stable enough to make comparisons meaningful.
It can also help to keep a short journal containing the date, timeframe, checklist answers and the reason for waiting or proceeding. The purpose is not to create a record of perfect predictions. It is to identify whether decisions followed the stated process and whether some questions repeatedly create confusion.
- Write the market context before focusing on a possible entry.
- Record uncertainty instead of forcing a definitive interpretation.
- Separate observations from assumptions about what price will do.
- Define invalidation before becoming attached to an idea.
- Review the process regularly and remove questions that do not improve clarity.
Trading algorithms should support judgment, not replace it
The strongest role for trading algorithms in a question-based chart checklist is organizational. They can help traders review recurring categories of information in a more consistent way and draw attention to relationships that may otherwise be missed. They are not a replacement for a trading plan, risk management or personal responsibility.
For traders using TradingView, an indicator such as AKMelytics – Market Intelligence Indicator may fit into a workflow that examines trend, momentum, market structure, institutional activity and smart money conditions. The key is to keep the questions in control. Instead of asking, “What trade does this indicator give me?” ask, “What does the chart show, what remains uncertain and what would change my interpretation?”
This approach creates a more measured foundation for evaluating trading strategies. It also leaves room for the most important decision a checklist can support: choosing not to act when the evidence is incomplete or conflicting. VP ALGO TRADING positions its tools for educational and trading-decision assistance purposes, not as financial advice. Any trading decision should be made according to the trader’s own plan and risk considerations.
Frequently asked questions
What are trading algorithms used for in chart analysis?
Trading algorithms can process market data according to defined rules and present calculated information through an indicator. In chart analysis, they can help organize observations about trend, momentum, structure and other market conditions. They do not guarantee a future price movement.
Can a question-based checklist predict the market?
No. A question-based checklist is designed to improve the consistency of analysis, not to predict the market with certainty. It helps the trader review evidence, identify conflicts and define what would invalidate an interpretation.
How should a smart money indicator be used?
A smart money indicator should be treated as one source of market context. Review its information alongside price action, timeframe, momentum and market structure rather than treating it as proof of institutional intent or as an automatic trade instruction.
Why include “wait” as a checklist answer?
Market conditions are not always clear. Including “wait” or “no setup” prevents the checklist from forcing a decision when the evidence is mixed, the structure is unclear or the relevant conditions have not aligned.
Can trading algorithms replace a trading plan?
No. An algorithm-assisted tool can support analysis, but it does not define a trader’s goals, risk limits, position management rules or personal circumstances. Those elements remain the responsibility of the trader.
What should I check before relying on a TradingView indicator?
Understand what the indicator is designed to display, which timeframe is being reviewed and how its information fits into your process. Compare the output with price and structure, record conflicting evidence and avoid assuming that any indicator can eliminate trading losses or uncertainty.


Recent Comments