
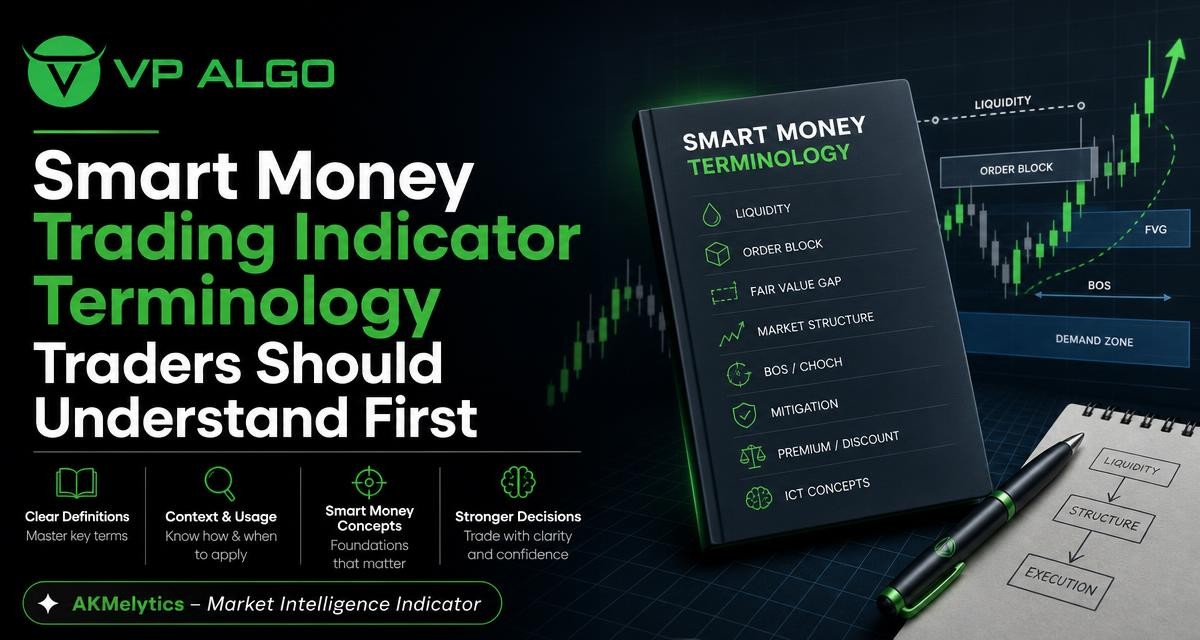
A smart money trading indicator can display several types of market information at once, but its labels are not always easy to interpret. Terms such as break of structure, liquidity sweep, order block, fair value gap, momentum and institutional flow each describe a different part of market analysis. Learning what these terms mean first can help traders read chart features more carefully and evaluate whether an indicator fits their process.
Why terminology matters in smart money analysis
Smart money concepts are a way of organising observations about price movement, market structure, liquidity and areas where buying or selling interest may have influenced the chart. The terminology does not provide a guarantee about what price will do next. Instead, it gives traders a shared language for describing possible changes in trend, areas of interest and reactions around important price levels.
This distinction is especially useful when reviewing a TradingView indicator. A chart label may highlight a structural event, a momentum change or a potential zone, but the label still needs to be interpreted in context. Timeframe, volatility, recent price action and the trader’s own risk process can all affect how useful a feature is.
The core terms behind a smart money trading indicator
Market structure
Market structure describes the way price forms swings and develops a sequence of highs and lows. Traders may use the terms higher high, higher low, lower high and lower low to describe these sequences. A series of higher highs and higher lows is commonly viewed as an upward structure, while lower highs and lower lows suggest downward structure.
Market structure is not simply a label for the latest candle. It is an attempt to place individual price movements inside a wider sequence. The lookback period and timeframe matter because a chart can show an upward structure on one timeframe and a downward structure on another.
Swing high and swing low
A swing high is a local price peak relative to nearby price action. A swing low is a local trough. These points help traders identify the turning points used to describe structure. Some indicators mark them automatically, although the exact definition may depend on the indicator’s settings and calculation method.
Not every temporary peak or trough has equal significance. A minor swing inside a narrow range may be less meaningful than a major swing that preceded a strong move. This is why traders should understand how an indicator identifies swings rather than assuming every marked point represents a major structural level.
Break of structure
A break of structure, often abbreviated as BOS, refers to price moving beyond a prior swing point in the direction of an existing structural sequence. For example, price breaking above a relevant prior high may be described as a bullish break of structure, while a move below a prior low may be described as bearish.
The practical question is not only whether a level was crossed. Traders may also consider whether the move closed beyond the level, whether momentum supported the move and whether price quickly returned inside the previous range. Different smart money tools can use different rules for confirming a break, so the indicator’s documentation and settings remain important.
Change of character
A change of character, or CHoCH, is generally used to describe a possible shift in the behaviour of price. It may occur when price breaks a swing point that supported the previous directional sequence. For instance, a market making higher highs and higher lows may show a possible change of character after breaking below a relevant higher low.
CHoCH is best treated as an observation of a potential transition, not proof that a new trend has already formed. Confirmation may require subsequent structure, sustained momentum or a clear reaction at a relevant area. The meaning can also vary between methodologies, so traders should avoid treating the abbreviation as a universal signal.
Liquidity and price reaction terminology
Liquidity
In smart money concepts, liquidity commonly refers to areas where orders may be concentrated. These areas can develop around visible highs, lows, equal highs, equal lows, range boundaries or other widely watched chart levels. The term is used to describe potential order concentration rather than a guarantee that a particular level will be reached.
Liquidity can help explain why traders pay attention to obvious swing points. If price approaches a visible high or low, market participants may watch for either a continuation through that level or a rejection after a brief move beyond it. The chart context determines which interpretation is more reasonable.
Liquidity sweep
A liquidity sweep describes a move beyond a prior high or low that is followed by a reaction back toward the earlier range. Some traders use the term when price briefly trades through an obvious level and then closes back inside it. Others use it more broadly for a move that interacts with a liquidity area before reversing or consolidating.
A sweep should not automatically be interpreted as a reversal. Price can move beyond a high or low and continue in the same direction. When an indicator marks a sweep, traders can examine the following candles, the broader structure and the strength of the reaction instead of relying on the label alone.
Equal highs and equal lows
Equal highs and equal lows are two or more nearby swing points that appear at approximately the same price. They are often watched because repeated highs or lows can become visible reference levels. An indicator may mark these areas as potential liquidity zones.
Exact equality is uncommon in live price data, so many tools use a tolerance rather than requiring identical prices. This is one reason why settings can affect the number and location of labels on a chart.
Inducement
Inducement is a term used by some smart money methodologies for a price movement that appears to encourage participation before price moves toward another area of interest. The term is interpretive and can be defined differently by different educators and indicator developers.
Because inducement is not a universally standardised calculation, traders should ask how the feature is defined before using it. A label should be considered part of a framework for reading price action, not evidence of a confirmed intention by a particular market participant.
Order blocks and imbalance terms
Order block
An order block is commonly described as a price area associated with the candles or consolidation that preceded a notable directional move. Bullish and bearish order blocks are usually identified according to the direction of the subsequent move and the methodology being used.
Order blocks are zones, not necessarily precise single-price levels. Traders may watch how price behaves when it returns to the area, but a reaction is not guaranteed. The quality of an order block may be assessed alongside structure, momentum, timeframe and whether the zone has already been revisited.
Breaker block
A breaker block generally refers to an order-block area that failed or was breached and later takes on a different role in a market-structure interpretation. For example, an area that previously acted as support may be viewed as potential resistance after a decisive move below it.
This terminology highlights the importance of context. A zone does not remain valid simply because it was marked earlier. Traders should consider whether price invalidated the original idea and how subsequent candles behaved around the area.
Fair value gap
A fair value gap, or FVG, is commonly used to describe an imbalance in a three-candle price sequence where the middle candle moves strongly and the surrounding candles leave a gap between part of their ranges. Traders may watch whether price later retraces into that area.
An FVG is not the same as a guaranteed destination for price. Some gaps may be revisited, while others may remain open or become less relevant as new structure develops. The timeframe and volatility of the chart can change how visually significant an imbalance appears.
Imbalance
Imbalance is a broader term for a part of the chart where buying and selling activity appears uneven, often reflected by a fast directional move. Fair value gaps are one way traders describe imbalance, but the terms are not always used identically.
When an indicator highlights an imbalance, it can be useful to determine whether the feature is based on candle ranges, gaps, displacement or another rule. Knowing the calculation prevents traders from treating different tools as if they produced identical information.

Trend, momentum and institutional activity
Trend analysis
Trend analysis evaluates the general direction and organisation of price movement. It may include swing sequences, moving relationships between price points or other calculations. A trend feature on a smart money trading indicator is intended to help place individual signals in a broader directional context.
Trend does not mean that price moves in a straight line. Pullbacks, consolidations and temporary breaks can occur within a broader directional phase. Traders should also remember that a trend reading on a short timeframe may conflict with the structure visible on a higher timeframe.
Momentum
Momentum refers to the strength or speed of price movement. Momentum analysis may look at the size and sequence of candles, the rate of change or calculations derived from price data. A momentum feature can help traders distinguish between a slow drift and a more forceful move, although it cannot determine the future with certainty.
Momentum and trend are related but not identical. Price can remain in an upward trend while short-term momentum weakens during a pullback. Conversely, momentum can increase during a short move without creating a lasting change in the broader trend.
Institutional activity and flow
Institutional activity and institutional flow are terms used to describe attempts to interpret larger-scale participation or directional pressure in a market. On a chart, such features may be represented through structure, volume-related information or algorithmic calculations, depending on the tool.
These terms should be read carefully. A chart indicator cannot establish the identity or intention of every market participant from a label alone. An institutional flow indicator is better understood as an analytical aid that organises possible evidence of participation and pressure, rather than a direct report from an institution.
Multi-timeframe analysis
Multi-timeframe analysis means reviewing price information across more than one chart timeframe. A trader may use a higher timeframe to understand broader structure and a lower timeframe to study more detailed movement. The purpose is to reduce the risk of interpreting a small chart pattern without considering the larger context.
Timeframes can disagree without one of them being technically wrong. A lower-timeframe bearish move may simply be a pullback within a higher-timeframe bullish structure. When an indicator includes multi-timeframe trend assessment, traders should identify which timeframe each reading represents before making comparisons.
How these terms fit together on a chart
The terminology becomes more useful when the concepts are connected rather than viewed as isolated labels. A trader might first review higher-timeframe trend and market structure, then identify important swing highs, swing lows and possible liquidity areas. Next, the trader could examine whether price created a break of structure, a change of character, an order block or an imbalance.
Momentum can then provide additional context about the quality of the move, while multi-timeframe analysis can show whether the setup agrees with or conflicts with the broader chart. This does not create a guaranteed outcome. It creates a more organised checklist for evaluating what price has already done and what conditions are present.
| Term | What it describes | Useful question to ask |
|---|---|---|
| Market structure | The sequence of highs, lows and directional swings | Is price forming a consistent structural sequence? |
| Break of structure | A move beyond a relevant prior swing point | Was the break confirmed, or did price quickly return? |
| Liquidity | Potential areas where orders may be concentrated | Which visible highs, lows or range boundaries are nearby? |
| Order block | A zone associated with a prior directional move | How did price react when it returned to the zone? |
| Fair value gap | A possible imbalance in a three-candle sequence | Is the gap still relevant within the current structure? |
| Momentum | The strength or speed of a price move | Does momentum support the current structural reading? |
How to evaluate smart money indicator features
Start with definitions, not labels
Before using a feature, find out exactly what the indicator means by the term. “Break of structure” may require a candle close beyond a swing, while another tool may mark an intrabar breach. “Order block” may be based on a particular candle sequence or a broader consolidation zone. These differences can produce different chart results.
Check whether the feature updates
Some chart features can change as new candles form or as a swing becomes more clearly defined. This is not necessarily a flaw, but traders should know whether a label is provisional or confirmed according to the tool’s rules. Understanding how the indicator behaves in real time helps prevent confusion when reviewing historical charts.
Separate observation from decision-making
An indicator can organise information about trend, momentum, structure and possible zones. It does not replace a trading plan or remove the need to assess position size, invalidation conditions and risk. A sensible review asks what the chart shows, what would challenge the interpretation and whether the setup fits the trader’s own rules.
Test the terminology on different chart conditions
Review examples that include trends, ranges, sharp reversals and quieter consolidations. A feature that looks clear during a strong directional move may be more difficult to interpret in a sideways market. Testing different conditions can reveal whether the terminology remains useful or creates too many competing labels.
Using a TradingView indicator responsibly
VP ALGO TRADING develops TradingView indicators and algorithmic trading tools intended to help traders evaluate market conditions and potential setups. Its smart money-related indicator offering brings together areas such as trend analysis, momentum evaluation, market structure, institutional activity, multi-timeframe assessment and smart money concepts.
That combination can provide a structured way to study a chart, but the terminology still needs to be understood on its own terms. The indicator should be treated as an educational and trading-decision assistance tool, not as financial advice or a promise of profitable results. Traders remain responsible for interpreting the information and managing their own decisions.
A practical terminology checklist
- Identify the timeframe used for each structure, trend or momentum reading.
- Check how the indicator defines swing highs, swing lows and structural breaks.
- Distinguish a possible liquidity sweep from a confirmed continuation or reversal.
- Review whether an order block or fair value gap has already been revisited.
- Use momentum as context rather than treating it as a guaranteed direction.
- Compare lower-timeframe observations with the broader market structure.
- Record the reason for an interpretation instead of relying only on a coloured label.
- Use a defined risk process and avoid assuming that any indicator eliminates losses.
Final perspective
Smart money concepts become easier to assess once the terminology is separated into clear categories. Market structure describes the sequence of price swings. Liquidity terms identify areas that may attract attention. Order blocks and fair value gaps describe zones or imbalances. Trend, momentum and multi-timeframe analysis add context, while institutional activity language represents an attempt to interpret broader participation.
A smart money trading indicator can make these concepts easier to display on a TradingView chart, but a label is only the beginning of analysis. The most useful approach is to understand the calculation behind each feature, compare it with surrounding price action and apply it within a consistent, risk-aware process.
Frequently asked questions
What is a smart money trading indicator?
A smart money trading indicator is a chart-based tool that organises information related to market structure, liquidity, trend, momentum, institutional activity or other smart money concepts. Its exact features and calculations depend on the indicator.
Are smart money concepts the same as market structure?
No. Market structure is one part of smart money concepts. Smart money analysis may also include liquidity, order blocks, fair value gaps, momentum and multi-timeframe context.
What does a break of structure mean?
A break of structure generally means that price has moved beyond a relevant prior swing high or swing low. Traders should check how the indicator confirms the break and whether price sustains the move.
Is an order block a guaranteed support or resistance zone?
No. An order block is an area identified by a particular methodology and may produce different reactions in different conditions. It should be assessed alongside structure, momentum and risk rules.
What is the difference between a liquidity sweep and a market reversal?
A liquidity sweep describes an interaction with a visible high or low, often followed by a move back toward the prior range. It does not automatically confirm a lasting reversal.
Why does timeframe matter when reading a smart money indicator?
Different timeframes can show different structures and momentum conditions. A short-term move may be a pullback within a broader trend, so the timeframe behind each indicator reading should be identified.
Can a smart money trading indicator guarantee profitable trades?
No. Indicators provide analytical information and do not guarantee profits or eliminate trading losses. Traders need their own process for interpretation, risk management and decision-making.


Recent Comments