
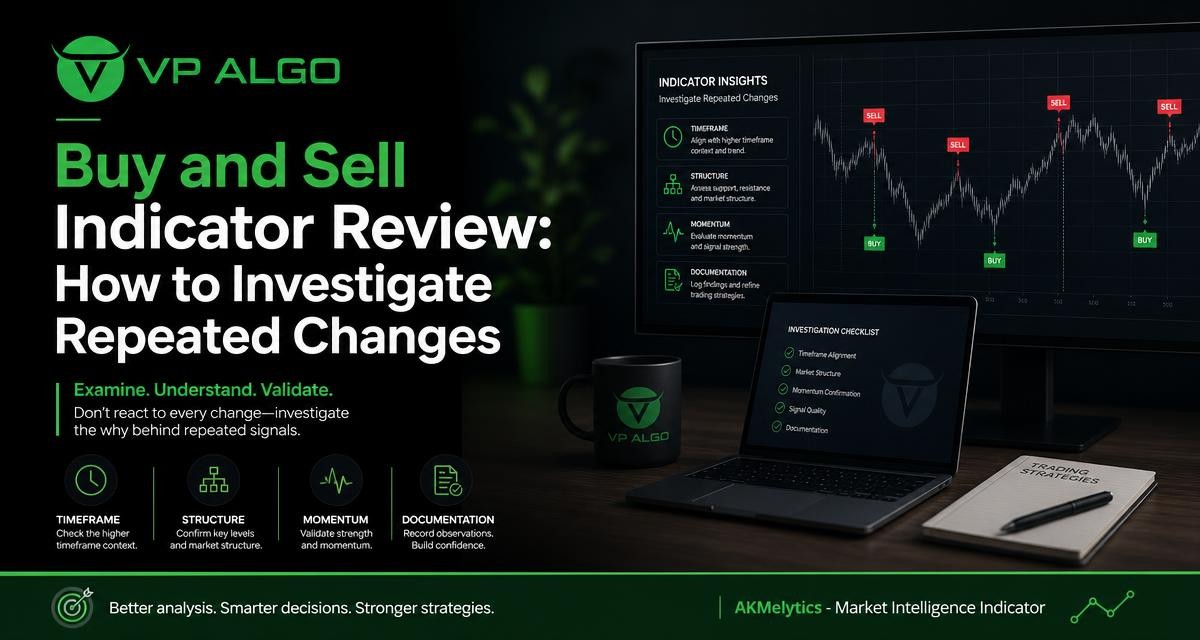
Searching for the Best trading indicator buy and sell signals can lead to an understandable but risky question: why does the indication keep changing? A buy or sell indication is not necessarily a permanent instruction. It may reflect a developing market, a different chart timeframe, changing momentum or a condition that has not yet been confirmed. A useful review therefore investigates the reason for each change instead of treating every new indication as a separate trading decision.
Why buy and sell indications can change
Markets do not move in a straight line. Price can rise briefly, lose momentum, form a lower high and then recover. During that process, an indicator may move between bullish, bearish and neutral conditions. This does not automatically mean the indicator is defective. It may be responding to new price information as the market develops.
The way an indication is calculated also matters. Some tools evaluate trend direction, while others focus on momentum, market structure, volume-related activity or a combination of conditions. A signal based on one completed candle may not have the same meaning as a broader indication based on several candles or multiple timeframes.
| Possible reason for a change | What to investigate | Useful question |
|---|---|---|
| Timeframe difference | Compare the indication across chart intervals | Is the lower timeframe moving against the broader trend? |
| Developing candle | Check whether the candle has closed | Did the indication change before confirmation? |
| Weak momentum | Review recent price movement and momentum conditions | Is price advancing with enough follow-through? |
| Changing market structure | Examine highs, lows, breaks and reversals | Has the market formed a meaningful structural change? |
| Unclear documentation | Read the indicator’s instructions and definitions | What exactly does buy or sell mean in this tool? |
Start with the timeframe
Timeframe is one of the first factors to examine when an indication appears inconsistent. A short chart interval can show temporary selling inside a broader upward movement. The same price action may look bullish on a higher timeframe and bearish on a lower one. Both observations can be valid because they describe different parts of the market.
Before judging a TradingView indicator, record the chart interval used when the indication appeared. Then compare it with the interval used when the indication changed. If the chart was switched from a higher timeframe to a lower one, the change may reflect a different analytical context rather than a contradiction.
Use a consistent review process
A practical review begins by selecting a timeframe that fits the trading plan. The purpose is not to find one interval that always produces a preferred indication. It is to avoid moving between intervals simply because one of them displays a more attractive result.
- Record the primary timeframe before reviewing the chart.
- Check whether a higher timeframe supports or conflicts with the current indication.
- Note whether the market is trending, ranging or transitioning.
- Use the same timeframe rules when reviewing different examples.
For traders who use multi-timeframe analysis, the role of each interval should be defined in advance. For example, one timeframe may provide broader context while another is used to study a setup. This structure helps prevent every lower-timeframe change from being treated as a complete change in market direction.
Check whether the indication changed before candle close
Price can move considerably while a candle is still forming. An indicator that responds to current price data may also change during that period. When the candle closes, the final data may support the original indication, a revised indication or no clear indication at all.
This is why a review should distinguish between an indication that appeared during a live candle and one that remained after the candle closed. The distinction is especially important when investigating repeated changes. Without it, a trader may count temporary intrabar movements as several confirmed reversals.
Questions to ask about confirmation
- Did the indication appear before or after the candle closed?
- Does the product documentation explain how confirmation works?
- Is a change displayed as a new signal, a status update or a warning?
- Does the indication require additional market conditions before it becomes actionable?
These questions do not prove that one type of tool is better than another. They simply clarify what the chart is showing. A buy and sell indicator should be reviewed according to its documented logic rather than by assuming that every visual change has the same importance.
Examine market structure before reading the signal in isolation
Market structure provides context for an indication. It involves observing how price forms highs, lows, breaks and potential reversals. A single bullish indication may carry a different meaning when price is making higher highs than when it appears below a clearly established resistance area.
When a signal changes repeatedly, examine whether the underlying structure is also unstable. A market moving sideways may produce alternating indications because neither buyers nor sellers have established sustained control. In that environment, the repeated changes may be a description of uncertainty rather than a sequence of strong directional opportunities.
Structure-based review checklist
- Identify the recent swing highs and swing lows.
- Check whether price is making a sequence of higher highs and higher lows, lower highs and lower lows, or neither.
- Look for a meaningful break of a previous level rather than reacting to every small movement.
- Consider whether the indication agrees with the broader structure.
- Record what happened after the indication without assuming that the result will repeat.
A market structure indicator can help organize this review, but the displayed information still needs interpretation. The objective is to understand the relationship between the indication and price behavior, not to replace analysis with a label.
Review momentum separately from direction
Direction and momentum are related but not identical. Price can remain above a previous level while its upward momentum weakens. It can also move sharply after a period of weakness. If a tool considers momentum as part of its analysis, changing momentum may help explain why the displayed indication changes even when the general trend appears unchanged.
Look at the quality of recent movement. Has price continued in the same direction, or has each move been quickly retraced? Are candles expanding, contracting or alternating? Is the market producing follow-through after a break? These observations can provide context for a changing momentum indication without turning it into a guaranteed forecast.
Do not confuse movement with confirmation
A fast price movement can attract attention, but speed alone does not establish a durable trend. Similarly, a brief pullback does not always invalidate a broader directional condition. A careful review considers momentum alongside structure and timeframe rather than allowing one component to dominate every decision.
Traders comparing trading strategies can use the same principle. A strategy that depends on momentum should define what counts as sufficient momentum and what would invalidate the idea. The rules should be written before reviewing multiple historical examples, otherwise the interpretation may change to fit each chart.

Understand what the indicator actually measures
The phrase “buy and sell indicator” can describe very different tools. Some indicators present trend information. Others emphasize momentum, market structure, institutional activity or smart money concepts. A label on the chart does not explain the complete calculation or the intended use.
When reviewing AKMelytics – Market Intelligence Indicator from VP ALGO TRADING, begin with the available product documentation and support instructions. Clarify the meaning of each indication, the conditions that can change it and whether a displayed item is intended as context, confirmation or a possible setup. If a definition is unclear, ask support rather than filling the gap with assumptions.
| Documentation area | Why it matters |
|---|---|
| Signal definitions | Explains what buy, sell, bullish, bearish or neutral labels mean. |
| Timeframe behavior | Shows whether indications are intended for one interval or broader analysis. |
| Confirmation rules | Clarifies whether traders should wait for a candle close or another condition. |
| Feature descriptions | Separates trend, momentum, structure and other analytical components. |
| Installation and access guidance | Helps users configure and use the indicator as intended. |
VP ALGO TRADING develops and sells indicators and algorithmic trading tools for TradingView. The company provides support for installation, activation and usage assistance, and its website offers a request-based seven-day free trial for its indicator and Telegram channel. Availability and conditions should be confirmed directly with the company rather than assumed from general reviews.
Separate an indication from a trading decision
An indication is one input in a decision process. It does not, by itself, establish position size, risk tolerance, timing, exit rules or whether a trade fits a trader’s plan. Treating every change as an immediate instruction can lead to overtrading, especially in a sideways or rapidly changing market.
A more disciplined process asks what the indication adds to the analysis. Does it confirm the structure already visible on the chart? Does it provide a different perspective on momentum? Does it conflict with the higher timeframe? If the answer is unclear, waiting for more information may be more useful than reacting immediately.
A simple review worksheet
- Date and chart timeframe
- Market condition: trending, ranging or transitioning
- Current market structure
- Momentum observation
- Indication shown before candle close
- Indication shown after candle close
- Reason for changing status, if documented
- What happened afterward
This worksheet is for studying consistency and interpretation. It should not be used to claim that a past indication predicts future results. Historical observations can show how a tool behaved in a particular sample, but they cannot guarantee what it will display or how markets will move later.
Common mistakes when reviewing repeated changes
Changing the timeframe until the chart agrees
Looking for agreement by repeatedly switching intervals can create a misleading impression of confirmation. Define the role of each timeframe before reviewing the indication and apply the same process to both favorable and unfavorable examples.
Reacting to every color or label change
Visual changes may represent developing conditions, not completed reversals. Read the documentation, check candle status and determine whether the change has a defined confirmation requirement.
Ignoring sideways conditions
Many directional tools become harder to interpret when price lacks a clear trend. If structure is alternating and momentum is weak, repeated changes may be a sign to reduce confidence in directional conclusions rather than a reason to take more actions.
Judging an indicator from one chart
One example cannot establish how an indicator behaves across different conditions. Review a range of examples using consistent rules, and record uncertainty rather than removing examples that do not fit an expectation.
How to compare indicators responsibly
The best trading indicator is not necessarily the one with the most labels or the most visually confident presentation. A useful comparison considers clarity, documentation, timeframe behavior and how well the tool fits an existing analytical process.
When comparing free indicators, paid indicators or different trading algorithms, avoid focusing only on whether a historical label was followed by a favorable move. Ask whether the rules are understandable, whether the tool provides information that is genuinely useful and whether the trader can apply it consistently. Product access, features and support should be verified from the provider’s current information.
| Comparison criterion | What to look for |
|---|---|
| Clarity | Can the displayed information be understood without guessing? |
| Context | Does the tool help assess trend, momentum or structure? |
| Consistency | Can the same review method be used across examples? |
| Documentation | Are the indications and limitations explained? |
| Practical fit | Does it suit the trader’s timeframe and decision process? |
Final perspective
Repeated changes in a buy and sell indication deserve investigation, not automatic rejection or automatic action. Start with timeframe and candle confirmation, then examine market structure, momentum and the product’s documentation. This approach turns a confusing sequence of labels into a more structured review of changing market conditions.
AKMelytics – Market Intelligence Indicator is an offering from VP ALGO TRADING for TradingView users who want an organized way to study market information. Like any trading indicator, it should be understood through its documented features and used as part of an educational analysis process rather than treated as financial advice or a promise of trading results.
Frequently asked questions
Why does a buy and sell indicator keep changing?
It may be responding to changing price, momentum, market structure, timeframe or an unfinished candle. The product documentation should explain the conditions that can change an indication.
Should I act whenever a buy indication appears?
No. An indication is an analytical input, not a complete trading plan. Review timeframe, structure, momentum, confirmation and your own risk rules before making a decision.
Does a lower timeframe conflict with a higher timeframe?
It can show a different market condition rather than a direct contradiction. A short-term pullback may occur inside a broader trend, so the role of each timeframe should be defined in advance.
How can I tell whether a signal was confirmed?
Check whether it appeared before or after the candle closed and consult the indicator’s instructions. Some tools may use different confirmation rules, so assumptions can be misleading.
What should I review when market structure is unclear?
Study recent highs, lows, breaks and reversals. If price is moving sideways without a consistent sequence, treat repeated directional indications cautiously.
Is AKMelytics – Market Intelligence Indicator financial advice?
No. VP ALGO TRADING positions its indicators as tools for educational and trading-decision assistance, not as financial advice or a guarantee of results.
Where can I get help with the indicator?
VP ALGO TRADING provides instructions for providing a TradingView ID after purchase and offers support for installation, activation and usage assistance. Contact the company for current product information and access details.


Recent Comments