
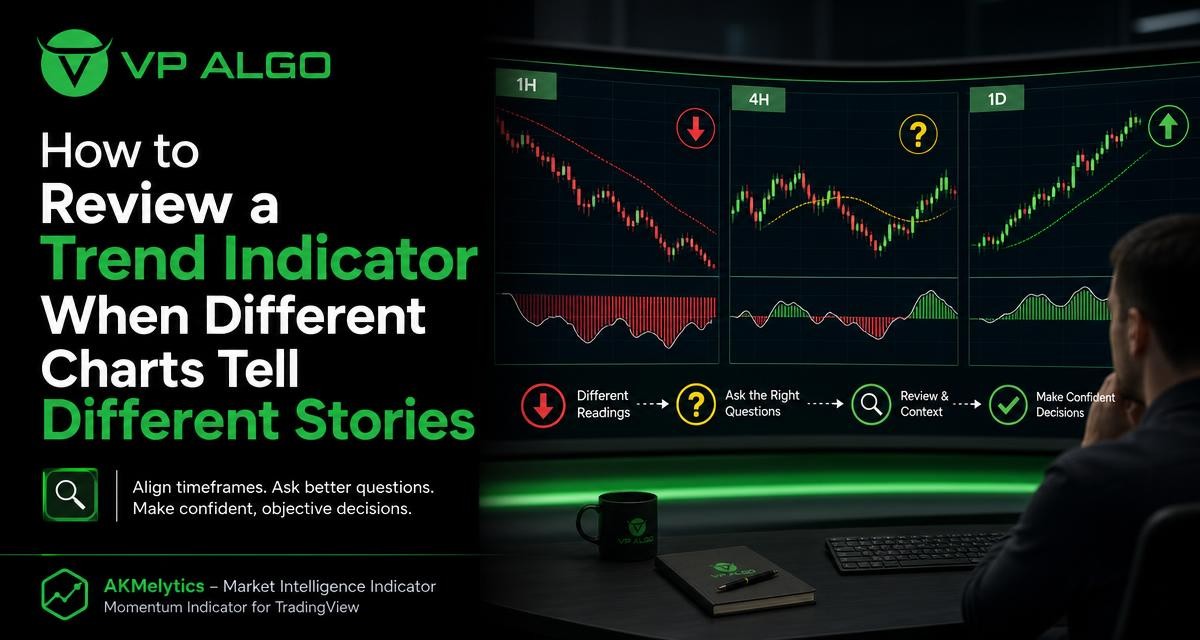
A trend indicator for TradingView can show different directional readings on different charts, and that is not necessarily an error. A shorter timeframe may be reacting to a pullback while a higher timeframe still reflects a broader uptrend. The useful response is not to search immediately for a single correct signal, but to document what each timeframe is saying, identify why the readings differ, and decide which questions require further review.
Why different timeframes produce different readings
Every chart timeframe describes price movement at a different level of detail. A five-minute chart contains short-term fluctuations that may be hidden inside one candle on a daily chart. As a result, an indicator can register weakening momentum, a bearish crossover, or a short-term downtrend while the daily structure remains constructive.
This difference is a normal consequence of how indicators process price data. A calculation based on recent candles responds more quickly on a lower timeframe. A higher timeframe generally changes more slowly because each candle represents a larger period and includes more price information. Neither reading automatically cancels out the other.
| Timeframe role | Question it can help investigate | Common limitation |
|---|---|---|
| Higher timeframe | What is the broader directional context? | It may react slowly to a new reversal. |
| Intermediate timeframe | Is the current move developing in line with the broader context? | It can remain unclear during consolidation. |
| Lower timeframe | What is happening with recent momentum and short-term structure? | It is more vulnerable to noise and temporary swings. |
Before reviewing a disagreement, define the role of each chart. A higher timeframe might be used for context, an intermediate chart for setup development, and a lower timeframe for examining recent price behaviour. The exact timeframes depend on the trader’s method, but the principle remains the same: each chart should answer a different question rather than compete to provide one universal answer.
Start with a written timeframe record
When readings conflict, memory can make the situation appear more confusing than it is. A simple written record creates a neutral snapshot. Note the chart timeframe, the indicator reading, the recent price structure, and what has changed since the previous review.
Use descriptive language instead of immediately labelling a chart as a buy or sell condition. For example, record that the higher timeframe shows an established series of higher swing points, while the lower timeframe shows declining momentum and a break below a recent local low. This description preserves the evidence without turning one signal into a conclusion.
What to record for each chart
- Timeframe: Write down the chart interval and the date or session being reviewed.
- Directional reading: Record whether the indicator appears bullish, bearish, neutral, or in transition.
- Strength or momentum: Note whether movement is accelerating, slowing, or moving sideways if the tool provides that information.
- Price structure: Describe recent highs, lows, breaks, ranges, or consolidation without assuming what will happen next.
- Recent change: State whether the reading is new or has remained consistent across several candles.
- Unanswered question: Identify what would need to occur before the interpretation becomes clearer.
This process is useful whether the chart contains a basic trend tool or a broader market intelligence indicator. A TradingView indicator may combine trend analysis with momentum, market structure, institutional activity, or smart money concepts, but the review still benefits from separating each observation and examining its timeframe.
Separate trend direction from momentum
Trend and momentum describe related but different conditions. Trend analysis asks about the direction and structure of price movement over a chosen period. Momentum analysis asks about the pace or force of that movement. A market can remain in an upward trend while its momentum weakens, particularly during a pullback or a period of consolidation.
This distinction explains many apparent contradictions between a trend indicator for TradingView and a momentum indicator for TradingView. The trend reading may remain positive because the broader sequence of price swings has not been invalidated. At the same time, momentum may turn negative because recent buying pressure has slowed.
| Observation | Possible interpretation to review | Question for further analysis |
|---|---|---|
| Higher-timeframe trend is positive, lower-timeframe momentum is weakening | A pullback or pause may be developing | Has short-term weakness damaged the broader structure? |
| Higher-timeframe trend is negative, lower-timeframe momentum is rising | A countertrend move or early change may be underway | Is the move supported by a meaningful structural shift? |
| Trend and momentum are both neutral | Price may be range-bound or indecisive | What evidence would distinguish a breakout from a false move? |
| Trend and momentum agree briefly after a sharp move | The readings may reflect recent acceleration | Has the move persisted long enough to deserve more weight? |
None of these combinations provides a guaranteed outcome. They are classifications that help organise the next review. Treating momentum as a confirmation of trend, rather than a replacement for it, can prevent a short-lived fluctuation from being mistaken for a complete directional reversal.
Check whether the price structure supports the reading
Indicators are most useful when their readings are examined alongside the price structure they describe. Look at the sequence of relevant swing highs and lows, the boundaries of any visible range, and whether a recent break has held or quickly reversed. The purpose is not to force price action to agree with an indicator. It is to determine whether the indicator is describing a change that is visible in the chart.
Questions to ask about structure
- Has price created a new swing high or swing low on the timeframe being reviewed?
- Was a structure break confirmed by a completed candle, or did price only move briefly beyond a level?
- Is the current movement occurring inside a larger range?
- Does the lower-timeframe change remain small relative to the higher-timeframe structure?
- Has a previous support or resistance area been tested, rejected, or clearly broken?
A market structure indicator can help organise these observations, but it should not remove the need for interpretation. Labels and alerts may draw attention to a possible development; they do not by themselves explain whether the development is temporary, significant, or relevant to the trading plan.
Investigate the source of the disagreement
Once the readings have been documented, classify the disagreement. Different types of conflict require different follow-up questions. A lower timeframe that turns bearish during a higher-timeframe uptrend is not the same situation as a higher timeframe that has turned bearish while a lower timeframe is still rising.
Pullback versus reversal
A pullback is a period of movement against the recent trend that has not yet changed the broader structure. A reversal involves a more meaningful change in direction. The distinction cannot be decided from one indicator reading alone. Review whether important swing points have changed, whether the move is persisting, and whether the higher timeframe is beginning to respond.
Lagging response versus early information
Higher-timeframe indicators often change more slowly. That can make them appear late when a new move is developing. Conversely, a lower-timeframe reading can change quickly and then reverse. Documenting when each reading changed helps show whether the disagreement reflects a normal timing difference rather than a direct contradiction.
Range conditions versus directional conditions
Many directional tools are easier to interpret when price is moving persistently in one direction. In a range, short-term readings may alternate as price moves between boundaries. If the chart shows repeated reversals near similar levels, investigate the range first rather than treating every change as a new trend.
Calculation or setting differences
Check that the charts use the same indicator version, inputs, data source, session settings, and relevant display options. A disagreement caused by different settings is not the same as a disagreement caused by market behaviour. Keep the review consistent before drawing conclusions from the comparison.
Use a decision hierarchy instead of counting signals
When several charts are open, it can be tempting to count bullish and bearish readings. That approach gives every timeframe equal weight even when the charts have different purposes. A clearer method is to create a hierarchy of questions.
- Context: What is the broad market structure on the higher timeframe?
- Condition: Is the intermediate timeframe developing in alignment with that context, moving against it, or remaining neutral?
- Recent behaviour: What is the lower timeframe showing about current momentum and local price action?
- Conflict: Which observation disagrees with the others, and how large is that disagreement?
- Validation: What specific evidence would strengthen or weaken the current interpretation?
- Action threshold: Does the trading plan permit a decision under the present uncertainty, or is more review required?
This hierarchy does not tell a trader what position to take. It provides a disciplined way to decide whether the available information is coherent enough for the trader’s own rules. If the higher timeframe is unclear and the lower timeframe is volatile, the appropriate conclusion may simply be that the market requires more observation.
Review multi-factor readings one component at a time
Some TradingView tools bring several analytical ideas into one interface. A market intelligence indicator may include trend analysis, momentum evaluation, market structure, institutional activity, multi-timeframe assessment, and smart money analysis. Seeing several components together can be useful, but it can also encourage the reader to treat a collection of signals as one unquestionable answer.
Instead, review each component separately. Ask what the trend element says, what the momentum element says, whether the market structure supports either reading, and whether any institutional-flow or smart-money information is confirming, conflicting with, or simply adding context. The goal is to understand the disagreement rather than hide it beneath a combined label.
| Component | Useful review question |
|---|---|
| Trend analysis | What direction does the selected timeframe describe? |
| Momentum evaluation | Is recent movement strengthening, weakening, or fluctuating? |
| Market structure | Have important highs, lows, or boundaries changed? |
| Institutional activity or flow context | What additional market information is being presented, and how does it relate to price? |
| Smart money analysis | Which conditions are being highlighted, and what remains unconfirmed? |
The same review discipline applies when using the AKMelytics – Market Intelligence Indicator from VP ALGO TRADING. Its role is to assist with evaluating market conditions and potential setups, not to replace a trading plan or provide financial advice. Traders should understand the indicator’s display and use support resources for installation, activation, or usage questions when needed.
Document uncertainty and define the next review
A useful journal entry does not need to end with a prediction. It can end with a testable question. For example, if the daily chart remains constructive while the hourly chart weakens, write down whether the hourly structure must recover or whether a daily support area must fail before the interpretation changes.
Set a clear review condition rather than repeatedly checking the chart without a purpose. The condition might involve a completed candle, a change in swing structure, a sustained momentum reading, or alignment between two previously conflicting timeframes. The exact condition should come from the trader’s own method and risk rules.
When chart readings disagree, the most useful output may be a better question rather than an immediate directional conclusion.
Keep the record factual. Note what was visible, what changed, and what remained uncertain. Avoid rewriting the explanation after the market moves. Consistent documentation makes it easier to evaluate whether the review process is helping you distinguish short-term noise from more meaningful changes.
Common mistakes when charts disagree
- Choosing the most convenient timeframe: Selecting the reading that supports an existing opinion creates confirmation bias.
- Assuming the highest timeframe is always correct: Higher-timeframe context is valuable, but it may not reflect a developing change immediately.
- Treating every lower-timeframe reversal as a new trend: Short-term fluctuations can occur inside a broader directional move.
- Counting signals without defining their roles: Three lower-timeframe readings should not automatically outweigh one higher-timeframe context reading.
- Ignoring range conditions: Alternating signals may reflect consolidation rather than repeated trend changes.
- Changing settings until readings agree: Settings should be selected for a reason and kept consistent during the review.
- Using an indicator as a guarantee: No indicator removes uncertainty or eliminates trading losses.
A practical review checklist
Use the following checklist whenever a trend indicator for TradingView produces different readings across charts:
- Label each timeframe by its role: context, setup development, or recent behaviour.
- Record the directional, momentum, and structural observations separately.
- Identify whether the disagreement is a pullback, possible reversal, range condition, timing difference, or settings issue.
- Compare the indicator reading with completed price structure rather than an unfinished candle alone.
- Write one or two questions that would make the interpretation clearer.
- Define what evidence would change the current view.
- Apply the trading plan’s own risk and decision rules before considering any action.
This checklist is designed to improve the quality of analysis, not to produce a guaranteed signal. Indicators and algorithmic trading tools can organise information, but the final interpretation remains dependent on the trader’s method, risk tolerance, market context, and discipline.
Frequently asked questions
Why does my trend indicator for TradingView show different directions on different charts?
Each timeframe processes a different set of candles and may capture a different stage of the market. A lower timeframe can show a pullback while a higher timeframe still shows the broader trend.
Should the higher timeframe always override the lower timeframe?
Not automatically. The higher timeframe can provide broader context, while the lower timeframe may reveal a developing change. Define the role of each chart before deciding how much weight to give its reading.
What should I do when trend and momentum indicators disagree?
Separate direction from pace. A trend can remain positive while momentum weakens. Review price structure, the duration of the change, and the specific evidence needed to distinguish a pullback from a reversal.
Can a market structure indicator resolve conflicting timeframe readings?
It can help organise swing points, breaks, and ranges, but it cannot guarantee the correct interpretation. Use it as one part of a broader review that includes price behaviour and timeframe context.
How many timeframes should I compare?
There is no universal number. Use enough charts to answer your defined context, setup, and recent-behaviour questions without creating unnecessary signal conflict.
Can a multi-factor TradingView indicator replace a trading plan?
No. A multi-factor tool can assist with reviewing trend, momentum, market structure, and other conditions, but it does not replace personal rules, risk management, or independent decision-making.
What should I record in a trading journal when readings conflict?
Record the timeframe, indicator state, price structure, recent change, source of disagreement, and the evidence that would alter your interpretation. This creates a reviewable process instead of relying on memory.


Recent Comments