
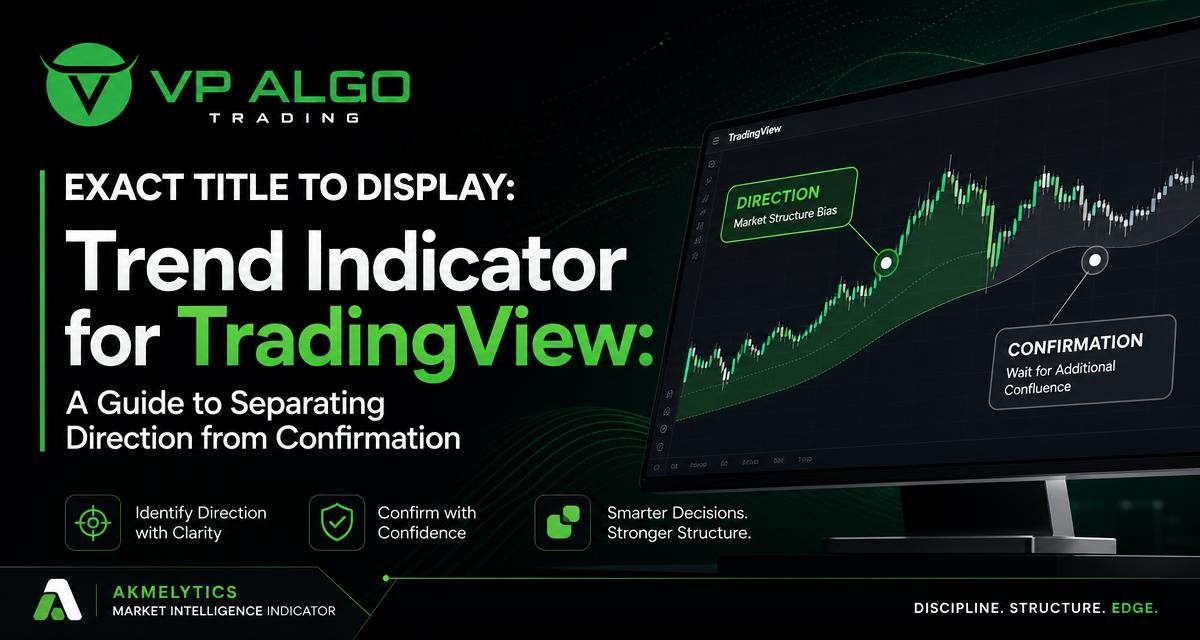
A trend indicator for TradingView can help traders describe the broader direction of a market, but direction alone is not the same as a complete trading setup. A more structured process separates the question of where price is generally moving from the question of whether current conditions support a potential trade. This distinction can make chart analysis clearer and reduce the temptation to treat one indicator reading as a decision by itself.
What a trend indicator actually tells you
Trend indicators are designed to simplify price behaviour into a directional view. Depending on the tool, that view may be based on moving averages, price swings, momentum calculations, volatility, or a combination of inputs. The output may appear as a line, colour change, band, label, or trend state on a TradingView chart.
The central question is usually straightforward: is the market showing a bullish, bearish, or less directional condition on the selected timeframe? That information can provide context, but it does not automatically explain the quality of a particular entry. A market can have a broad upward bias while still pulling back, consolidating, or breaking below a nearby support area.
Direction is a context, not a complete signal
When traders use a trend indicator as a complete buy-and-sell system, they may overlook important details. A bullish trend reading does not describe the distance to resistance, the strength of the latest move, or whether price is extended after a rapid advance. Similarly, a bearish reading does not establish that a new short setup is available at the current price.
It is more useful to treat the trend reading as a filter or starting point. It can help organise the chart before you study market structure, momentum, liquidity behaviour, and the location of price relative to recent highs and lows.
Trend identification versus confirmation
Trend identification answers a broad question: what directional context is visible over the chosen period? Confirmation addresses a narrower question: does the current price action provide enough supporting evidence to consider the context relevant to this particular setup?
| Analysis task | Main question | Examples of information |
|---|---|---|
| Trend identification | What is the broader directional bias? | Higher highs, lower lows, moving-average alignment, or a trend state |
| Market structure | How is price organising its swings? | Breaks of structure, swing points, support and resistance zones |
| Momentum assessment | How forcefully is price moving? | Acceleration, weakening participation, or a possible loss of momentum |
| Institutional or smart money analysis | What additional price and flow conditions deserve attention? | Areas associated with order-flow interpretation or liquidity behaviour |
| Trade planning | Where would the idea be invalidated? | Defined conditions, risk limits, and a clear reason for standing aside |
These categories overlap, but they should not be confused. A market structure indicator may show that a recent swing has changed, while a trend indicator still reflects the prior broader direction. That difference is not necessarily an error. It may indicate that the market is transitioning, or that the two tools are evaluating different time horizons.
Why timeframe matters when reading trend
A trend is always relative to a timeframe. A chart can be bullish on a higher timeframe and bearish on a lower timeframe at the same moment. For example, a longer-term sequence of higher highs may remain intact while a shorter-term chart shows a pullback with lower highs and lower lows.
This is why a trend indicator for TradingView should be read with its timeframe clearly in mind. Without that context, traders may interpret a lower-timeframe change as a complete reversal when it may only be a correction within a larger move.
A simple multi-timeframe framework
- Start with the broader chart. Identify whether the higher timeframe is trending, consolidating, or transitioning.
- Move to the working timeframe. Observe whether the current price action agrees with or temporarily differs from the broader context.
- Use the entry timeframe carefully. Look for a clearly defined event or condition rather than reacting to every colour change or label.
- Record disagreement. Conflicting timeframes are information. They may call for patience rather than an immediate decision.
Multi-timeframe analysis is not a guarantee of better results. Its purpose is to make the relationship between broad direction and short-term movement more visible.
Where a market structure indicator fits
A market structure indicator focuses on the organisation of price swings. It may help identify areas such as swing highs, swing lows, breaks in structure, or changes in the sequence of price movement. This makes it useful for testing whether a trend reading is supported by recent behaviour.
Suppose a trend tool shows a bullish condition. A trader could then examine whether price is still forming higher lows and whether a recent high has held or been broken. If those observations disagree, the bullish reading may need to be treated as background context rather than immediate confirmation.
Questions to ask about structure
- Is price making a sequence of higher highs and higher lows, or lower highs and lower lows?
- Has a meaningful swing level been broken, or was the movement only a small intrabar fluctuation?
- Is price trending cleanly, or moving sideways between recognisable boundaries?
- Where would the current structural interpretation no longer make sense?
Structure should be interpreted consistently. Changing the definition of a significant swing after every price movement can create a chart that appears to confirm any preferred view.
How momentum adds a different type of confirmation
Trend and momentum are related, but they measure different aspects of market behaviour. Trend describes directional organisation over a chosen period. Momentum concerns the force or speed behind a move and whether that force appears to be strengthening or weakening.
A bullish trend with weakening momentum may still remain bullish, but it can signal that conditions are less decisive than they were earlier in the move. A bearish trend with improving momentum may suggest that downside pressure is becoming more pronounced. Neither observation predicts what will happen next; each simply adds another layer to the analysis.
Avoid using several tools that say the same thing
Adding more indicators does not automatically create stronger confirmation. Several tools may be derived from similar price data and therefore produce similar signals. If three indicators all respond to the same moving-average relationship, their agreement may provide less independent information than it appears to.
A more balanced chart might combine a directional tool with a market structure view and a separate momentum or volatility perspective. The aim is not to fill the screen. It is to ask different questions without creating unnecessary complexity.
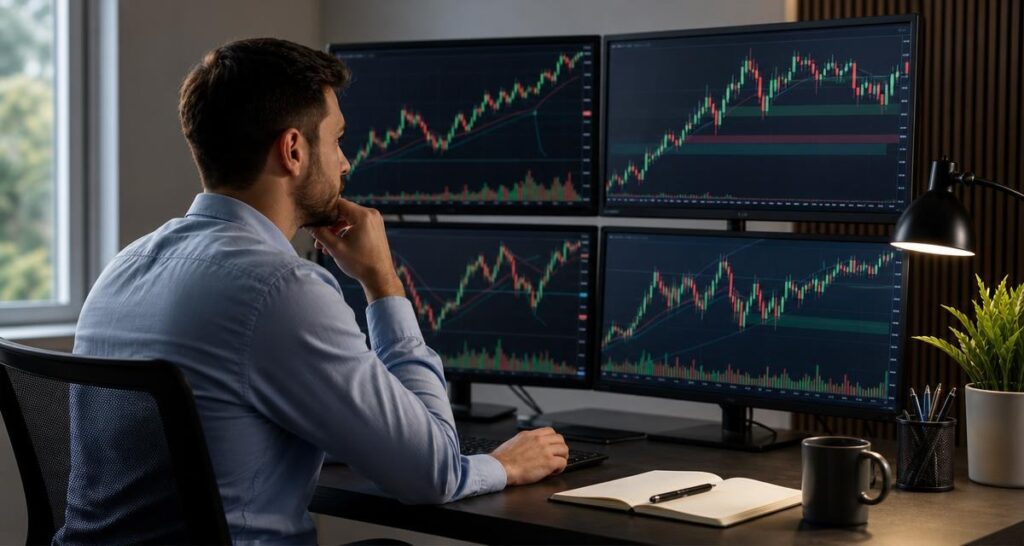
Using smart money and institutional activity features carefully
Smart money concepts and institutional activity features are often used to study liquidity, significant price areas, and the behaviour of larger market participants as interpreted through price and volume-related information. These features can help traders examine why a move may be developing, but they should not be treated as direct access to the intentions of every institution in the market.
When used alongside a trend indicator, these tools can serve as additional context. For instance, a trader may first identify a broad directional bias, then study whether price is approaching a relevant area or showing behaviour that supports continued movement. The result is a more deliberate process than taking every trend change as an entry signal.
VP ALGO TRADING develops TradingView indicators that bring together areas such as trend analysis, momentum evaluation, market structure, institutional flow monitoring, multi-timeframe assessment, and smart money analysis. Its AKMelytics – Market Intelligence Indicator is positioned as an analytical tool for evaluating market conditions and potential setups, not as a substitute for a trader’s own process or financial advice.
A practical workflow for a TradingView chart
The following workflow can help separate directional context from confirmation without turning the chart into a collection of unrelated signals.
- Define the chart purpose. Decide whether you are studying a broad market condition, planning a swing idea, or reviewing short-term price action.
- Read the higher-timeframe trend. Note whether the market is directional, range-bound, or moving through a transition.
- Mark important structure. Identify recent swing points and areas where the current interpretation would change.
- Review current momentum. Ask whether price is accelerating, stalling, or moving with mixed strength.
- Check location. A directional bias has different meaning near a major swing level than in the middle of an established range.
- Look for agreement across evidence. Confirmation should come from a coherent combination of observations, not simply from more coloured labels.
- Define invalidation before acting. If the market does not behave as expected, know what evidence would make the idea unsuitable.
- Document the decision. Recording the trend, structure, confirmation and reason for standing aside can reveal repeated mistakes over time.
Common mistakes when using trend indicators
Entering immediately after a trend change
A trend label can change after a sharp move has already occurred. Entering solely because the label changed may mean reacting late or ignoring nearby structure. Waiting for the rest of the chart to be evaluated can produce a more measured decision.
Ignoring sideways conditions
Many trend tools are less informative when price is moving in a range. Repeated changes between bullish and bearish readings may reflect market noise rather than a sequence of meaningful reversals. Recognising when the market lacks clear direction is itself a useful analytical conclusion.
Confusing confirmation with certainty
Confirmation does not remove uncertainty. It means that multiple observations point in a compatible direction at a particular moment. Markets can still move unexpectedly, and no indicator eliminates losses or guarantees a result.
Changing settings until the chart looks perfect
Frequent adjustment of indicator settings can make historical charts appear more convincing than they would have been in real time. Settings should be chosen for a clear analytical reason and evaluated consistently rather than changed to fit each past move.
How to evaluate a trend indicator for TradingView
When reviewing any TradingView trading indicator, focus on how it fits your process rather than asking whether it is universally the best indicator. A useful tool should be understandable enough for you to explain what it measures, when it becomes less reliable, and how it interacts with the rest of your chart.
- Can you identify the timeframe behind its trend reading?
- Does it help you distinguish trending markets from consolidating markets?
- Can you combine it with structure and momentum without duplicating the same signal?
- Are its labels clear enough to review consistently?
- Does it support planning and review instead of encouraging impulsive entries?
- Can you describe situations in which you would ignore or defer its reading?
VP ALGO TRADING provides indicators and trading software tools for TradingView. The company also offers a request-based seven-day free trial for its indicator and Telegram channel, with product access and installation or usage support handled according to its stated process. Traders should review the available product information and assess whether the tool fits their own educational and analytical needs.
Final perspective
A trend indicator for TradingView is most useful when it establishes context rather than attempting to answer every trading question. Direction can tell you how the market is broadly organised, while market structure, momentum, location and smart money analysis can help you examine whether the current conditions support further attention.
Keeping these roles separate makes chart reading more disciplined. It also helps prevent a common mistake: treating agreement between several labels as certainty. A structured process still requires independent judgement, defined risk, and the willingness to stand aside when the evidence is unclear.
Frequently asked questions
What is a trend indicator for TradingView?
It is a charting tool that helps describe directional conditions on a selected TradingView timeframe. It may use price, moving averages, momentum, volatility, or other calculations to show a bullish, bearish, or less directional state.
Is a trend indicator the same as a buy-and-sell indicator?
Not necessarily. A trend indicator generally describes direction. A buy-and-sell tool may add entry rules or other conditions, but no indicator guarantees profitable outcomes or removes trading risk.
Why use a market structure indicator with a trend tool?
Market structure can show how recent highs, lows and breaks relate to the broader trend reading. This helps distinguish a possible continuation from a short-term pullback or a developing transition.
Should trend and confirmation be checked on the same timeframe?
They can be reviewed on the same timeframe, but many traders also compare higher and lower timeframes. The key is to understand which timeframe each reading represents and to treat disagreement as information rather than an automatic signal.
Can several indicators provide too much confirmation?
Yes. Indicators based on similar inputs may repeat the same information. A smaller group of tools that answer different questions can be easier to interpret than a crowded chart with multiple versions of the same signal.
Does confirmation make a trade certain?
No. Confirmation only means that several observations are currently compatible. Market conditions can change, and traders still need their own process for risk, invalidation and deciding when not to participate.
What does VP ALGO TRADING offer for TradingView users?
VP ALGO TRADING develops and sells TradingView indicators and algorithmic trading tools, including the AKMelytics – Market Intelligence Indicator. Its tools are presented for educational and trading-decision assistance rather than as financial advice.


Recent Comments