
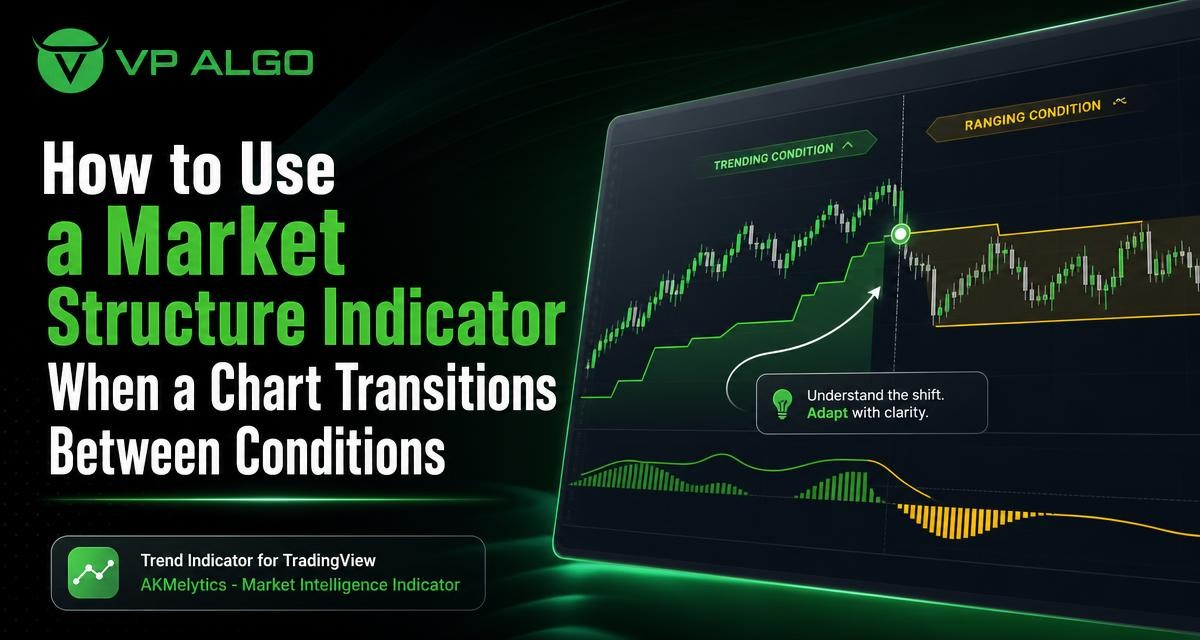
A market structure indicator can help traders organise what is happening on a chart when price moves from a clear trend into consolidation, or from a quiet range into a new directional phase. The most important task is not to follow every signal automatically. It is to review whether price structure, momentum, timeframe alignment and confirmation still support the same interpretation.
Why changing market conditions require a different review
Charts do not remain in one condition indefinitely. A market may form a series of higher highs and higher lows, then begin to move sideways. A bearish sequence can lose momentum before a new bullish structure becomes visible. At other times, price may briefly break a swing level and then return to the previous range. These transitions create uncertainty because the evidence that worked in one phase may be less useful in the next.
During a directional move, traders often focus on continuation. They may assess whether pullbacks are holding previous swing areas and whether momentum remains consistent with the broader move. In a less defined condition, the same approach can lead to repeated entries near the middle of a range or cause a trader to treat a temporary break as a confirmed reversal.
A market structure indicator is best viewed as a review aid. It can make swing points, structural breaks or directional bias easier to examine, but it does not remove the need for context. Price behaviour, timeframe, volatility and the trader’s own rules still matter.
What market structure means in practical chart analysis
Market structure describes the sequence and relationship of meaningful price swings. In a rising structure, the chart may show higher highs and higher lows. In a falling structure, lower highs and lower lows may dominate. When neither side consistently controls the sequence, the chart may be forming a range or a transitional condition.
The word meaningful matters. Not every small candle movement changes the broader structure. A useful review separates minor fluctuations from swing points that have influenced subsequent price action. The exact settings used by an indicator can affect which movements are highlighted, so traders should understand how the tool defines or displays a structural event.
| Chart condition | Typical structural evidence | Questions to review |
|---|---|---|
| Directional rise | Higher highs and higher lows remain visible | Are pullbacks holding above relevant swing areas? |
| Directional decline | Lower highs and lower lows remain visible | Is selling pressure still producing new lows? |
| Range or consolidation | Price repeatedly reacts between boundaries | Is price near an edge or in the middle of the range? |
| Transition | A previous sequence weakens or a key swing is challenged | Has the change been confirmed, or is it only a temporary move? |
Start by identifying the condition before reading the signal
Before interpreting a mark, line or alert from a market structure indicator, describe the chart in plain language. Is price trending, ranging, breaking out, pulling back or moving without a clear sequence? This simple step prevents the indicator from becoming the starting point for a conclusion that the broader chart does not support.
One practical method is to inspect the chart from left to right and identify the latest confirmed swing highs and swing lows. Then ask whether the most recent price action is extending the previous pattern, challenging it or remaining inside an established area. The goal is not to predict the next move. It is to establish what the chart has actually demonstrated so far.
Questions for a directional chart
- Are successive swing points still progressing in the same direction?
- Do pullbacks remain orderly, or are they becoming deeper and less consistent?
- Is momentum supporting the move, or is price advancing with visibly weaker follow-through?
- Has price reached a previously important area where continuation may become less certain?
Questions for a less defined chart
- Are repeated highs and lows forming a recognisable range?
- Is the current price near a boundary or close to the centre of the range?
- Have apparent breaks closed beyond a relevant level, or only moved through it briefly?
- Is there enough follow-through to describe the move as a new condition?
Review the transition from trend to consolidation
A trend-to-range transition often begins quietly. Price may continue making new highs, but each advance becomes shorter or is followed by faster retracement. Alternatively, a downtrend may stop producing meaningful lower lows. The first sign is usually a change in the quality of movement rather than a single decisive signal.
When a market structure indicator shows that the previous sequence is weakening, review the relationship between the last confirmed swing and current price. A broken trend line or isolated countertrend candle is not necessarily enough to establish a new range. Look for repeated reactions, overlapping price movement and a failure to sustain continuation beyond the prior structure.
In a consolidation phase, directional signals may produce less reliable context because price is moving between competing boundaries. A trader using a trend indicator for TradingView may therefore need to reduce the weight given to trend-following information until the chart shows clearer expansion in one direction.
Review the transition from consolidation to a directional move
A range can also develop into a new directional phase. The first move beyond a boundary attracts attention, but a boundary break alone does not answer every review question. Traders may examine whether price closes beyond the area, whether the next reaction holds outside it and whether subsequent movement begins to form a new sequence of highs and lows.
This process helps distinguish a developing move from a brief excursion beyond the range. A return inside the previous boundaries does not automatically prove that the breakout has failed, but it does weaken the initial interpretation. The appropriate conclusion depends on the chart timeframe, the size of the range and the trader’s predefined rules.
A practical confirmation sequence
- Mark the established range or key structural boundaries.
- Observe whether price moves beyond one boundary with a meaningful close.
- Check whether the next pullback respects the broken area or quickly returns through it.
- Look for a new sequence of swings rather than relying on the first candle outside the range.
- Compare the move with momentum and higher-timeframe context before treating it as a confirmed directional condition.
This sequence is a framework for analysis, not a guarantee of a particular outcome. Markets can break, retest and reverse, especially when the surrounding context is unclear.
Use multiple timeframes to separate noise from context
A structural change on a short timeframe may be a minor pullback within a larger trend. Conversely, a seemingly small shift on a higher timeframe may carry more significance for the chart being reviewed. Multiple-timeframe analysis helps place the latest signal within a broader sequence.
Start with the timeframe that defines the main context for the analysis. Then move to a lower timeframe only to inspect detail, not to replace the higher-timeframe view. If the broader chart is consolidating while the lower chart shows alternating bullish and bearish signals, the lower-timeframe activity may reflect movement within the range rather than a sustained trend.
| Review layer | Purpose | Potential mistake |
|---|---|---|
| Higher timeframe | Establish the broader structural condition | Ignoring the wider range or trend |
| Primary analysis timeframe | Evaluate the setup and recent transition | Changing the interpretation after every small swing |
| Lower timeframe | Inspect entry detail and short-term behaviour | Treating short-term noise as a major reversal |

Combine structure with momentum, flow and price behaviour
Structure explains the sequence of swings, but it is only one part of a chart review. Momentum can help show whether a move is gaining or losing force. Activity-related information may add context about participation, while price behaviour shows whether a level is being accepted or rejected. These elements should support a clear question rather than create a collection of unrelated signals.
For example, a new structural high accompanied by weak continuation may deserve a different review from a new high followed by sustained movement and orderly pullbacks. Similarly, a downside break from a range may need closer examination if price quickly returns inside the previous boundaries. A smart money indicator or institutional flow indicator can be considered as an additional analytical input, but it should not be treated as proof of what every market participant is doing.
When using a TradingView trading indicator, write down what each tool is intended to answer. A structure feature may help identify swing relationships. A momentum feature may help assess the strength of a move. A trend feature may help frame directional bias. Keeping these roles separate reduces the temptation to count several versions of the same information as independent confirmation.
How to handle conflicting readings
Transitions often create disagreement between indicators. A market structure indicator may show a developing bullish sequence while momentum remains weak. A trend indicator for TradingView may retain a bullish bias while price has entered a broad range. These differences are not necessarily errors. They may reflect different calculation methods, timeframes or response speeds.
When readings conflict, return to the underlying price action. Ask which observation is confirmed by completed swings and sustained movement, and which one is reacting to a recent candle. It can also be useful to classify the situation as “uncertain” rather than forcing a bullish or bearish label.
- Check whether the indicators are being read on the same timeframe.
- Identify which signal is leading and which is confirming.
- Review whether price is inside a range where directional signals may alternate.
- Wait for the condition that your written trading plan defines as confirmation.
- Avoid adding more indicators simply to resolve a disagreement.
Common mistakes when using a market structure indicator
Treating every break as a reversal
A minor breach of a swing point can occur within normal market noise. Calling it a complete reversal without checking follow-through can create a sequence of premature interpretations. Define in advance what makes a structural break meaningful for your method.
Using the tool without understanding its settings
Different settings can change how quickly swings are identified and how many minor movements appear on the chart. If the display is too sensitive, the chart may look more active than the underlying condition. If it is too slow, an emerging change may appear only after a substantial move. Review the tool’s documentation and observe how its markings relate to completed price action.
Ignoring the middle of a range
Range boundaries generally provide more useful context than the centre of a range. In the middle, the distance to either side may be limited while direction remains uncertain. A market structure indicator can highlight the condition, but the trader still needs to consider location within the broader movement.
Confusing information with a trading decision
An indicator can organise evidence without deciding whether a trade fits a person’s risk limits, time horizon or plan. VP ALGO TRADING positions its indicators as tools for education and trading-decision assistance rather than official financial advice. Traders remain responsible for evaluating their own methods and risk.
A repeatable review checklist
Use a short checklist whenever the chart appears to be changing condition. A repeatable process can make analysis more consistent and reveal when the available evidence is incomplete.
- State the current condition: trend, range, breakout attempt, pullback or unclear.
- Mark the latest meaningful swing high and swing low.
- Compare current price with those structural reference points.
- Check whether momentum agrees with the direction and quality of movement.
- Review the higher-timeframe context.
- Assess whether the price is near a range boundary or in the middle of a range.
- Define what confirmation or invalidation would look like under your own rules.
- Record the reasoning before reviewing the eventual outcome.
The final step matters because it separates a sound process from hindsight. A correct analysis can still produce an unexpected market outcome, while an unclear analysis can occasionally be followed by a favourable move. Reviewing the reasoning helps improve the method without assuming that any indicator can eliminate uncertainty.
Where a TradingView indicator can fit into the process
TradingView users often combine several forms of technical analysis in one workspace. A market structure indicator may provide a visual framework for swing relationships, while other features address trend, momentum or smart money concepts. The value of that layout depends on whether it makes the review clearer rather than more crowded.
VP ALGO TRADING develops and sells indicators and algorithmic trading tools for TradingView, including the identified AKMelytics – Market Intelligence Indicator. The company also describes indicator capabilities related to trend analysis, momentum, market structure, institutional activity, multi-timeframe assessment and smart money analysis. Traders considering any such tool should first understand what its displays represent, how it fits their process and what limitations remain.
Access and usage questions can be directed to the company through its support process. The supplied business information also states that a request-based seven-day free trial is available for its indicator and Telegram channel. Trial or product conditions should be confirmed directly with VP ALGO TRADING before relying on them.
Final perspective
The most useful role for a market structure indicator is to improve the quality of questions asked during a transition. Is the existing trend still intact? Has a range formed? Did price truly accept a new level? Does the higher timeframe support the short-term reading? These questions are more valuable than reacting to a label in isolation.
When structure, momentum and timeframe context point in the same direction, the chart may offer a clearer basis for further review. When they disagree, uncertainty is itself useful information. Treat the indicator as part of a disciplined analytical process, not as a substitute for understanding price behaviour or managing risk.
Frequently asked questions
What is a market structure indicator?
A market structure indicator is a charting tool that helps display relationships between swing highs, swing lows and structural changes. It can make trends, ranges and possible transitions easier to review, but it does not predict outcomes or guarantee a trade result.
How can I tell whether a trend is becoming a range?
Look for weaker continuation, repeated reactions between similar boundaries and a failure to maintain a consistent sequence of higher highs and higher lows or lower highs and lower lows. A single countertrend candle is usually not enough by itself.
Should I use a market structure indicator on more than one timeframe?
Multiple timeframes can help distinguish a major structural change from short-term noise. Use the higher timeframe for context, the primary timeframe for analysis and a lower timeframe only for additional detail that fits your plan.
What should I do when a structure signal conflicts with momentum?
Review which observation is based on confirmed price action and whether both tools use the same timeframe. If the conflict remains, classify the condition as uncertain and follow the confirmation rules in your trading plan rather than forcing a directional conclusion.
Can a market structure indicator identify a valid breakout?
It can help organise the evidence around a breakout, such as the relevant boundary and subsequent swing formation. Confirmation still depends on the trader’s rules, follow-through and broader market context. No indicator can guarantee that a breakout will continue.
Is a market structure indicator financial advice?
No. An indicator is an analytical tool. VP ALGO TRADING states that its indicators are intended for educational and trading-decision assistance purposes rather than official financial advice. Traders should make their own decisions and consider their risk carefully.


Recent Comments